PpSignal LONG SHORT BTC SIGNALanalyzing the open buy or sell positions, we have developed an indicator that avoids falling into trading traps
加密數字貨幣
QuantCat Rainbow RibbonQuantCat Rainbow Ribbon
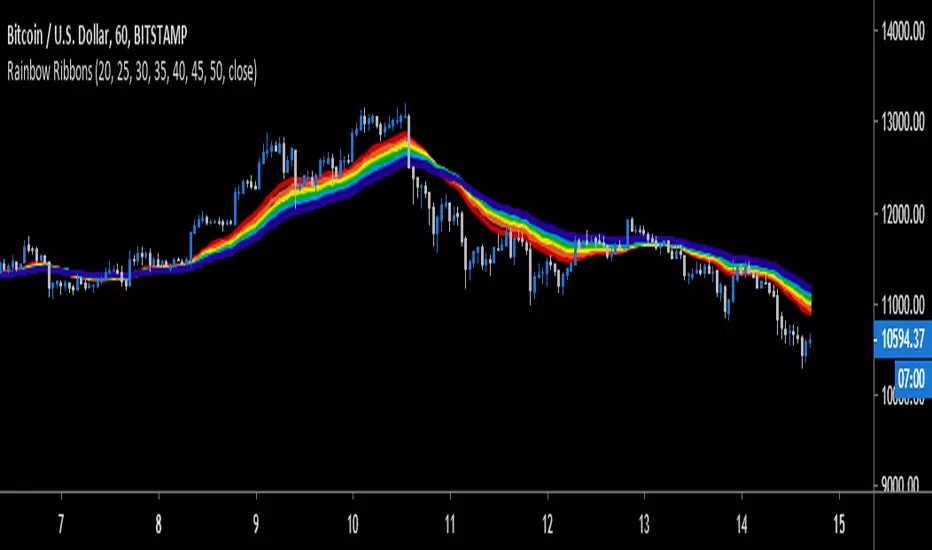
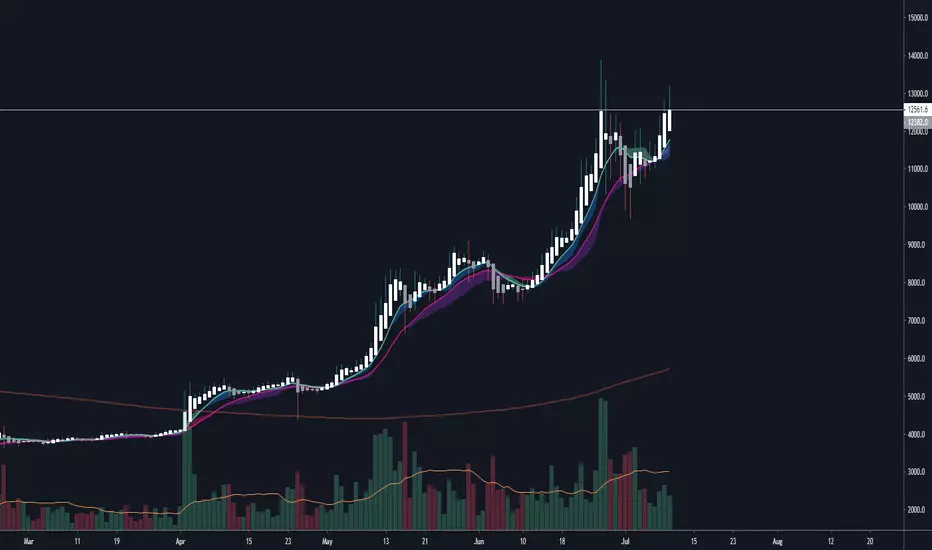
The Rainbow Ribbon is a conglomerate of exponential moving averages of increasing time period plotted on a graph. The ribbon is used to help identify the strength of a trend while also helping spot timely market reversals.
It consists of a 20, 25, 30, 35, 40, 45, and 50 EMA which are interchangeable values for your preference.
Generally in bullish conditions, the price action will be trading on top of the ribbon with the top EMA’s in the ribbon acting as support. In bearish conditions, the price action will be trading underneath the ribbon with the bottom EMA’s acting as resistance.
As shown in the chart above, when the candles penetrate the Rainbow Ribbon and the EMA’s start to converge/cross, market reversal probabilities increase. With this information we can take trades or add to the general consensus of a potential trade.
Be sure to follow us so you're kept up with our projects and any updates to the script!
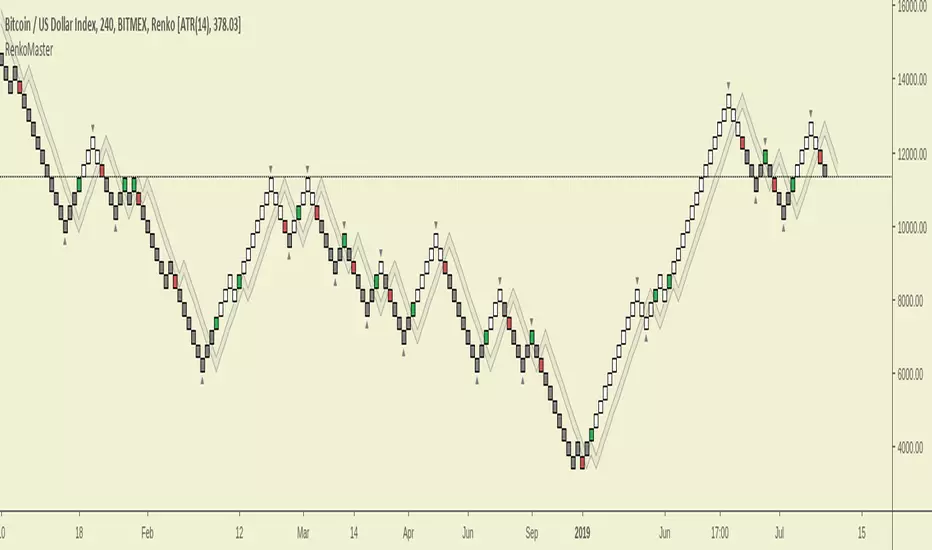
RenkoMasterRenkoMaster is a variant of our popular TrendMaster Script with adjusted parameters. It can be used to provide confluence when determining Renko entries and exits.
Setting Up The Indicator
After purchase, open the TradingView indicator library. Under the Invite-Only Scripts section, you will see RenkoMaster. Add it to your chart. Next, you must customise your theme settings to allow RenkoMaster to take over control of your candle colours. You can find a complete set-up tutorial on our website.
Candle Colours
By default, RenkoMaster will colour your candles in black and white. White candles indicate an uptrend in an asset and the candles will not change colour until the trend has reversed and a counter-trend signal has been printed. Black candles indicate a downtrend, they will remain black until a counter-trend long signal candle has been printed.
Signal candles
A signal candle is printed when the price of an asset closes above or below the moving average cloud and the medium term trend moving average. By requiring two criteria for a single candle to print we will see a drastic reduction in the number of false signals.
The RenkoMaster entry technique further reduces the likelihood of false entries. To enter a trade we do not buy the signal block immediately. Instead, we treat the signal block as an indication that a trend change is possible. We want to see confirmation of this trend before making an entry. To enter we place a pending order a few ticks above or below the high or low of the signal block. By doing this we only enter a trade when the asset has shown a continuation in the direction of the suggested trend change.
Our Story
Founded in 2018 by IchimokuScholar and C00kie, TrendMaster is a team that produces technical analysis indicators with an emphasis on simplicity and noise reduction. We support a large community with educational content, automated market scanners and mentoring in our private chat rooms. We produce technical analysis indicators geared primarily towards the emerging Cryptocurrency asset class. We provide educational material to assist trader development and host a large online trend following community. All of our products are designed to help traders distinguish relevant information from background noise. Our indicators encourage disciplined trade management to maximise the opportunity captured while minimising losses.
IchimokuScholar
IchimokuScholar – In 2017 I retired from a career in higher education to focus on Trading. I like to trade long term trends, focusing primarily on continuation setups. I am dedicated to sharing my knowledge of trading and take great pleasure in simplifying technical analysis for newer traders.
C00kie
I started trading crypto in 2017 and immediately started coding a bunch of tools to improve my quality of life. Some definitely worked out better than others. Like to trade the higher timeframes and drawing horizontal lines on charts. I am also pretty much obligated to like cookies.
kiska cloudskiska clouds: crypto twitter's next cloud meme
Crypto is a fast-paced, highly-volatile asset, therefore, many traditional strategies are thrown out of the window when applied to cryptocurrency markets. In trading, there are only two things known for sure: price and volume. Price and volume data is then manipulated using various math equations in an effort to discover patterns and/or make predictions. kiska clouds are no different.
The kiska clouds are a simple crossover strategy. The clouds are different because of the unique averages being used and the embedded momentum indicator.
To use the clouds is simple:
When the green line crosses above the pink line, you buy/long.
When the green line crosses below the pink line, you sell/short.
The clouds are indicative of the trend's momentum. Using the power of math, the larger the cloud indicates a higher amount of buying/selling pressure. As the cloud thins, momentum is slowing, and the trend may be reversing.
At the time of testing, the strategy had a profitability of 54.55% accuracy with 1133.41% net profit. While I think this could be automated into a bot, adding a human element with stop losses and further analysis will significantly improve the accuracy/profitability.
This indicator is a "Pay What You Want" model. For a trial or to purchase this indicator, send me a message on Twitter @moonkiska or here on TradingView. You will be granted a 2-3 day trial period to the backtesting strategy.
Tips:
The higher the time frame, the more accurate the strategy.
Personally, I do not short above the 200MA. I do not long below the 200MA.
Coming Soon:
Support/Resistance
Trend Lines
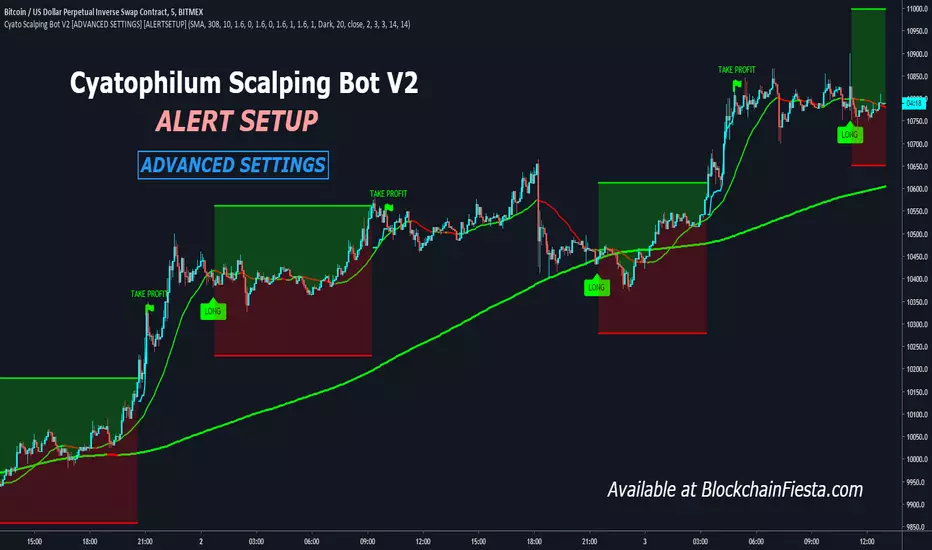
Cyatophilum Scalping Bot V2 [ADVANCED SETTINGS] [ALERTSETUP]Advanced Settings version of Cyatophilum Scalping Bot V2
For people who like tweaking settings =)
Quintalytics TrailingStop MultiTimeQuintalytics TrailingStop MultiTime is a combination of a Trend, Sideways/Chop Detection, and Trailing Stop Loss indicator.
This indicator is suitable for use in all timeframes and markets.
The Multiple time Frame function allows for the TrailingStop to be Calculated from another timeframe and shown in the current chart.
For Example:
4 Hour TrailingStop line on a 60 Minute Chart
Daily TrailingStop line on a 4 Hour Chart
15 Minute TrailingStop line on a 5 Minute Chart
COLORS
The Color GREEN indicates the presence of a Bullish Trend.
The Color RED indicates the presence of a Bearish Trend.
The Color YELLOW indicates that the market is Sideways a.k.a. Flat a.k.a. Choppy.
You have the option of COLORING the BAR to match the current TrailingStop color.
You have the option of applying a Smoothing to the TrailingStop line.
You have the option of showing a Standard Deviation Band based on the TrailingStop line.
SETTINGS
The indicator has seven parameters:
1. Lookback - # of previous bars used to calculate the trailing stop
2. Std Dev Lookback - # of previous bars used to calculate the Standard Deviation
3. Std Dev X – Multiplier of Std dev. i.e. 2 = 2x Std Dev of the TrailingStop line
4. Color Bar? – toggle Coloring of the Candlestick/Bars on the chart
5. Show Std Dev? – toggle showing the Std Dev bands.
6. Smooth? – toggle Smoothing the TrailingStop line
7. Timeframe - Select the time frame used to calculate the TrailingStop (1 Hour, 4 Hours, 1 Day, 1 Week, etc.)
Changing these settings individually or in combination will yield varying results.
2 Alerts are provided with the indicator: CLOSE OVER STOP line and CLOSE UNDER STOP line

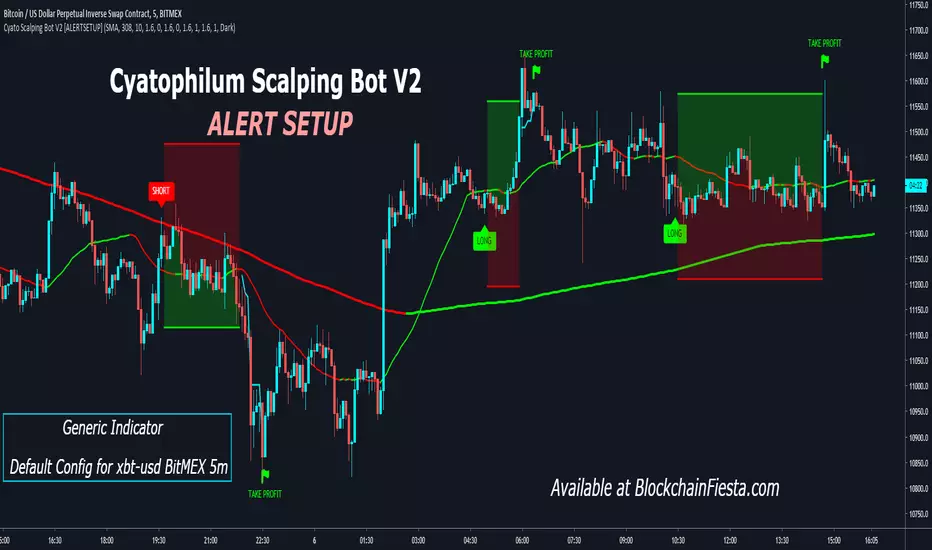
Cyatophilum Scalping Bot V2 [ALERTSETUP]Alert Setup version of Cyatophilum Scalping Bot V2.
Improved version of Cyatophilum Scalping Bot
Default settings for BITMEX:XBTUSD 5m
2% stop loss
2% trailing take profit
Release Notes: Added SMA, EMA and TEMA to the Trend Detector options.

Bitmex Dollar Value CalculatorWith this indicator you can easily calculate either the bitcoin value of a certain amount of dollars or the dollar value of your bitcoin (particularly helpful when trading on bitmex)
Tipjar : 38uGQJDDZDL6wX48x4gYTccPeQ3ZHVYmY4 (btc)

Fully Adjustable BTC Longs/ShortsThis indicator shows you Bitfinex Longs&Shorts charts in one handy indicator. It's fully adjustable to your own prefference.
Tipjar : 38uGQJDDZDL6wX48x4gYTccPeQ3ZHVYmY4 (btc)

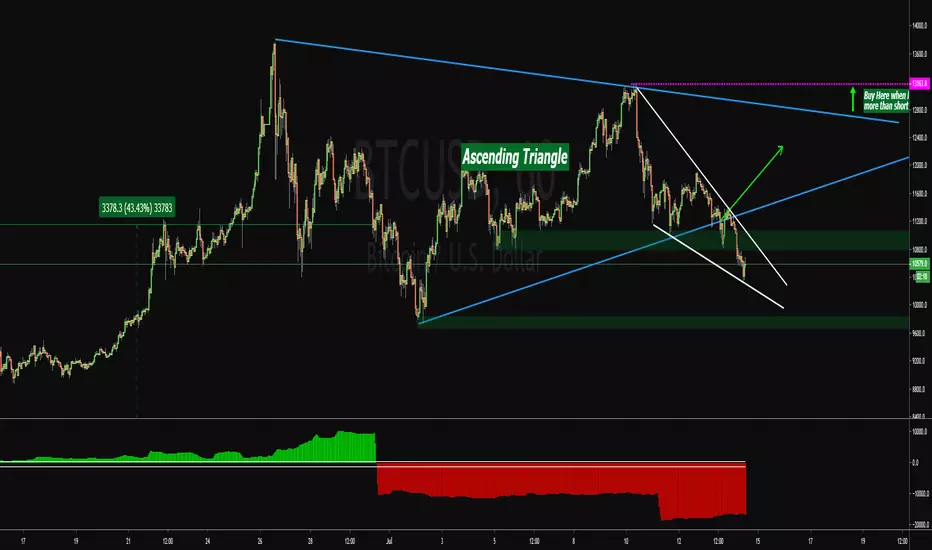
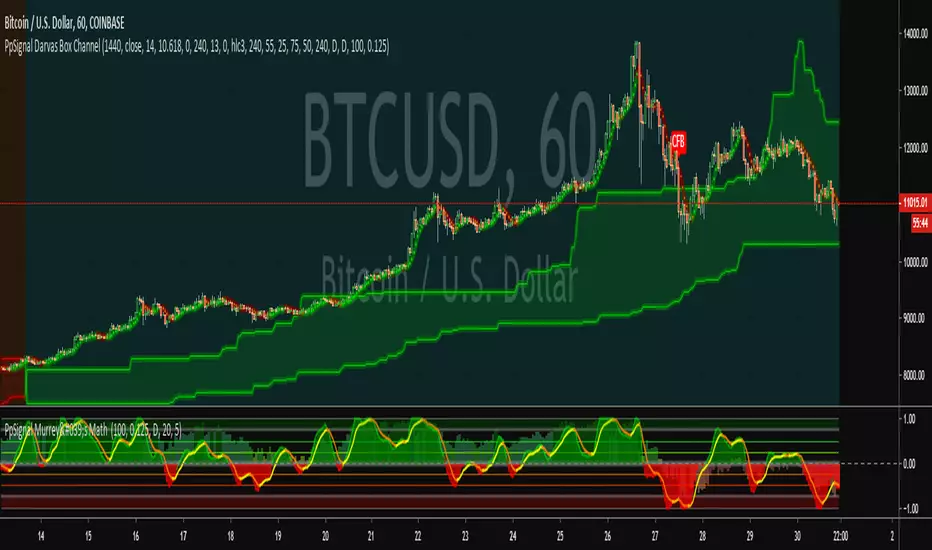
PpSignal Darvas Box ChannelDarvas Box is a great technical analysis indicator, with an interesting background and creator. Nicholas Darvas, a dancer by trade, made $2,000,000 in an 18-month period trading stocks using the Darvas Box method, while traveling the world on dance tours.
I made a darvas box dynamic, which I see more accurate than the darvas box of nicolas
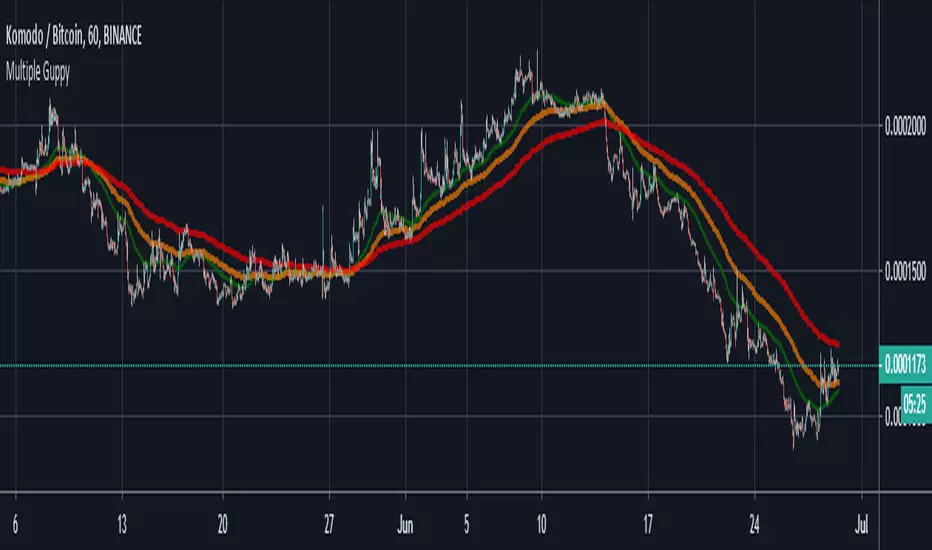
Multiple GuppyGreen crosses DOWN Orange = Early Sell
Green crosses DOWN Orange and Red = Prepare to get out
All crosses DOWN = Strong Sell
Green crosses UP Orange = Early Buy
Green crosses UP Orange and Red = Prepare to get in
All crosses UP = Strong Buy
Easy to observe on 1hr, 2hr, and 4hr charts. Works best on trend reversals.
Good luck.
@eugenie9
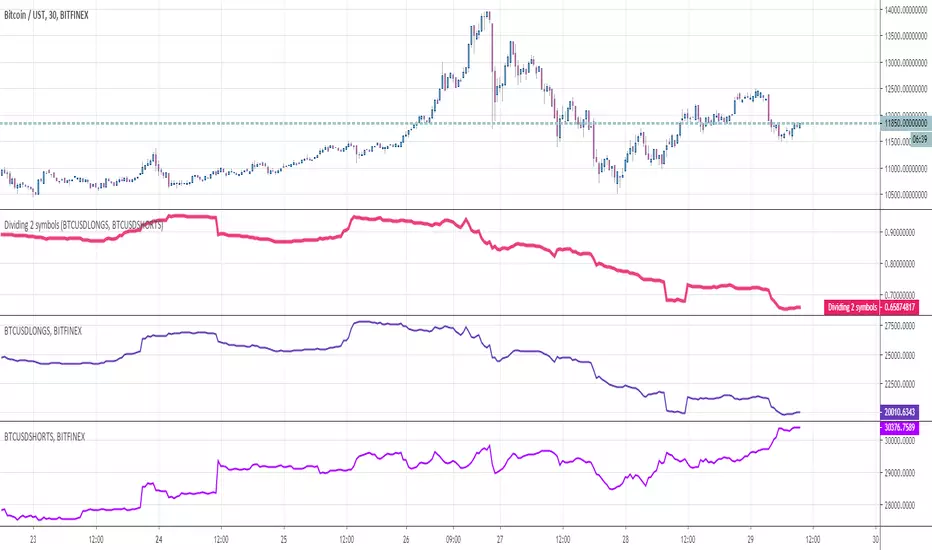
Dividing 2 symbolsHello Traders
This indicator is used to divide two assets between them. Why you would ask ?
For instance, in crypto trading, traders often look at the ratio Longs/Shorts or Shorts/Longs to figure out which side is leading the market and use this information as a powerful hedge for their next trade
Enjoy
Dave
Strategy Builder Crypto V6Hello everyone
This indicator is the result of 7 years of trading (including 3 years of analyzing day and night how crypto assets behave).
I made it fully customizable but I wouldn't recommend changing the default values as they're the most optimal ones for now. Might change in the future but I'm very happy with the signals so far and I hope you'll be as well :)
Without further due, let's dig into it...
0 - Algo trading and Why
In the crypto trading, there is a lot of useless noise (we can probably thank Crypto Twitter for that :p) and a lot of useless data with the sole purpose is to lure you (who said Bitfinex Long/Short ratio or CME gaps ??)
I wanted to remove all the useless and only focus on Technical Analysis (TA) because I was deeply convinced that TA includes by design Fundamental Analysis (FA) and Pumponomics Analysis (PA) - PA being for instance when your favorite twitter guru will pump and dump on you
I heard that so many people got REKT from the previous bear market and I wanted to give back to the community - who helped me so much a few years back.
I worked hard to design the method and make it simple for the public and for FREE (so far as I want to collect feedbacks from the community and improving the indicator)
THIS IS MY GIFT TO YOU
1 - Input values
I'll explain later on through a medium article what each parameter means and how to set them up. For now, please used the optimized and recommended values already set in the indicator
2 - The method
This method works for intraday trading for timeframes between m5 and H1. Any timeframe above could work but would give signals too late - in this case, I would recommend changing the inputs with smaller values to adjust
I see a trend being composed of a main trend, and mini sub trends. In other words, for instance, a weekly bullish trend is made of smaller H4 bullish trends. Hope it makes sense so far
Let's call the weekly trend the MAIN trend and the H4 smaller trends the SECONDARY trends
That's exactly what this indicator is about
It will catch the best MAIN trend and all the SECONDARY trends in the same direction of the MAIN trend.
It's up to you if you want to take all the SECONDARY trends or only the first one in the sequence.
3 - Invalidation signal
A signal invalidation is used to make you exiting your position with a small loss before your stop loss will get hit. Very powerful way to save your capital and limit your losses.
You'll find the indicator here on tradingview for free under the name Trend signal with Alert (made by myself)
Trend signal with Alert
to invalidate entries. You'll need to request an invite
Briefly, let's assume we get a BUY signal. I would exit the position either if I'm getting a DOWN trend signal. It means, if the oblique/logarithmic trendline is broken, then it's better to exit the position and wait for the indicator to give another BUY signal later hopefully
Best case, it will limit your loss in case the asset will dump.
Worst case, this strict management strategy will make you exiting your position for no reason and you'll re-enter later (with a signal) at almost the same price or a bit higher
In the long run, this method will prevent you from having big losses
4 - Stop Loss and Take profits levels
It's really up to you. It depends of your capital and psychology
This indicator is made to give big moves but that's not 100% guaranteed. You can draw some trendlines or use moving averages in big timeframes to set your take profit and stop loss levels.
I personally use this also, along with fibonacci on the weekly/monthly timeframes for my take profit levels
As I'm a nice person, I'm linking the Fibonacci indicator that I use here
Automatic Multi-timeframes fibonacci zones
. You'll also need to request an invite for that one
4-bis - Trailing stop
Not financial advice but I use a supertrend and I have a software that will trail my stop according to that supertrend level
For LONG positions, we could set the trailing below the supertrend.
For SHORT positions, we could set the trailing above the supertrend.
You'll find the indicator here on tradingview for free under the name Supertrend V1.0 - Buy or Sell Signal
5 - Which assets
It's working with the default values on major/mid/small caps and for ALTS/BTC, ALTS/USD and ALTS/ETH pairing
YES, THIS IS MOST AWESOME THING OF THE ENTIRE UNIVERSE !!!
6 - Best setup
m15 timeframe is my preferred one for this method. Best Risk/Reward/Invalidations ratio among all other timeframes
I strongly recommend to use the Trend Signal with the input value 14 for the invalidations
If you enter on a BUY signal, and get a RED trend signal, exit immediately the position without waiting for any other confirmation/pullback or anything else
If you enter on a SELL signal, and get a BLUE trend signal, exit immediately the position without waiting for any other confirmation/pullback or anything else
For the trailing stop/Supertrend value, it depends of your capital and how big your stop loss should be. I personally use the settings in the Supertrend indicator
7 - Alerts
You can setup alerts for the primary and secondary signals in Tradingview so that you won't have to stare at the charts all day long. You mental healthy is my priority above everything else :)
8 - More to come
I personally use the alerts from this indicator coupled with a system to take the trades given by the tradingview alerts. I'll publish it later on if I feel the indicator collects enough interest from you guys

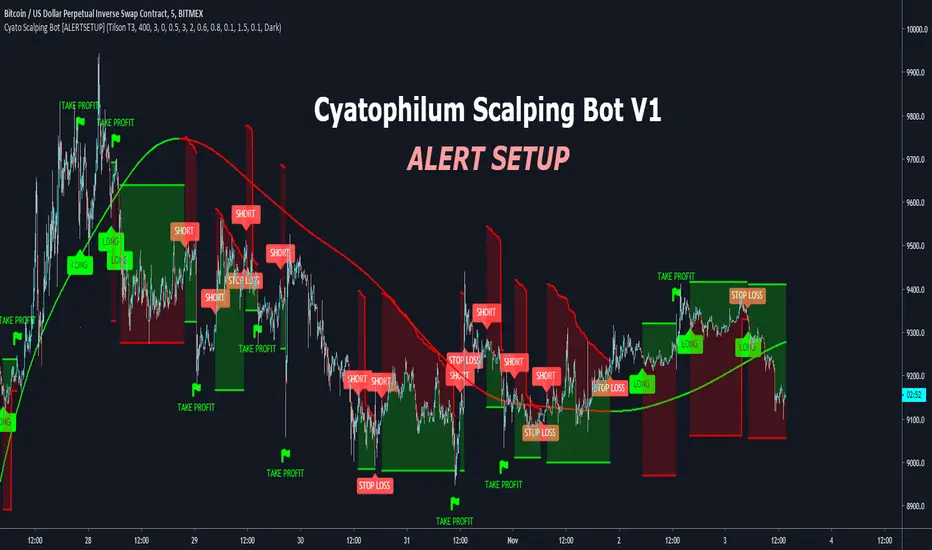
Cyatophilum Scalping Bot [ALERTSETUP]This indicator triggers Short or/and Long entries and exits.
Example with a Long trade:
The integrated stop loss will trigger an alert to exit the trade.
It is possible that a trend reverses during a trade.
In this case, the "LONG EXIT" alert will trigger at the same
time as the "SHORT ENTRY".
The Trend Detector feature, using EMA or Tilson T3 will filter trades that are against the main trend and thus increase profitability.
BONUS FEATURE
Trailing Take Profit with configurable % deviation.
SAMPLE USE CASES
ETH/BTC
ETH/USD
FOREX: GBP/USD
FOREX: XAU/USD
BTC/USDT
LTC/BTC
XRP/BTC
Read More
> Get access to the Cyatophilum Indicators <
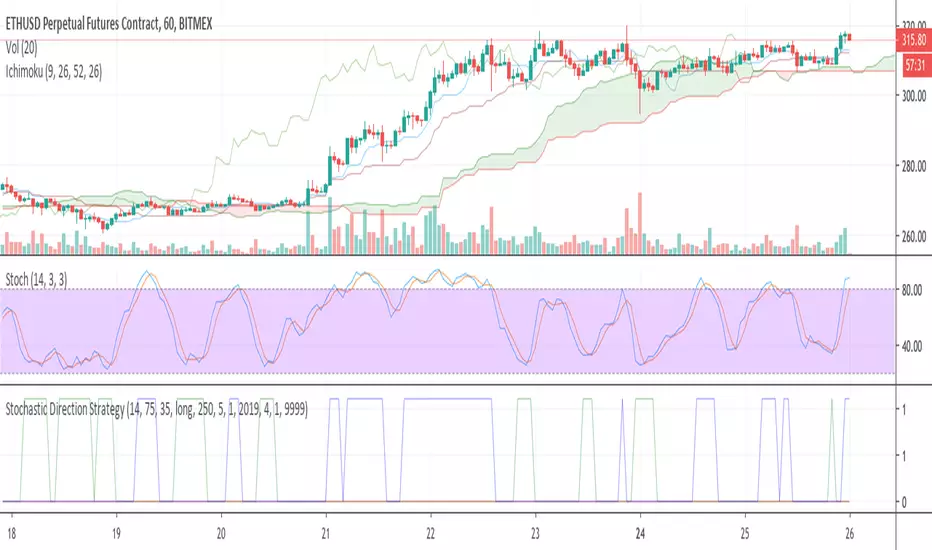
Stochastic Direction StrategyThis is a simple strategy based on the Stochastic Oscillator: stockcharts com/school/doku.php?id=chart_school:technical_indicators:stochastic_oscillator_fast_slow_and_full
Its purpose is to gradually build a position in a trending market (as of June 26th 2016 in most cryptocurrencies).
Inputs:
- direction (long/short)
- overbought/oversold
- close positions (yes/no to only increase positions)
Outputs:
- buy/sell/close signals plotted on a chart below
This script can easily be used as a TradingView study (for alerts) and a strategy (for backtesting). See the comments in the code.
I have added additional alert conditions to be used easily together with a trading bot reading the signals
Yet obviously you can also do manual trading on each alert.
Manic Attack Premium EditionPremium edition of Manic Attack which allows you to long and short also count take profits.
Works for all pairs.

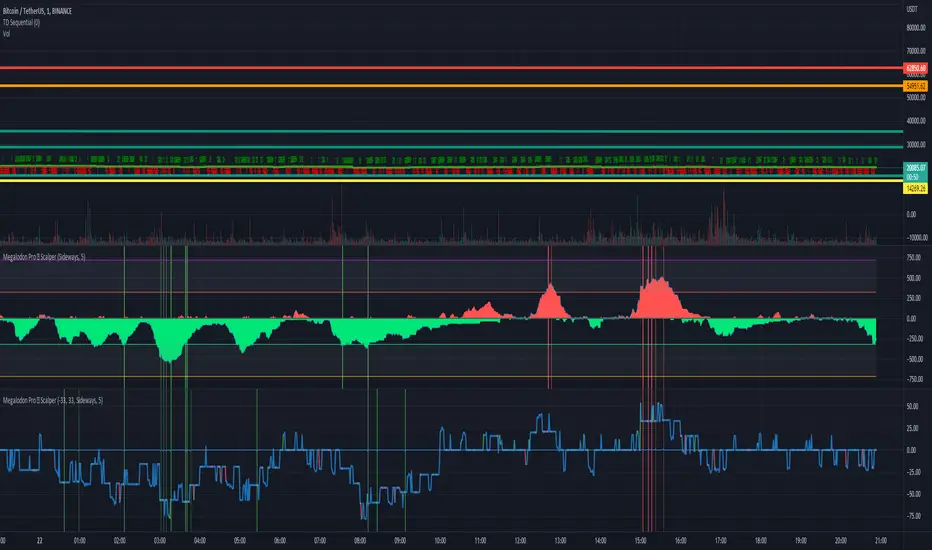
Megalodon Pro Automated Shorter Term TraderHow to use?
Green cloud shows the total buy signals. Red cloud shows the total sell signals.
Yellow line shows the difference between buy and sell signals. If yellow line is above 0, we have more SELL signals than BUY signals. If yellow line is below 0, we have more BUY signals than SELL signals.
You should basically compare the red cloud with the green cloud to enter or exit in a trade.
It should be used on shorter time frames. I recommend using 1 minute or 15 minute for better analysis.
It prints Green for Buy - Orange for Strong Buy- Red for Sell - Purple for Strong Sell signals.
This indicator basically looks for many different indicators' setups and shows you exactly what you need to know.
You may also set alarms for 4 different signals including Buy - Strong Buy - Strong Sell - Sell
Dollar Cost Average [lorencip]This indicator shows the return of a dollar cost average strategy.
The 4 values in the output are:
the amount of the investment
the number of items purchased for that symbol
the total value of the items purchased
the result of the investment in percentage
This first version works with cryptocurrencies and currencies, it's not accurate for stocks (it "purchases" decimals of a share/stock).
Lorenzo Cipriani

Asset Correlation Tool v3, improvedI found this useful tool among the indicators but it wasn't doing the correlation study correctly.
Everything in markets, with only a few exceptions, are rising in value over time and therefore trended to time. The simplest method I found is to use link relative or first difference detrending, before calculating a correlation between assets.
I also updated it to include more assets, to use the latest Cryptocap indices like BTC.D/ETH.D/TOTAL2 and the top 100 crypto index CIX100. I improved the colour schemes, too
Included in the source code are some other ideas like the FRED:M1 and FRED:M2 (only on daily charts), the Yuan/Yen/EUR/USD, etc. There's lots of scope for correlating unrelated markets.
I'll keep updating it as I use it to find truly correlated assets. Some kind of signal line of known correlations, to subtract from the baseline fuzz of market activity.
Any improvements are most welcome; I'm a novice at best at statistics and build on others' work.
- mabonyi

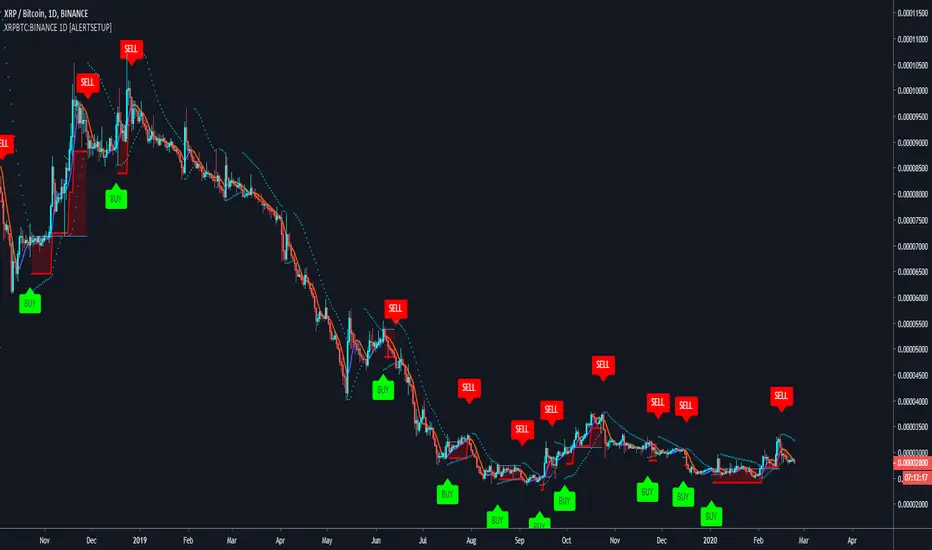
Buy & Sell XRPBTC:BINANCE 1D Trading BotWith this indicator you can create Buy and Sell alerts to automate your trading.
Optimised for BINANCE:XRPBTC in a 1D timeframe.
> > > READ HOW IT WORKS < < <
The goal of trading XRP against BTC is to increase your amount of BTC. XRP is in the top 5 Coins of all time.
Built upon my generic indicator Cyatophilum Altcoins Trader , this Strategy creates buy and sell signals to can be used for manual or automated trading.
This strategy using a combination of Parabolic SAR and Tilson T3 Line , which is a strong tool to buy at the right time . An integrated 10% trailing stop loss will reduce the risk!
Sell and save your founds instead of simply holding over time.
Results below are calculated using 100% equity from a 10 000$ capital and a 0.05% commission fee on each trade.
> > > READ HOW TO USE < < <
> Get access to the Cyatophilum Indicators <
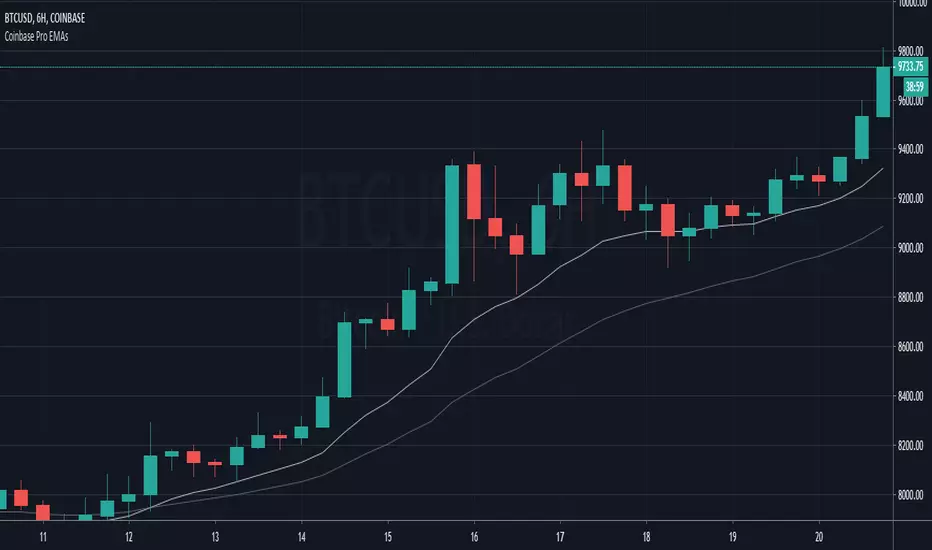
Coinbase Pro EMAsAn indicator to match the only overlays available on Coinbase Pro charts, the EMA12 and EMA26.
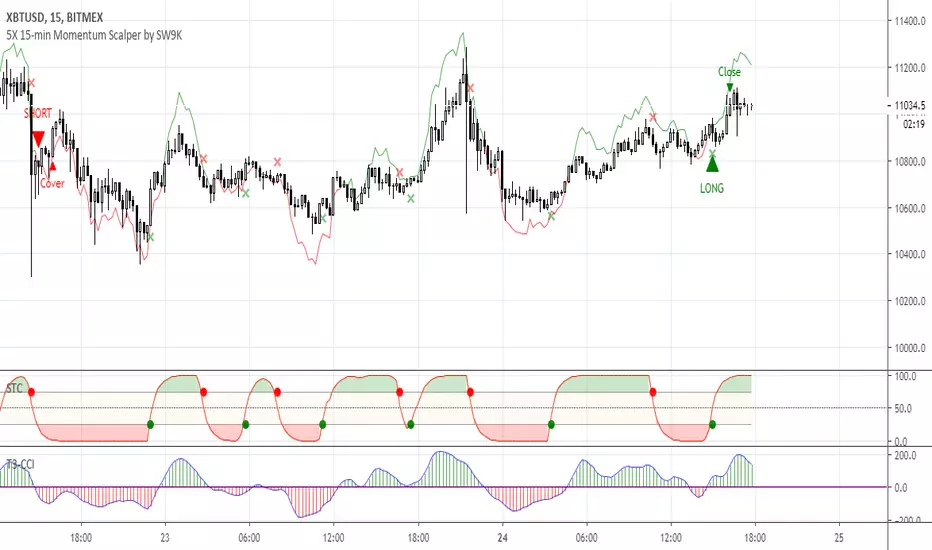
5X 15-min Momentum Scalper by SW9KThis is the alpha release-candidate study script with indicator alerts included. It is currently open for select individuals to test.
The core of this momentum scalper is primarily based on a modified Schaff Trend (which in itself is based on Stochastic elements and MACD) and a modified T3-CCI oscillator, specifically calibrated for 15-minute type movements -- do not apply to any other timeframes. Although it will take small scalps, it is designed to recognize when to ride out underwater positions so use maximum leverage or 5X or you may risk liquidation. Also, there is a stop loss setting feature, but it may reduce profits and win rate.
You can verify the highly accurate 75% win rate performance statistics with 100,000 XBTUSD contracts simulated at .
Features:
40% 3-month net profit, 74.48% win rate, 2.988 profit factor, 3.13% max drawdown, adjusted Sharpe ratio of ~3
Optimized for 15 minute timeframe scalping
Attempts to recognize when to keep position open and ride them out into profitable or breakeven
Profitable even with full Bitmex taker fees (0.075%)
Pyramiding Setting (default 3)
Aggressive Mode to increase entries and potential profits at higher risk
Easy-to-set binary Alerts
Follow SW9K at www.twitter.com