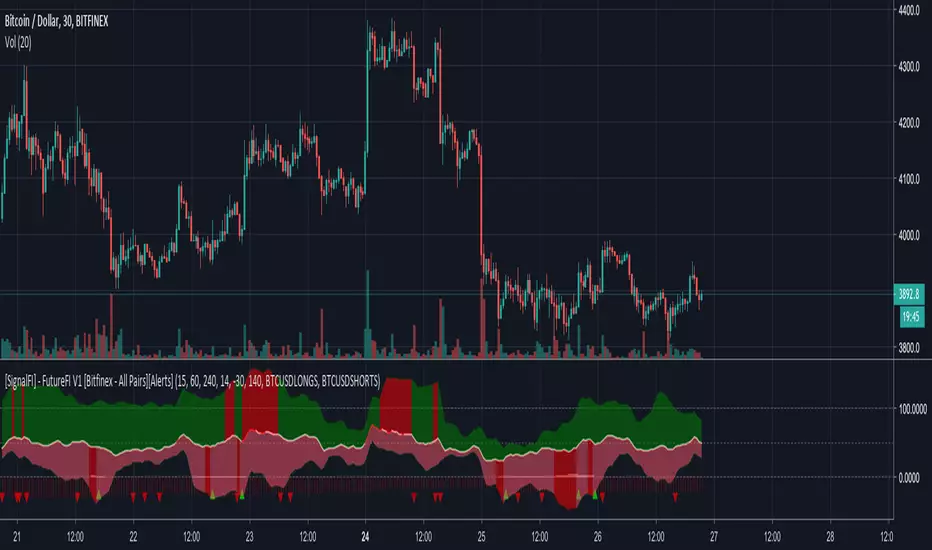
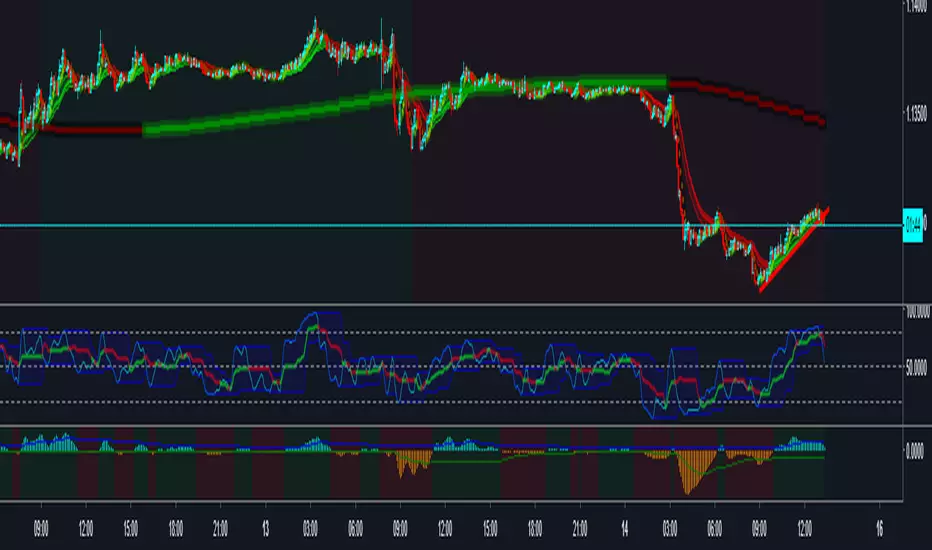
[SignalFI] - FutureFI V1 [Bitfinex - All Pairs][Alerts]FutureFI uses the futures (Long and Short) contracts housed on Bitfinex to provide a gauge for the relative difference and strength of interest in buying or selling Bitfinex assets based on total contracts created.
MUTLTIPLE-TIMEFRAME RSI FOR FUTURES CONTRACTS
DIFFERENCE STATISTICS COMBINED WITH RSI MOMENTUM
SIGNALS CAN BE APPLIED OUTSIDE OF BITFINEX
ALERTS VERSION Only for Jedi and Master Subscribers
Supported Assets:
LongAsset "BTCUSDLONGS","ETHUSDLONGS","XRPUSDLONGS","EOSUSDLONGS","LTCUSDLONGS","BTGUSDLONGS","ETPUSDLONGS","IOTUSDLONGS","ETCUSDLONGS","ZECUSDLONGS","NEOUSDLONGS","XMRUSDLONGS","ZRXUSDLONGS","OMGUSDLONGS","DSHUSDLONGS","BABUSDLONGS","BSVUSDLONGS","SANUSDLONGS","EDOUSDLONGS","TRXUSDLONGS","XLMUSDLONGS","BATUSDLONGS","VETUSDLONGS","SNGUSDLONGS"
ShortAsset "BTCUSDSHORTS","ETHUSDSHORTS","XRPUSDSHORTS","EOSUSDSHORTS","LTCUSDSHORTS","BTGUSDSHORTS","ETPUSDSHORTS","IOTUSDSHORTS","ETCUSDSHORTS","ZECUSDSHORTS","NEOUSDSHORTS","XMRUSDSHORTS","ZRXUSDSHORTS","OMGUSDSHORTS","DSHUSDSHORTS","BABUSDSHORTS","BSVUSDSHORTS","SANUSDSHORTS","EDOUSDSHORTS","TRXUSDSHORTS","XLMUSDSHORTS","BATUSDSHORTS","VETUSDSHORTS","SNGUSDSHORTS"
SignalFI was created to help traders and investors to effectively analyze the market based on the Golden Mean Ratio (Fibonacci numbers), plan a trade and ultimately execute it. To help inform and educate market decisions we developed a set of Trading Indicators which are available on TradingView , the most advanced and yet easy to use charting platform available on the web.
SignalFI indicators are just that, indicators. Our indicators are generally configured to use completely historical data (negating repaint), and we advise all alerts created with SignalFI indicators to be fired upon "close" of the current candle. Our indicators can provide valuable context and visualization support when performing market analysis and executing buy and sell decisions. However. we are not financial experts, and all information presented on this site or our other media outlets are for educational purposes only.
For subscription information, visit www.signalfi.net and follow us on twitter.
加密數字貨幣
[SignalFI] - FutureFI V1 [Bitfinex - All Pairs]FutureFI uses the futures (Long and Short) contracts housed on Bitfinex to provide a gauge for the relative difference and strength of interest in buying or selling Bitfinex assets based on total contracts created.
MUTLTIPLE-TIMEFRAME RSI FOR FUTURES CONTRACTS
DIFFERENCE STATISTICS COMBINED WITH RSI MOMENTUM
SIGNALS CAN BE APPLIED OUTSIDE OF BITFINEX
Supported Assets:
LongAsset "BTCUSDLONGS","ETHUSDLONGS","XRPUSDLONGS","EOSUSDLONGS","LTCUSDLONGS","BTGUSDLONGS","ETPUSDLONGS","IOTUSDLONGS","ETCUSDLONGS","ZECUSDLONGS","NEOUSDLONGS","XMRUSDLONGS","ZRXUSDLONGS","OMGUSDLONGS","DSHUSDLONGS","BABUSDLONGS","BSVUSDLONGS","SANUSDLONGS","EDOUSDLONGS","TRXUSDLONGS","XLMUSDLONGS","BATUSDLONGS","VETUSDLONGS","SNGUSDLONGS"
ShortAsset "BTCUSDSHORTS","ETHUSDSHORTS","XRPUSDSHORTS","EOSUSDSHORTS","LTCUSDSHORTS","BTGUSDSHORTS","ETPUSDSHORTS","IOTUSDSHORTS","ETCUSDSHORTS","ZECUSDSHORTS","NEOUSDSHORTS","XMRUSDSHORTS","ZRXUSDSHORTS","OMGUSDSHORTS","DSHUSDSHORTS","BABUSDSHORTS","BSVUSDSHORTS","SANUSDSHORTS","EDOUSDSHORTS","TRXUSDSHORTS","XLMUSDSHORTS","BATUSDSHORTS","VETUSDSHORTS","SNGUSDSHORTS"
SignalFI was created to help traders and investors to effectively analyze the market based on the Golden Mean Ratio (Fibonacci numbers), plan a trade and ultimately execute it. To help inform and educate market decisions we developed a set of Trading Indicators which are available on TradingView , the most advanced and yet easy to use charting platform available on the web.
SignalFI indicators are just that, indicators. Our indicators are generally configured to use completely historical data (negating repaint), and we advise all alerts created with SignalFI indicators to be fired upon "close" of the current candle. Our indicators can provide valuable context and visualization support when performing market analysis and executing buy and sell decisions. However. we are not financial experts, and all information presented on this site or our other media outlets are for educational purposes only.
For subscription information, visit www.signalfi.net and follow us on twitter: @signalfi_

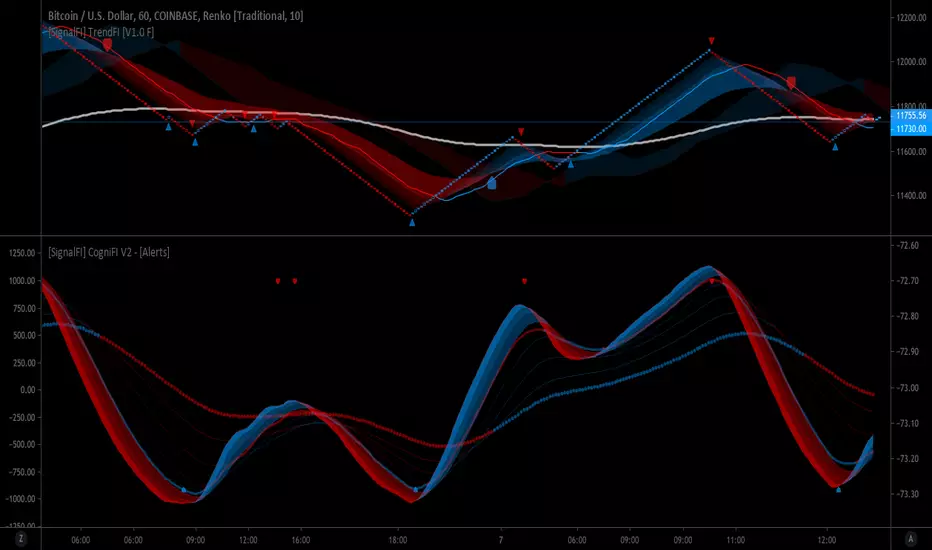
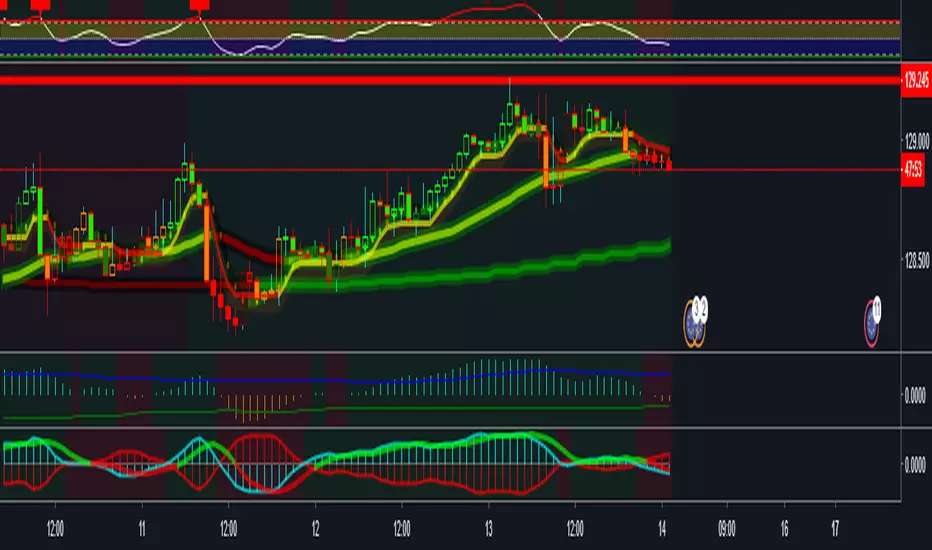
[SignalFI] CogniFI V1 - [Alerts]CogniFI uses 8 independent Fibonacci based inputs to calculate a unified Center Of Gravity (COG) and RMA or RSI based moving average created by J. Welles Wilder.
FIBONACCI BASED TREND AND MOMENTUM DISCOVERY
RSI BASED MOVING AVERAGES COMBINED WITH CENTER OF GRAVITY (COG)
COLOR BASED TREND SMOOTHING FOR INDICATOR SIGNAL
SignalFI was created to help traders and investors to effectively analyze the market based on the Golden Mean Ratio (Fibonacci numbers), plan a trade and ultimately execute it. To help inform and educate market decisions we developed a set of Trading Indicators which are available on TradingView , the most advanced and yet easy to use charting platform available on the web.
SignalFI indicators are just that, indicators. Our indicators are generally configured to use completely historical data (negating repaint), and we advise all alerts created with SignalFI indicators to be fired upon "close" of the current candle. Our indicators can provide valuable context and visualization support when performing market analysis and executing buy and sell decisions. However. we are not financial experts, and all information presented on this site or our other media outlets are for educational purposes only.
For subscription information, visit www.signalfi.net and follow us on twitter: @signalfi_
CRYPTONYY TRADING MACHINEThia script will automatically gives you long and short signals.
WORKS ON ALL EXCHANGE.
SUITABLE FOR BITMEX TRADING.
FOR ALTCOINS TRADING GO FOR 30MIN OR ABOVE 30MIN TIMEFRAME.
AUTOMATIC STOP LOSS TRIGGER.
MORE NEW UPDATES COMING!!!

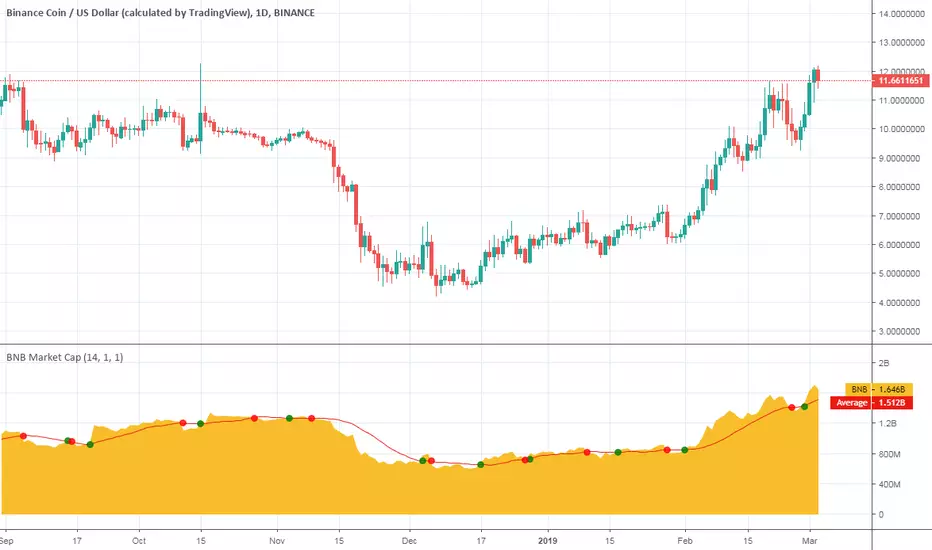
Binance Coin Market CapHey there!
This is Binance Coin market cap with some additional features.
Consider it as my Christmas gift to the community.
What is included
Dynamic market capitalization chart
Customizable SMA of the market capitalization
Crossovers highlighting
You can set alerts for crossovers
Alert for the specified positive % change
Alert for the specified negative % change
NOTE : The word "Dynamic" means that I did not hardcode the supply of the presented coin. You can check it over time.
Good luck and happy trading!
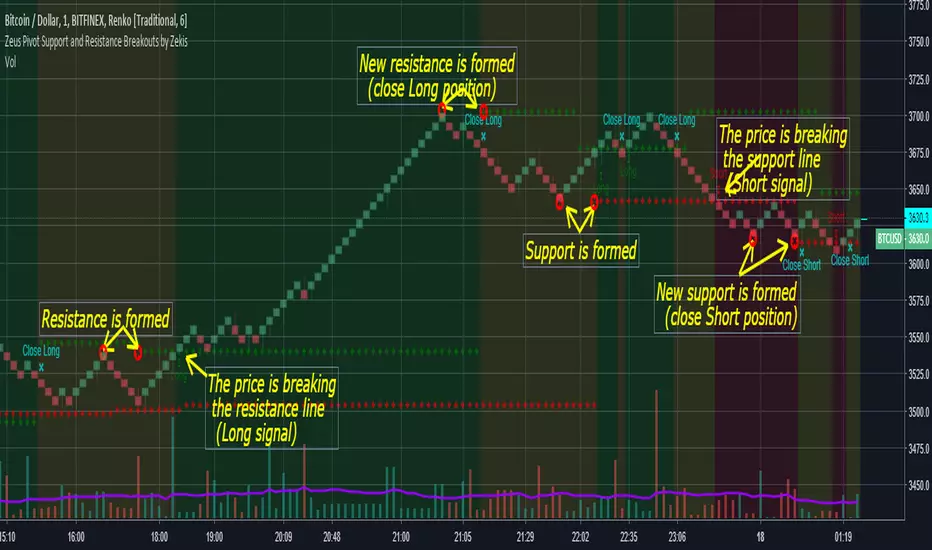
Zeus Pivot Points Support and Resistance Breakouts by ZekisZeus Pivot Support and Resistance Breakouts by Zekis
Is an indicator with big results, it forms new support /resistance according to the last higher high or lower low (it prints new ones only if it breaks through the last one)
Rules:
- enter Long or Short when the support or resistance is craked
- exit when new support or resistance is starts to form
Alerts for entries and exits
A moving average is added to filter signals (leave it at 1 for price close signals)
Bar colors can be added to see longs, shorts or no position
Background colors for longs, shorts or no position
Enjoy!
@Zekis
Total Volume for BTC or ETHBITMEX:ETHUSD BITSTAMP:BTCUSD Script includes cumulative Bitcoin volume from exchanges such as Binance, Bitfinex, Bithumb, Coinbase and more
As default, volume is shown based on the number of Bitcoin moved
If volume increases day over day the color will be blue, if it dereases the color will be red. This is not related to price
You can currently switch between ETH or BTC by putting those abbreviations in on the settings inputs
You can also switch to a USD output
You can remove Bitmex data as this exchange is highly leveraged contracts, default includes Bitmex data
Some delays in loading as the indicator pulls data from multiple exchanges
Future updates may include availability of other coins or additional exchanges added

Sheavy XXX
USE INDICATOR WITH YOUR OWN RISK
ANY OR ALL LOSSES/WINS WILL NOT BE HELD RESPONSIBLE BY THE CREATOR OF THIS SCRIPT.
SHEAVY will give white for LONG entries and DEEP red for SHORT
--------------------------------------------------------------------------------
WHITE SHEAVY signal + DEEP RED candles = MED-HIGH risk LONG entry
WHITE SHEAVY signal + BRIGHT RED candles = MED risk LONG entry
WHITE SHEAVY signal + WHITE candles = LOW risk LONG entry
DEEP RED SHEAVY + DARK GREEN = HIGH risk short
DEEP RED SHEAVY + BRIGHT GREEN = MED RISK SHORT
DEEP RED SHEAVY + DEEP RED = LOW risk short
----------------------------------------------------------------------------------
RSI Candles V5 : RSI period (14)
LIME GREEN = very over bought +85
DARK GREEN = overbought +65
DARK RED = oversold -40
BRIGHT RED = very oversold -15
New parameters in order to enter trade based on PA and volume
cross over technique may be applied after the long / short call using the Gaussin MA
if Long call and gaussin goes over PA you may exit until gaussin is under PA
vice versa


RSI KILLER John Ehlers
Smoothing indicators usually means making a tradeoff between the amount of smoothing you desire and the amount of lag you can stand. It turns out that the RSI can be smoothed and enhanced with minimum lag penalty
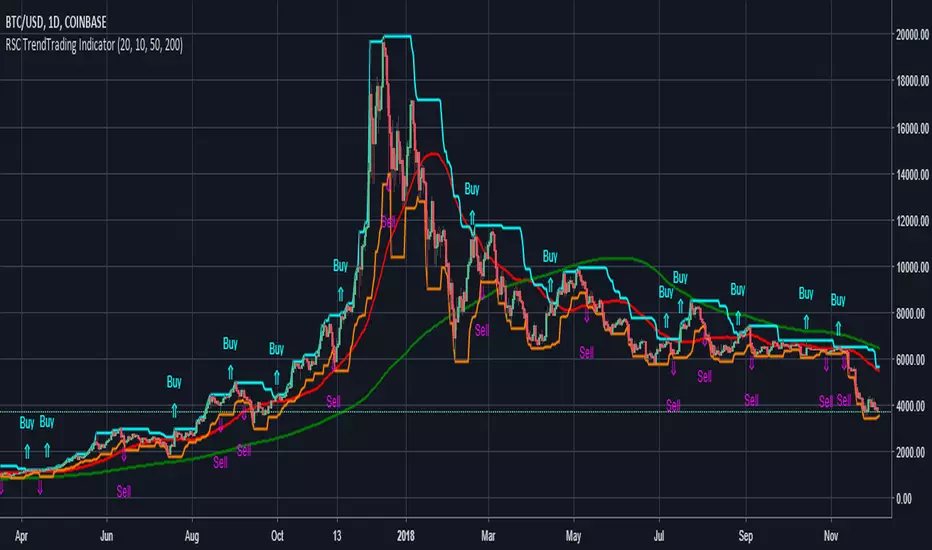
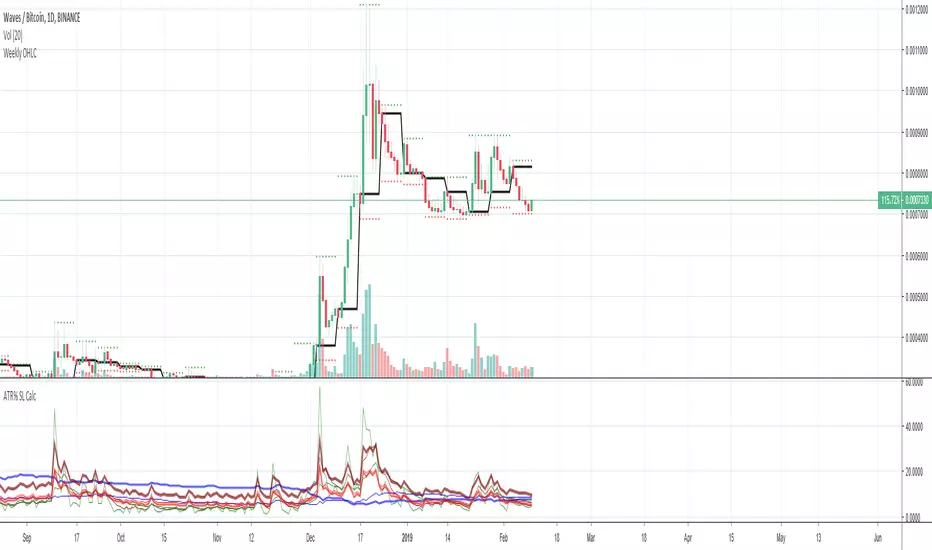
RSC TrendTrading Indicator 1.0RSC TrendTrading Indicator 1.0
This is a combined indicator for those who are familiar with the Short-Term Trading Strategies Class offered at Ready Set Crypto .
This indicator combines 4 indicators as one indicator (assuming you are looking the daily chart):
A Donchian Channel of 20 days (default) or more, used of buy signals
A Donchian Channel of 10 days (default) or more, used of sell signals
A 50 day Simple Moving Average
A 200 day Simple Moving Average
Please like 👍🏻, Share 📣 and Comment 💬 if you like this indicator.
Soon, I will be releasing a strategy based on this to allow backtesting this strategy. It is going to be a very powerful tool. So follow me and message me if you are interested.
This indicator is based on Doc Severson's Trend Trading class at readysetcrypto.com and is published with permission.
I highly recommend that you attend the class to understand how this indicator can be used to your advantage. There is way more than just to the indicators to utilise this trading strategy successfully.
Warning
The Buy and Sell calls are meaningless and must not be auctioned without a thorough understanding of the trading strategy and the full consideration of the entry and exit conditions.
Please use this indicator at your own risk. The publisher does not accept any responsibility for its performance or any implications.
PpSignal Super Smoother Haiken Ashi Trend FolowSuper Smoother Haiken Ashi, based on the smoothed ALMA calculation.

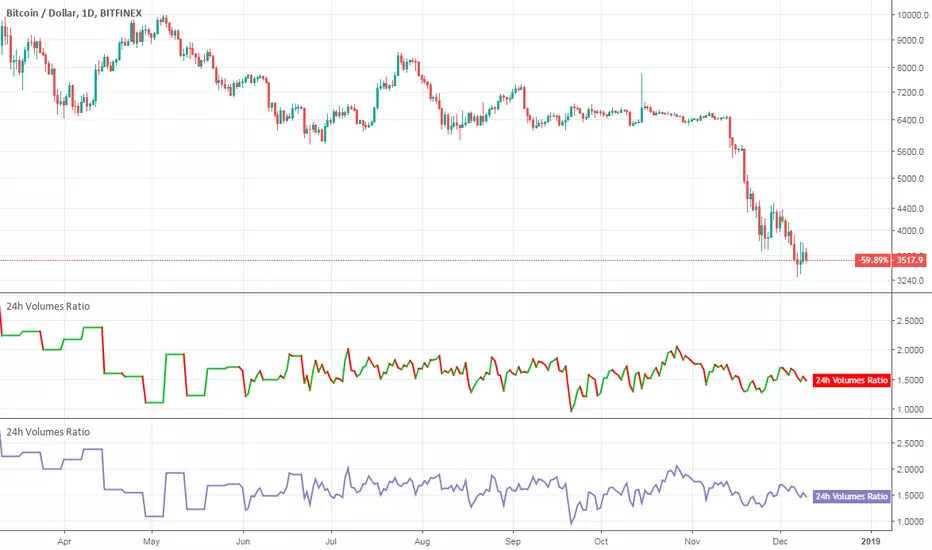
Crypto Mineable vs Not Mineable (24h Volumes Ratio)Hello traders!
This indicator shows you the dynamic ratio between 24h total volumes of the mineable and not mineable cryptocurrencies from TOP-40 according to coinmarketcap.com .
NOTE : The word "dynamic" means that I didn't have to hardcode 24h volumes from coinmarketcap.com for the presented cryptocurrencies - all values are updated automatically.
How to get access
You can buy it for only 30$ to get lifetime access
Happy Trading!
Crypto Mineable vs Not Mineable (24h Volumes)Hello traders!
This indicator shows you the dynamic 24h total volume charts of the mineable and not mineable cryptocurrencies from TOP-40 according to coinmarketcap.com .
NOTE : The word "dynamic" means that I didn't have to hardcode 24h volumes from coinmarketcap.com for the presented cryptocurrencies - all values are updated automatically.
How to get access
You can buy it for only 30$ to get lifetime access
Happy Trading!

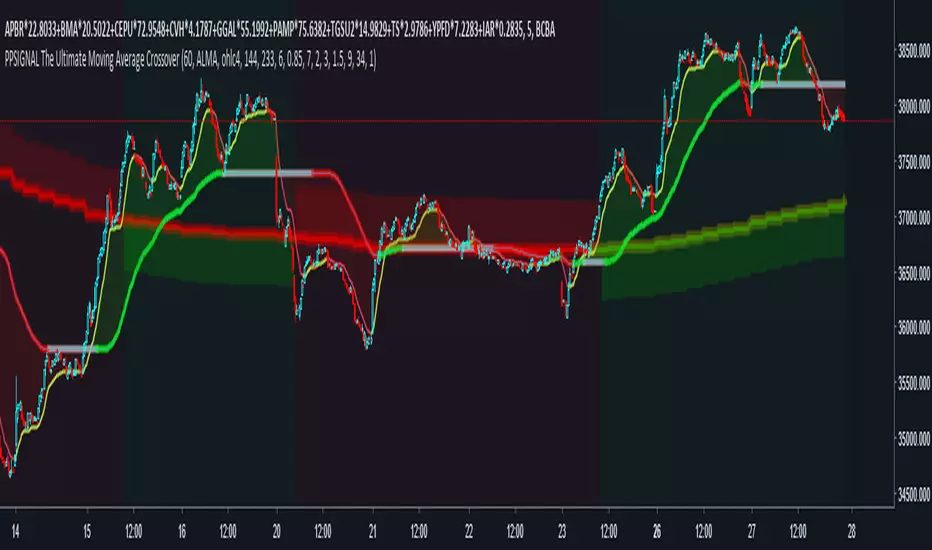
PpSignal The Ultimate Moving Average Crossover 4.0VMA with linear regression smoothe haiken ashi and supertrend bollinguer trend direction

PpSignal The Ultimate Moving Average Crossover 2.0In this version we move out hauken ashi smoothed, bollinguer band and coral. in this version the script have Vidya MA yelloy red color, step ma, lime maroon color, VMA gren. solver and red color and ppsignal hilo trima ma, with different time frame.
If you work in time frame 5 min to 15 min we recommend use hilo trima or alma in 60 min time frame, if you use 30 min to 60 min en 240 min time frame, and d in weekly time frame.

Fixed CandlesMade to chart cryptocurrencies with ridiculous exchange drop candles.
Usage:
1. Hide chart candlesticks
2. Untick 'Scale Price Chart Only'

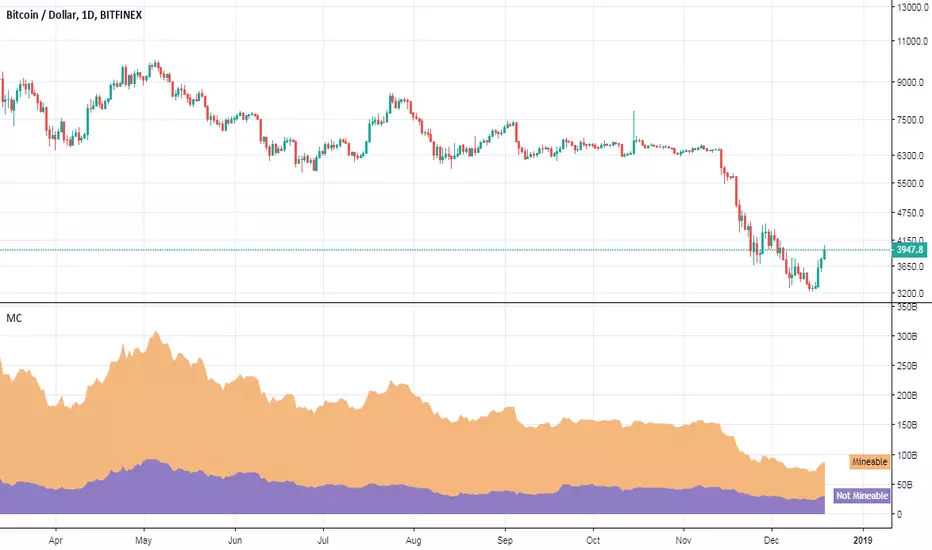
Crypto Mineable vs Not Mineable (Market Caps)Hello traders!
This indicator shows you the dynamic market capitalization charts of the mineable and not mineable cryptocurrencies from TOP-20 (excluding Bitcoin Cash).
NOTE : The word "dynamic" means that I did not hardcode supplies for the presented cryptocurrencies.
How to get access
Buy for only 25$ to get lifetime access to this indicator
Like and follow for more cool indicators!
Happy Trading!
PpSignal The Ultimate Moving Average CrossoverNo matter how many times I explore new concepts, I tend to always incorporate a moving average, or two (if not on price, then on an oscillator). I am going to show the settings I have found to be most beneficial for finding the trend for the ES, forex, crypto etc. First, I have to admit, it is not just a simple crossover. Instead, it is a combination of a MA cross, Multi-Time Frame (MTF), and direction of a normalized moving average.
Average True Range Stop Loss CalculatorThis indicator takes the average of a series of ATR to calculate what I would consider an optimum stop loss placement represented in percentage (read below for full overview).
While the data is plotted what is most helpful are the actual numbers presented.
This indicator is most helpful on the daily timeframe but can be used for all timeframes such as the 4HR or 1HR.
This indicator should not be used alone. It should be used in conjunction with proper price action analysis. It’s also a great indicator if you chart using Value Channels. Ideally you want your stop placement to be below at least one core Value Channel boundary range. In addition to standard support and resistance and some key moving averages the market respects. This also works best when trading with the prevailing BIAS of the instrument (bull or bear).
Cryptos: Generally, that means you’re buying on retracements that fit the end of a structured move. The other option is using this in a clear up trending market where the pull backs are clearly being supported with buying.
FOREX: I use this in my FOREX swing trades for my stop placements. Keep in mind I primarily trade my trade system and use this indicator to ensure my stop placements I define based on VCs are within the ATR tolerance. I’ve found that ATR * 1.5 is the best for my trade system.
WTI: Helpful but I have different rules for when I trade WTI. I rely upon VCs and diagnal VCs much more when trading this.
Equities: Helpful but with the increase of volatility as well as uncertainty of Bias of the market-- this should be used as more of a guide than
Indicator Overview:
Value 1 (maroon): 3 Period ATR
Value 2 (green): 7 Period ATR
Value 3 (blue): 30 Period ATR
Value 4 (blue, bold): 90 Period ATR
Value 5 (green): 1 Period ATR
Value 6 – Prime Stop Loss Placement (red): Average of all above ATR multiplied by 1.5
Value 7 (red): Difference between Value 6 (prime stop loss) and current period move. This is an experimental value. Two ways to use this value. Use as a tighter stop loss placement. The other option is to use as a retrace target for purchase and using the Prime Stop Placement value as you’re stop loss.
All ATRs use the LOW price of the period. After testing both the low and close I’ve settled on the low to capture the most volatility you will typically experience.
Once again, this indicator should be used in conjunction with your proven trade system.
Also, by knowing what the values are within the indicator you could just eye ball what would be the best stop placement depending on the ATR or 1 or 2 ATRs you find most represent the volatility of what you are trading.
I will be expanding on this indicator by bringing in average measured moves as well as volume analysis and most likely with color changes and modifications.
Background:
While using and refining my trade system I've noticed that most moves happen in 3 periods. So we start there. The 7 period is good for a 24 hour market such as crypto (although weekend trading can be a hit or miss) and to some extent FOREX. The longer periods of 30 & 90 are to smooth out the data set. The final value of the 1 period is to bring a little more recency to the calculation.
Why multiply the average by 1.5? I've found in my own trading and system I built to be the best placement (in conjunction with VCs) to ensure you're stop isn't to close and is within the instrument you are trading volatility.
I'm looking at making this more intelligent as well as take into account volume and structured moves.
Crypto Correlation Matrix Series [SHK]Hi everyone, Although everything's clear from the title but I should describe some basic points.
Currency Correlation is a statistical measure of how two securities move in relation to each other.
So this script is used to show if current pair (alt-coins) is moving in the same direction of bitcoin (or ethereum) or not. Consider that in crypto market most of alt-coins have correlation of +0.7 with bitcoin, So temporary changes in correlation may signal a reversal or sharp continuation for the alt-coin.
"1" : The alt coin is moving in same direction of Bitcoin (Or Ethereum).
"0" : The alt coin is moving in random direction compared to Bitcoin. (No movement relation)
"-1" : The alt coin is moving in opposite direction of Bitcoin.
Important Note: By default average of 15 bars back is measured to calculate the correlation by this script. Please test other periods and share the best options with us.
Comments are welcomed :)
