加密數字貨幣


MTF Deviation - Mtrl_ScientistHi everyone,
There are a lot of possible ways to look at markets and find valid patterns.
This time, I've looked at how shorter time frames deviate from the overall price consensus.
What you're seeing here is a range-bound difference of the lowest time frame from the overall price consensus (baseline), represented as blue line.
When lower time frames agree with the baseline, the difference becomes 0.
Logically, this difference cannot deviate too much from the baseline, and to quantify that, I've added fib-levels based on a deviation percentage that depends on price volatility and can be adjusted in the settings.
How it works:
First of all, you need to switch to the 1min time frame to get access to the lowest time frame data.
Look at how the blue line follows the support/resistance fib levels.
Oversold conditions are usually given by entering the lowest red band, whereas overbought conditions are given by entering the upper red band.
However, there are also extreme cases, where the blue line exceeds the set fib levels. In that case, price will reverse with very high likelihood.
Alternatively you can also ping-pong between two fib levels for frequent small trades.
Note that this indicator doesn't use any security functions to access time frame data. Instead, I found a different way to avoid repainting.
At the moment I'm just playing around with this to see how I can improve it. Feedback is very welcome!

[CR] BTCLONG_SHORT MTF RSI DIVComparing BTCLONG and BTCSHORTS RSI on BITFINEX
+MTF
+RSI
+Difference
Simple indicator to show long/short contract association, including relative difference.

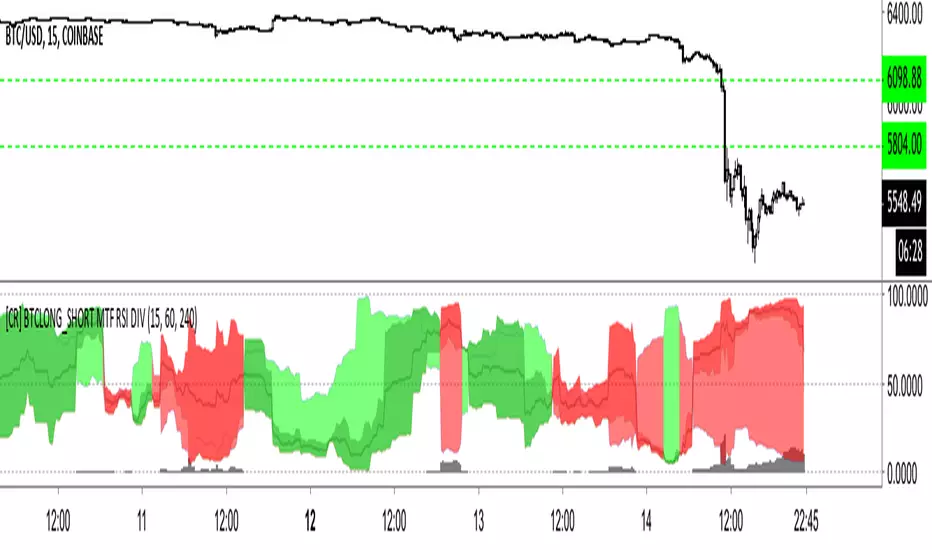
[CR] BTCLONG_SHORT MTF RSI DIV+ MTF x 3 BTCSHORT and BTCLONG on BITFINEX RSI
+ SHORT vs LONG RSI + Difference
This indicator demonstrates the difference between BTCLONG and BTCSHORT values on BITFINEX and compares their relative difference also in RSI.
Red = SHORT > LONG
Lime Over Green = LONG > SHORT difference RSI greater than LONG vs SHORT RSI.
Red Over Darker Red = SHORT > LONG difference RSI greater than SHORT vs LONG RSI.
Black trend line = Total SHORT/LONG RSI
Grey Columns = Total RSI / Difference RSI
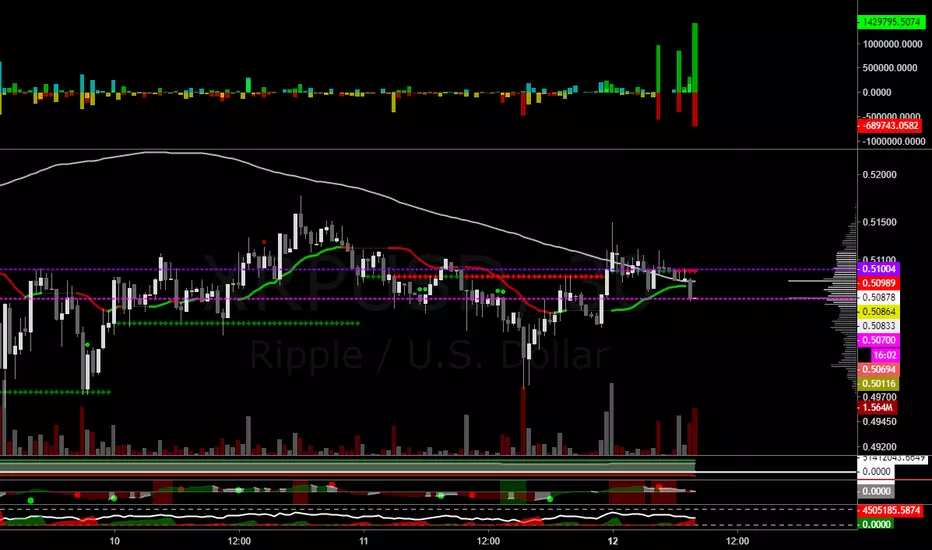
Bitfinex Margin ΔShows long/short position changes per chart period
Works for all Bitfinex margin pairs
Red = Short Open
Yellow = Long Close
Cyan = Short Close
Green = Long Open
CryptoMedics Algorithmic Trading Bands CryptoMedics are happy to announce the release of our new Algorithmic trading bands!
The Bands are used as dynamic moving support and resistance levels and can be used for anything from scalping on low timeframes to swing trading larger moves.
An example of this would be if a coin pumped 20% and you're expecting it to go up more you wait for it to return to either the upper middle or one of the core bands and long it there.
The amount of usecases for this indicator is endless.
Developed using tried and proven methods that everyone from private individuals to wallstreet hedge funds have used. Now available to CryptoMedics subscribers.
The indicator works across any assets since it isn't based on any pair-specific data but rather more broad data that exists on all trading pairs.

Bitfinex Longs/Shorts Ratio AlertableThis script contains Bitfinex longs/short ratio and generates alarms with a given input .default value is 60 which means alerts when either shorts/longs reach 60:40 ratio

Ninja EMA Cross 5/8/13This is a short term EMA cross which is used primarily used for the 1HR chart and below perfect for highly volatile markets . Color coded for clear signals and easy to read crossovers strategy. I recommended for crypto currency trading or high volatility markets.
Green over Red= Buy Signal
Red over Green= Sell Signal
Green over White= Uptrend
Red under White= Downtrend

Bones1390's GANN Strategy AlertsThese are the alerts to go along with my GANN Strategy. You can find the strategy here:
If you like my stuff, leave me a comment below.
If you're feeling kind or want to show some appreciation, you can donate Bitcoin to this Address here:
3Jp9Kow1VxvzAiLLwCdeeQ2g11wKyaT4rC
Also if there's anything you want to talk about PM me! I'm free to speak about anything. Want a custom indicator? I can do my best to code it for you!
Thanks!
Bones

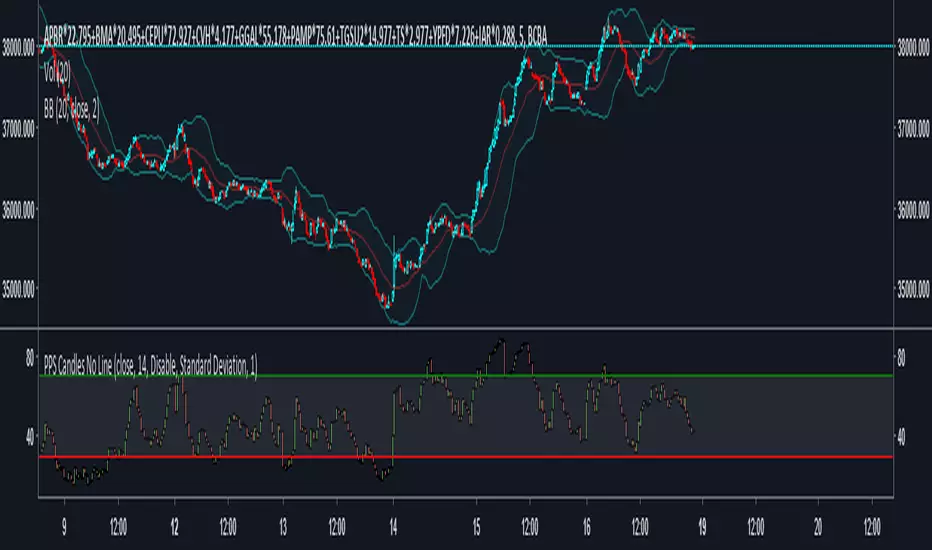
PpSignal ADX Moving Average The ADX indicator uses a smoothing moving average in its calculation and we find out that the best ADX indicator settings to use is 14 periods. ... The ADX indicator can only help us to gauge the intensity of the trend so we need to RSI or Ewo indicator for entry signals.
Gray color is hold, lime buy and orange sell.

Crypto Correlations HeatmapHello friends,
This tool is designed for crypto traders who want a fast, visual way to understand how different coins move relative to each other. It builds a correlation heatmap between your current chart symbol and a customizable list of crypto pairs, helping you immediately see which assets tend to move together, move opposite, or behave independently.
🛠️ How It Works
You provide a comma-separated watchlist of cryptocurrency tickers (for example, a list of USDT or USD-margined pairs). The script then:
Filters this list using your chosen Display Mode - All pairs, or only BTC, ETH, USDT, or USDC-related pairs.
Splits long watchlists into pages of up to 40 tickers , so you can smoothly navigate large universes of coins using the page selector.
For each symbol on the active page, it calculates the Pearson correlation over a user-defined lookback period, based on your selected Correlation Source (close, alternative price averages, or other supported inputs via the custom source module).
The results are rendered as a color-coded heatmap: color and intensity reflect both the strength and direction of correlation with your chart symbol.
You can switch between multiple professional color palettes to fine-tune how positive, negative, and neutral correlations are visually separated on the chart.
🔥 Key Features
Custom watchlist input via a simple text area (paste long lists directly from your exchange or screener)
Pagination support - view up to 40 tickers per page for stable performance
Flexible Display Modes : All pairs, BTC pairs, ETH pairs, USDT pairs, USDC pairs
Adjustable correlation lookback length
Advanced correlation source selector via the custom source module
Multiple color palettes : Blue/Red, Blue/White/Red, Green/Pink, Green/Red, Green/Yellow/Red, Purple/Orange, Spectral, Viridis
Clear visual mapping of correlation strength and sign using color intensity and hue
👋 Good luck and happy trading!


PpSignal Step Moving AverageStep Moving Average
The indicator calculates the moving average and draws price movement in steps. To some extent, it is similar to a Renko chart, because a new horizontal line is drawn after the prices moves a fixed distance in any direction.

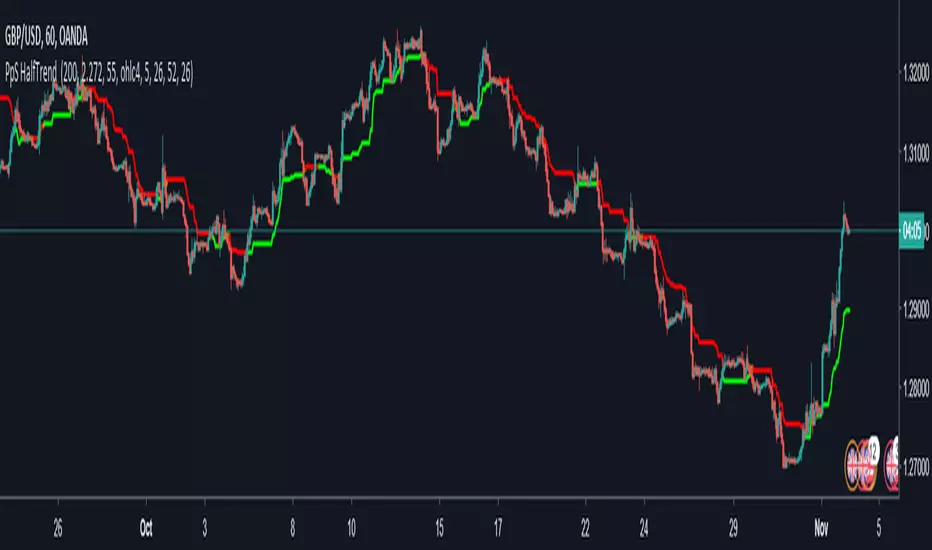
PpSignal HalfTrend 1.18Multi-trend advisor is based on the classic indicators Exponential Moving Average (EMA) with optional parameters and filter to confirm the order opening the indicator Relative Strength Index (RSI) on the signal and selectively EMA. Orders are opened while crossing at a slow fast EMA EMA or vice versa, a confirmation signal filtering.
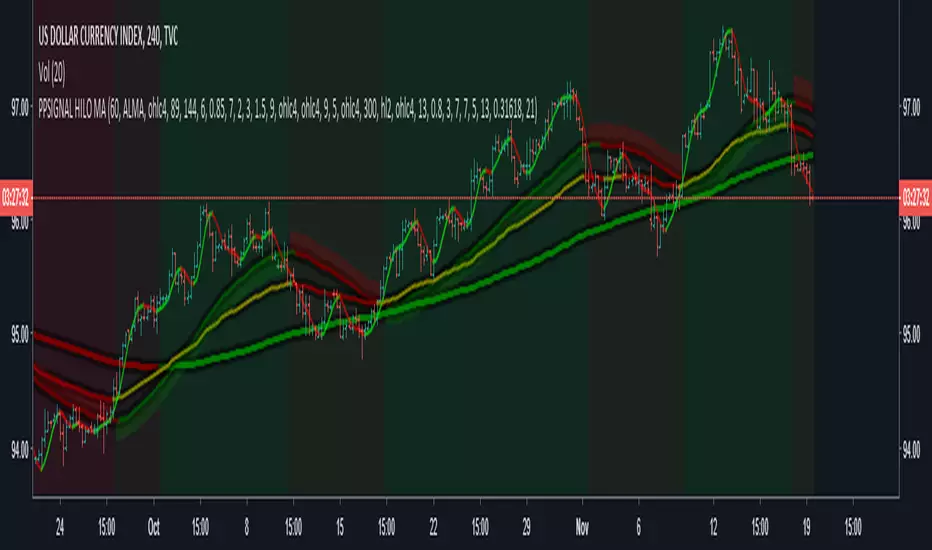
PpSignal HILO MA Trima ATRThis indicator combines Moving Average (MA) and Average True Range (ATR) to visualize potential trade signals

Hades Indicator by ZekisHades Indicator is a good swing indicator based on trends
The base of Hades Indicator is calculated from crossing of two moving averages to establish the trend and another two moving averages for entries and exits or longs and shorts.
The rules are simple: go long when background turns green and exit when turns yellow and go short when backgroun turns red and exit when turns yellow
When background is yellow is not a good idea to jump in
There are 5 moving averages to choose from: DEMA, EMA, SMA, VWMA and WMA
Also you can choose to trade only for Longs, only for Shorts or both
Alerts are added
Enjoy!
@ Zekis

Dionysus Indicator by ZekisDionysus is a good swing indicator with nice results in any timeframe
Easy to use, you need to adjust the lenght for your needs
Percentlines added for Take Profits and Stop Loss for best results (you can change them as you wish)
Yellow line is the transition from long to shot or entries and exits points
Alerts are enabled
Enjoy!
@ Zekis

PpSignal Variable Index Dynamic AverageThe Variable Index Dynamic Average (VIDYA) was developed by Tushar Chande. The calculation of this indicator is analogous to that of the Exponential Moving Average (EMA) with a dynamically adjusted lookback period that depends on relative price volatility. The higher the volatility, the higher the emphasis on price becomes and the faster VIDYA adapts to price changes. Volatility is measured through the Chande Momentum Oscillator (CMO). This indicator can be used as any moving average, to identify and trade trends. Traders often use it in combination with other signals and analysis techniques.

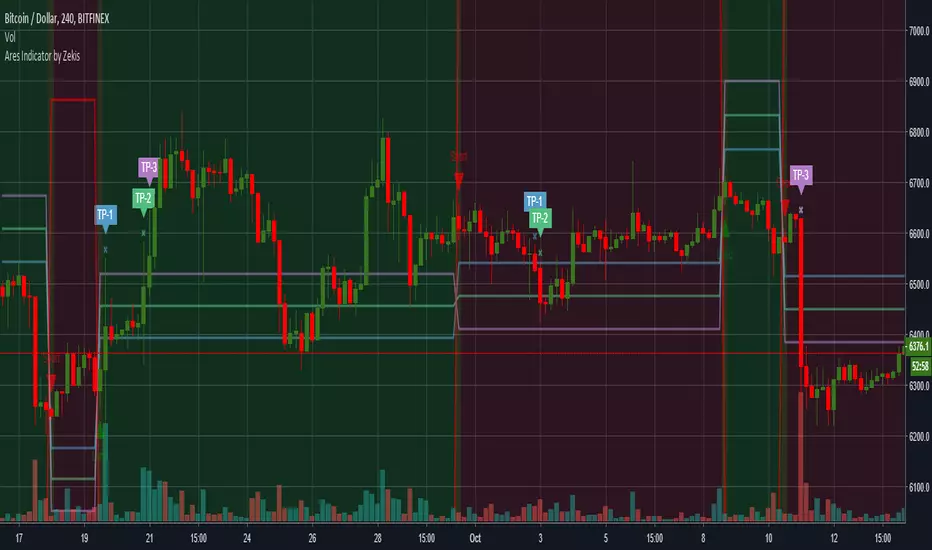
Ares Indicator by ZekisAres Indicator
System Algorithm based on historical price probabilities, with moving averages modified for optimal results.
Buy/Long when background turns green.
Sell/Short when background turns red.
There are 3 Take Profits and a Stop Loss, marked with lines for a better view and with symbols when it get there.
You can set them as you want to meet your requirements.
Alerts are added.
Enjoy!
@ Zekis