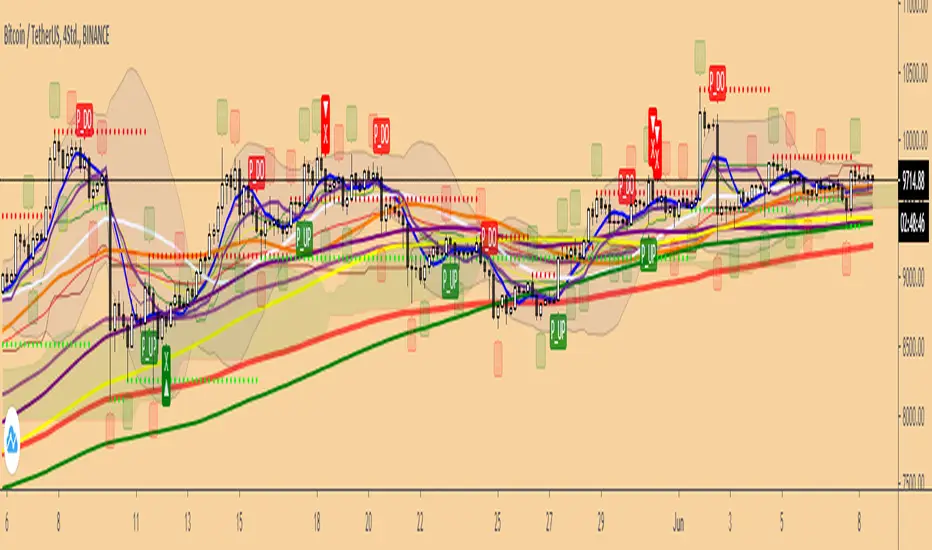
Quantum All in One Crypto Indicator V1Quantum All in One Crypto Indicator V1
Features
6 EMA
6 MA + Slow & Fast
Ichimoku
Bollinger
Fractals
CDC Strategy
Colored Bars
Pivot´s and more..
have fun
Version V1.5 in Progress
加密數字貨幣
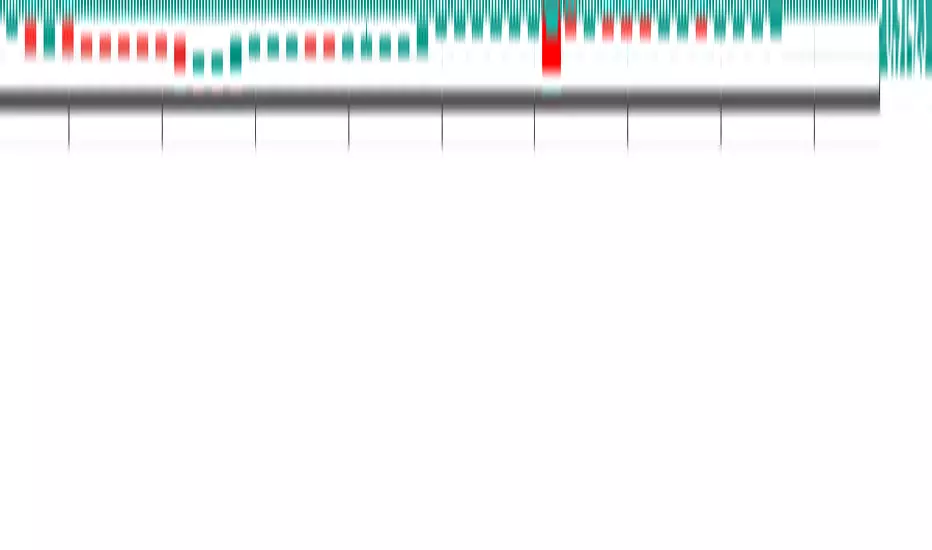
CryptoManic: Long/Short Interest ChangeA simple script to determine the change in Long and short open interest (Bitfinex symbols). i.e. the change in open interest from the previous candle.
Usage: in settings. Go to inputs and in symbol enter your symbol. e.g.
BTCUSD
ETHUSD
ADABTC
BCHBTC
EOSBTC
XRPBTC
TRXBTC
LTCBTC
It plots overlapping area chart of change in open long contracts (in green) and open short contracts (in red)

5e_ CaptainBB w/mo-Alertswith the setups of bollinger and cap bands alongside multiple oscialltor alerts we can see how the mixture of the 3 work on the 2h ethereum chart.
basic rule is if the trend breaches the bollinger and cap band and the oscialltors agree then it is a buy/sell opportunity depending on where the break is made (upper would be sell, lower would be buy).
a cross over of the mid bband (21 ema ) below the mid cap band suggests the trend is negative = short, likewise a cross above the mid cap band suggests the trend is positive = long
watch for rejection around the mid bands area and be prepared to cut long/short early if rejection is seen.
best way to enter the trade is on confirmation and waiting for the price to find support inside the bands, fibonnaci will aid this too.
last tip is to use the daily pivot ; P, R and S to gauge knife catches, targets etc.
be wary on lower time-frames as signals will paint correctly but could be short lived on the chart (and fail without SL or TP).
used with heikin ashi will produce more signals.
using bars will produce the signals shown and color code the trend the best - authors favourite.
candles have same view as bars only colours seem weird.
^^up to you.
FYI bollinger basis is 21ma (not standard 20).
adjust colors to suit and reduce noise. for example dim the vertical bars as they are more for intra-channel scalping
//credit to ChartArt, CapnOscar and Hinco01 for their coding//

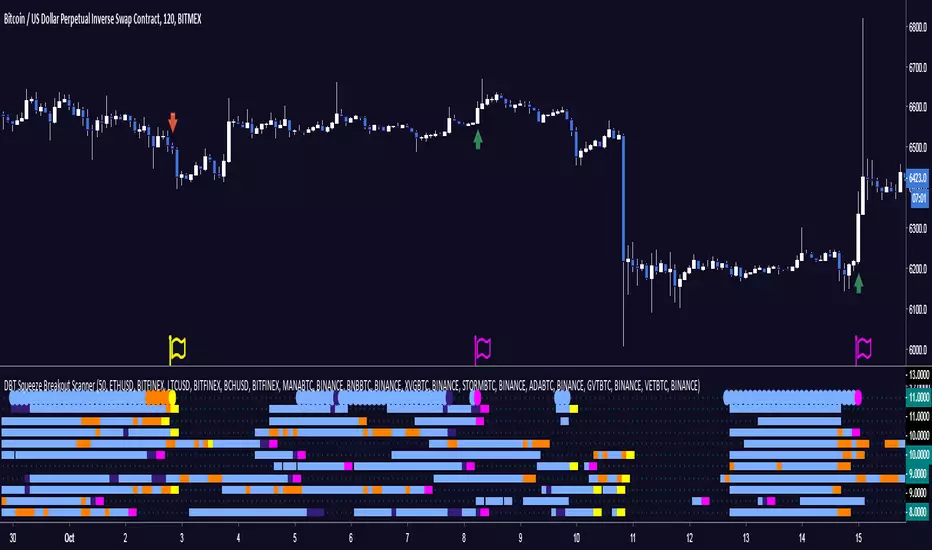
DBT Squeeze Breakout ScannerThe DBT Squeeze Scanner helps you keep an eye on 10 instruments at the same time. It uses a modified version of the DBT Squeeze strategy and scans this strategy against 10 instruments at the same time.
The scanner looks for areas of low volatility signified by a Bollinger Band squeeze and a light blue coloring on the scanner. Once it is squeezing it looks for potential breakout or breakdown opportunities
The scanner has warning signals for both long and short (sell for non margin exchanges) signals, these warning signals are shown as follows:
Light Blue = Bollinger Band Squeeze
Purple = Get ready for a Breakout
Pink = Squeeze has let go and a Breakout is Incoming
Orange = Get ready for a Breakdown
Yellow = Squeeze has let go and a Breakdown is Incoming
All of these signals have their own TradingView alerts. Alerts can be set for anyone of the 10 chosen instruments. Over 10 different kinds of alerts can be setup all at the same time.
This indicator is designed specifically for trending markets, and can be used in many different markets including: Equities, Futures, Commodities, Forex, and Cryptocurrencies. it will give significantly different signals in ranging markets. This indicator is also designed to be 100% preference, PLEASE make sure to choose which 10 instruments you want to watch, the defaults are just some of the major Cryptocurrencies.
Use at your own risk. This is not financial advise and this indicator is not guaranteed to make you profits. Please message me if you have any questions or feedback. Enjoy.
MADE BY GYROMATICAL
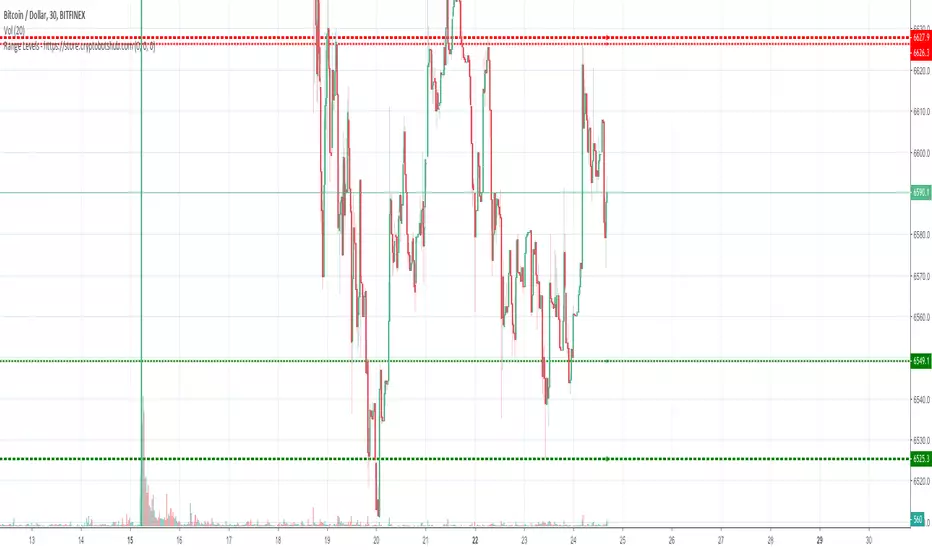
Range Levels - High and Low of Daily, Weekly, and Montly RangesThis is a great free script for the current ranging crypto markets.
You can see the daily, weekly, and monthly high and low of ranges. It also has alerts that you can enable in the settings and then setup in your TradingView alerts for when the price crosses these levels.
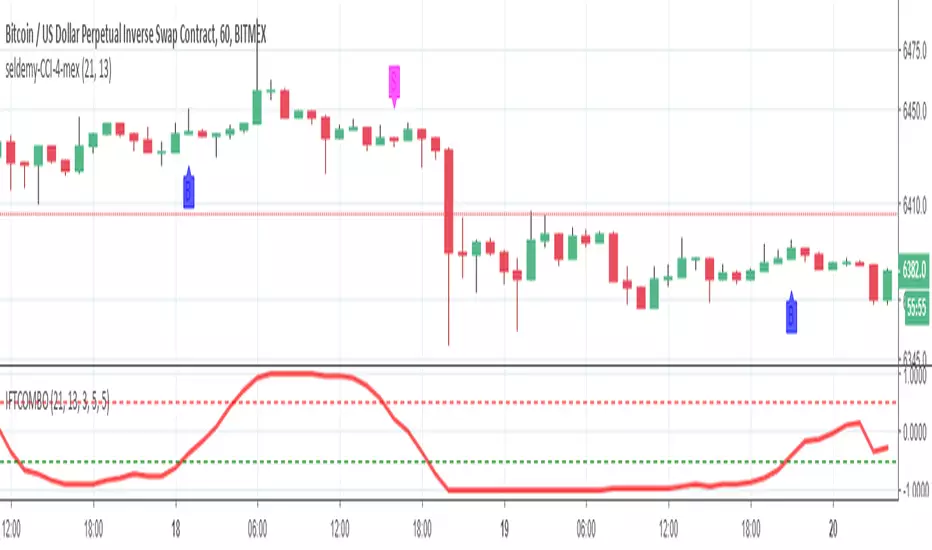
Seldemy-CCI-for-Auto4mexThis is the script I used in BITMEX for auto trading XBTUSD using great Chrome extension called Auto4mex . Default settings are good for 1h candle nowadays (September October 2018 period for Bitcoin). If more volatility comes adjusting needed. Enjoy !

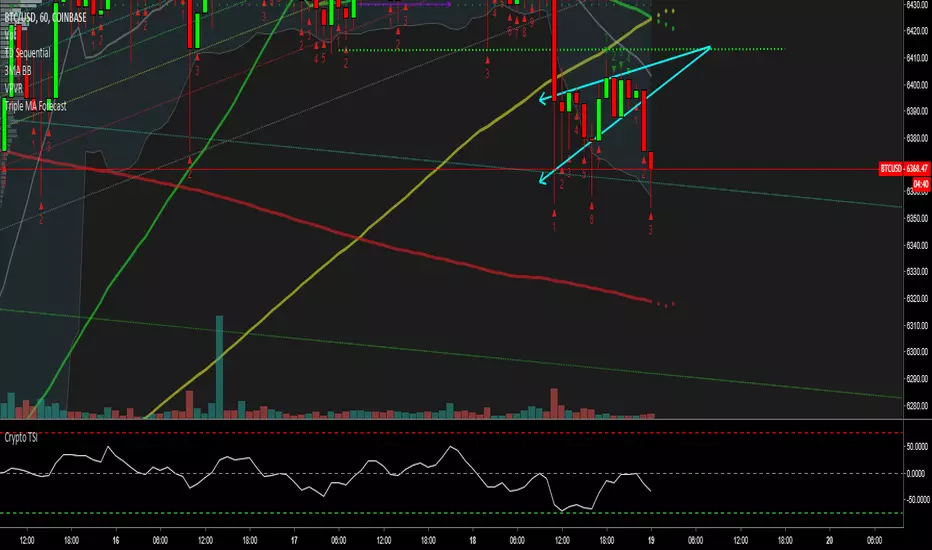
Bollinger Band Oscillator Filtered Long/Short Entries This script calculates entries using Bollinger Bands paired with a series of oscillators. Simply set the Bollinger Band length, as well as the length of the oscillators, and you're good to go. Filtered entries as well as unfiltered entries are plotted by default. Excellent results on longer timeframes (1 hour and higher), although scalping can be done on lower timeframes as well. Filtered entries give safer long/short entries, but plenty of good signals are generated by the unfiltered data as well. Has been tested and found to be effective on several stocks and cryptocurrencies.
Message me to try this script out, thanks!

CLY 4.20 OscillatorWhen the indicator value is above 4.20 the trend is up, below the trend is down. Watch out for ranging markets.

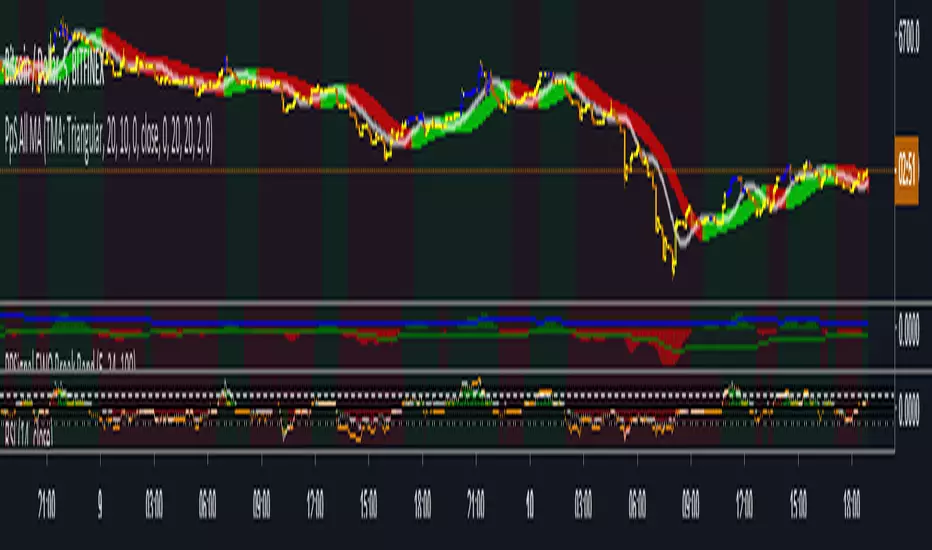
PpSignal ALMA ADXAlma ADX is a ADX and dmi oscillator in histogram format with alma and linreg internal calculation, yo have 3 line, green not trade, withe transition zone and lime trade zone.
Crypto / Fx SessionsTrading sessions for crypto markets - the major time segments: London, NYC, Beijing. Times are set in UTC.
Quick experiment for now, may be edited.
More granular data around session breaks for these time zones at www.altcointrading.net or as CSVs daily updated on Keybase keybase.pub

CLV_crypto_edition
This is a test script for a CLV acc/dist indicator.
It compares the distribution accumulation phase of $X and then weighs it against the current $BTC point

BTC Precognition - Mtrl_Scientist (study version)Hey everyone!
This is the study version of the improved 'BTC - Precognition' algorithm, meaning you'll only see the indicator and not have 'longs/shorts' painted on your chart.
- Works better with normal candles now, as internal calculations are forced to be done on Heikin Ashi, regardless of chosen candle format
- Turned into a study, rather than strategy, as not to interfere with strategies that are already in place
- Added Overbought/Oversold conditions (orange) with adjustable threshold, based on normalized price action helper indicator
Reminder: Only for use with BTCUSD, as it draws data from specific exchanges!
I will also add these changes to the strategy version.
Please let me know what you would like to see improved!

Multiple Trend Indicatorweekly 21wma,daily 21wma and more,within your current chart. and shows multiple trend. if u need something like this

PpSignal ALL MOve Average 1.0Different moving average, Kaufman Adaptive Moving Average, Wilder's Moving Average, Triangular Moving Average , ZLEMA, EMA, SMA , HULL, ALMA, TEMA, ETC. -
BITFINEX:BTCUSD
PpSignal Chandelier Stop, supertrend and BB Band Great combination indicator with atr Technic. buy when the chandelier and BB band is green sell in red signal background... ENJOYYYYYY

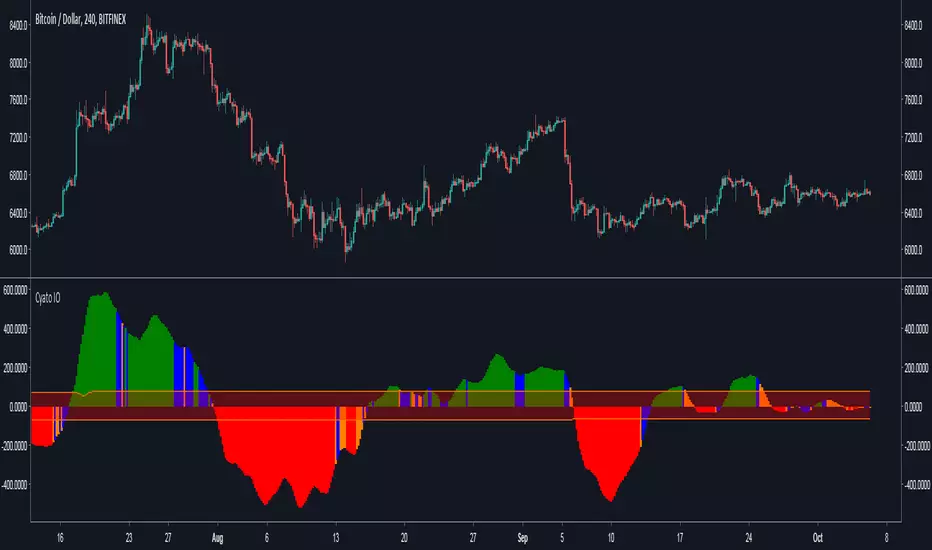
Cyatophilum Ichimoku Oscillator [ALERT SETUP]Hello, I built an oscillator based on Ichimoku trading rules. I wanted something simple to use, but powerful, with automated alerts that would help us trade breakouts and trend reversals.
The indicator can be used on all timeframes and everywhere : Crypto, Forex, Index, Stocks, Futures, CFD.
Basically, green bars equals bull market and red bars equals bear market.
Blue and Orange bars show potential breakouts and you can setup automatic alerts for receiving an email or SMS when it happens.
You can also setup alerts for new highs and new lows indicating a potential trend reversal.
The narrow channel in the middle indicates consolidating periods and unsignificant trades, because we know Ichimoku performs badly in range markets.
For more information on how to use it, I made a description page at the link below.
Sample Use Cases :
BTCUSD 4H
BTCUSD 2H with New Highs/Lows on chart (blue and red circles correspond to alert conditions)
BTCUSD 1H
ETHUSD 2H
Use divergences with price action to trade breakouts.
More information on my website
blockchainfiesta.com
Purchase this indicator today and get access to my other Cyatophilum Indicators that will help you in your trading
blockchainfiesta.com
Happy trading!

MA Adjusted by volatility v1It's similar to WMA but stronger changes compared to ATR will make the candle more significant

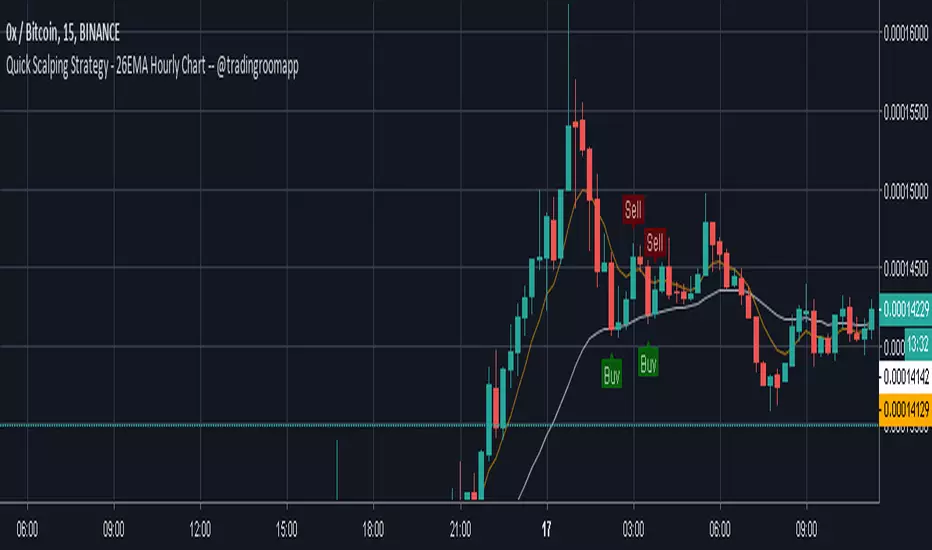
Quick Scalping Strategy - 26EMA Hourly Chart -- @tradingroomappQuick Scalping Strategy around 26EMA and 7EMA published by @TradingRoomApp twitter.com
and brought into TV by myself.
It will give you a quick Buy and Sell opportunity based on crypto price spikes.
If you want access to the tool feel free to send me a DM or contact me through twitter (@CryptoNTez)
Happy Trading!
Cryptotrader ExstremeIndicator which helps with the longterm trading of cryptocurreny, to find entry points.
Its also great for binary with an ideal bank management stragety.