Renko CandlesticksRenko charts are awesome . They reduce noise by only painting a brick on the chart when price moves by a specified amount up/down. When the price reverses, it must go twice the specified amount before a brick is painted. Time is not a factor, just price movement. Sometimes however, you want the pros of a renko chart, but on a regular candlestick chart. This indicator attempts to do just that.
A band is placed around price action showing the upper and lower bounds of what would be the current renko brick. The band only goes up/down when the price action itself moves up/down by the amount you specify. There are several ways of specifying the amount:
Fixed Price Amount: As the name says, you enter the brick size amount, i.e. the amount the price has to move before being in a new brick.
% of Price: This method will calculate the amount the price has to move as a percentage of the price itself. This way as price goes up/down, your brick size will adjust accordingly. Recommended values would be around 1% or less.
% of ATR: This option will make the brick size a percentage of the Average True Range. You can specify the ATR time frame to be different from your current time frame as well as the ATR length. For instance you could be on a 10 minute chart but specify the ATR to be daily with a length of 3 and a percentage amount of 15. This would make your brick size 15% of the Average True Range for the last 3 days. Recommended values are 10 to 20%.
Use this indicator on any time frame, even the 1 minute as the renko bands span the price action the same way on any time frame easily letting you know whether or not the price has moved appreciably, regardless of how much time has passed.
You can also set alerts easily, simply set the alert to crossing and choose “Renko Candlesticks” instead of “Value”. You will then see the options for the renko upper and lower bounds.
Tested on Bitcoin with the following values:
Fixed Price Amount: 30 ($30)
% of Price: 0.45 (if Bitcoin is $7000 then the brick size would be $31.50)
% of ATR: 15%, ATR Time Frame: 1D, ATR Length: 3 (3 days)
加密數字貨幣

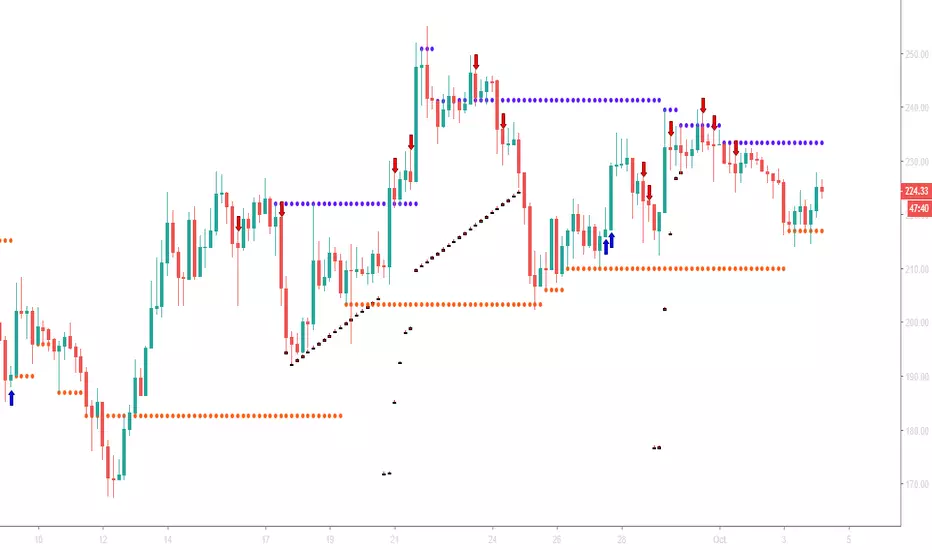
TradeMiner S9This is the first TradingView indicator EVER to include dynamic support and resistance lines from upper or lower diagonal highs and lows in real-time.
Note: This indicator has been built using Pinescript V2
Like and Share for access and more awesome indicators!
A blue arrow appears only in a red bar and under these conditions:
Closing Score Trigger (CS < 50)
On Balance Volume, Accumulation/Distribution, and Chaikin Money Flow Combination (OBV/AD /CMF > 0)
Chaikin Money Flow (CMF <-0.05)
A blue horizontal line will be drawn when CMF > 0.05 indicates a sale of the position.
A red arrow appears only in a green bar and under these conditions:
Closing Score Trigger (CS > 50)
On Balance Volume, Accumulation/Distribution, and Chaikin Money Flow Combination (OBV/AD/CMF < 0)
Chaikin Money Flow (CMF > 0.05)
A red horizontal line will be drawn when CMF <-0.05 indicates a sale of the position.
A new condition called " leaniency " has been added that allows all these conditions to be fulfilled within multiple bars so that the occurrence occurs more frequently. This will result in more signals appearing. Setting leniency to " 1 " means that all four conditions must occur in a single bar, while " 5 " means that all four conditions must occur within 5 bars.
Find lifetime access to the indicator here: www.kenzing.com
BTC
Satoshi RSI
Custom RSI for Satoshi's friends 😎
Over Bought = 80+
High Line = 60+
Low Line = -40
Over Sold = -20
CHOP ZONE = 40-60
added horizontal points for common valley points
EMA and SMA crossover technique
EMA 5
SMA 21
variables can be changed but this is the standard
RSI crossover EMA5 is a signal and the crossover of the SMA21 is the confirmation vice versa.
although waiting for confirmation may draw from wins.
background is shaded white for bull trend and red for bear.
Colors can be changed
future variants will be released. 🚀


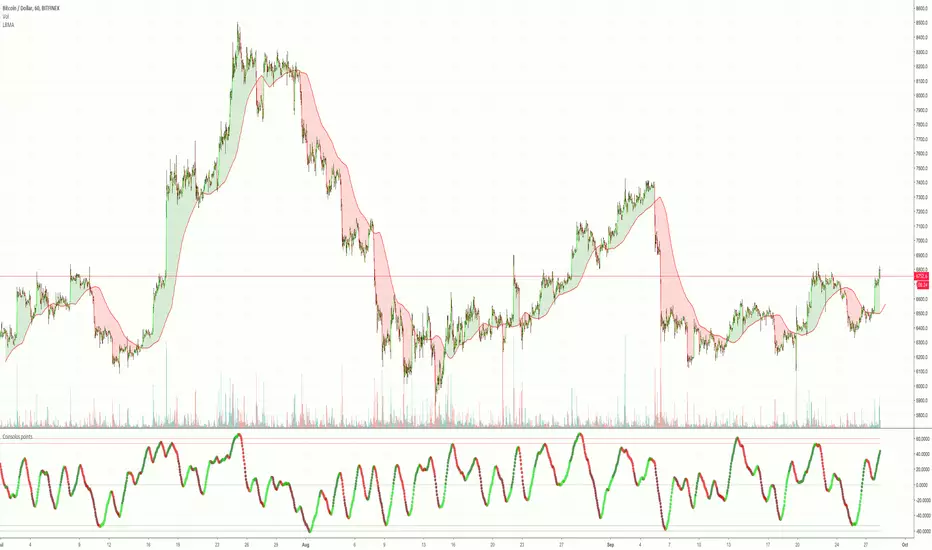
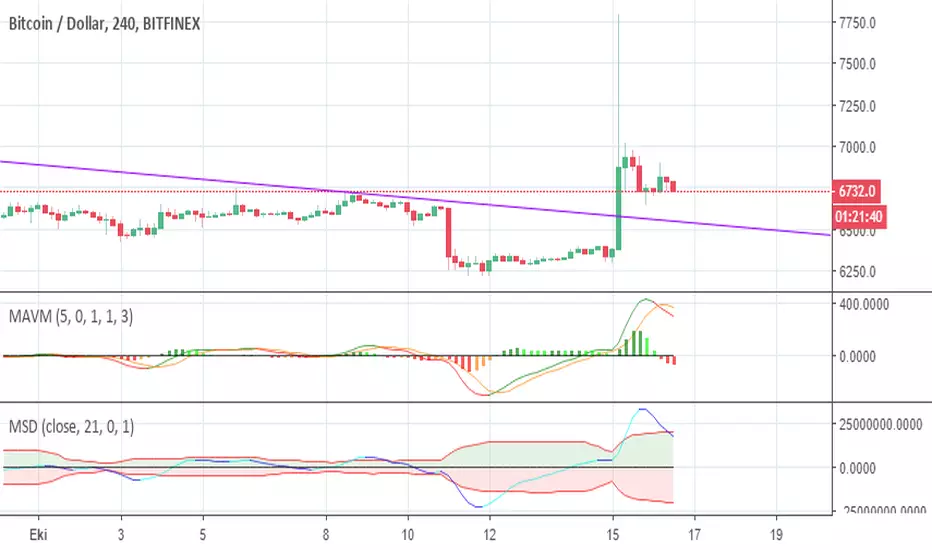
PpSignal Variable Moving AverageVMA is a amazing moving average. you can follow the trend support and resistance . buy when the ma is green and sell when the ma is red. in gray color don t do nothing please.
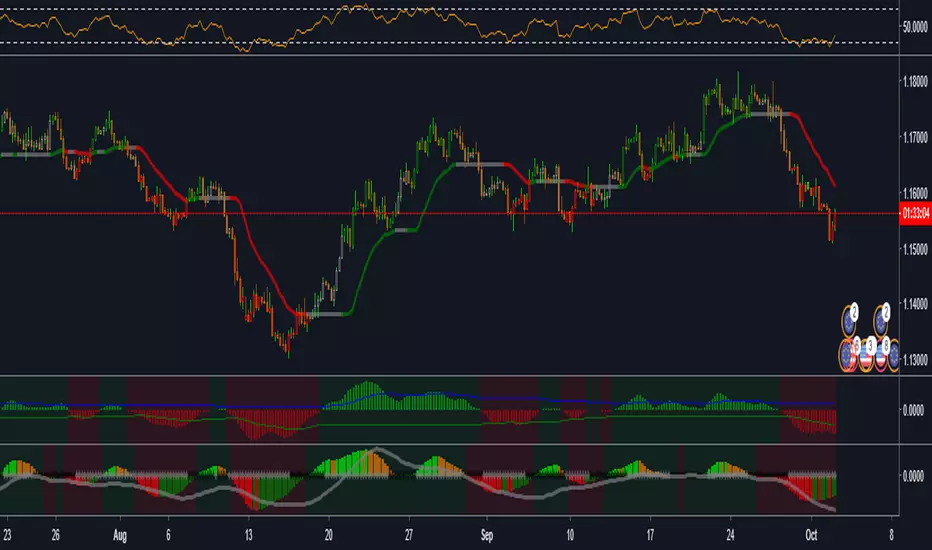
Ppsignal Smoothed Heiken Ashi Candles and Keltner Channelwe have a KC, haiken hashi smoothed and KC trendirection, buy when the background is green and sell when the background is red.

LookBack Moving Avarage by CoinsolosThis indicator is for trend control. If you open a position depends on this indicator never wait for the opposite signal. But you can always use the red line as a stop-loss.
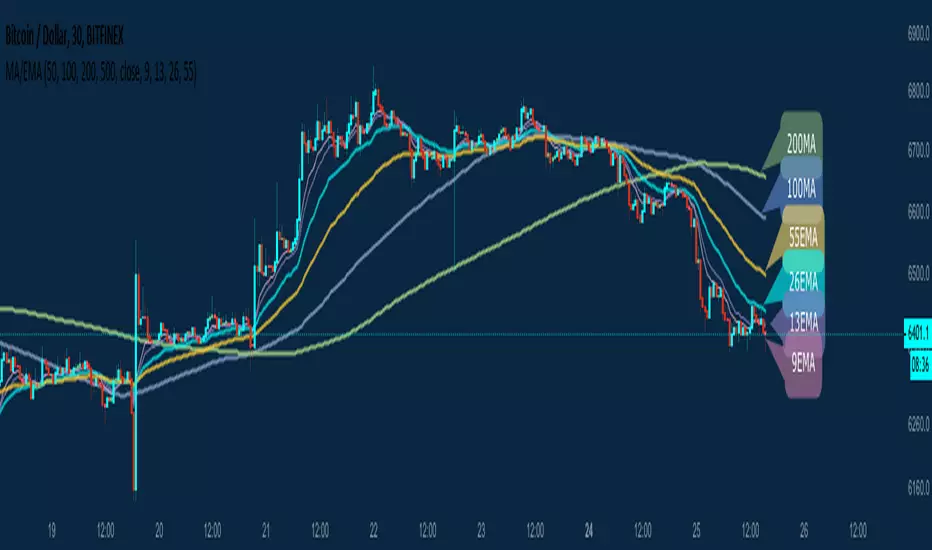
Ruler's Multiple Moving Averages - 8 EMA/MAA handy tool for those who need Multiple Moving Averages in a single indicator!
A great collection of 8 very powerful EMAs and SMAs including:
50MA 9EMA
100MA 13EMA
200MA 26EMA
500MA 55EMA
Of course, completely customizable to your own needs. No need to upgrade your Tradingview account to be able to use multiple MA indicators when you can have all of them in a single Indicator.
All feedback is welcome of course! Enjoy.
-- Ultimate Crypto Trading Strategy -- By @CryptoNTez -- Ultimate EMA Cross Strategy. Easy and profitable strategy optimized for Crypto.
This script will signal Long and Exit signals on different timeframes based on different indicators using HA candles
The script is optimized to catch trend movements as soon as possible and maximize profitability.
Check the Strategy tester results. 92% Profitable on BTC Daily scale...
If you want access send me a PM on Tradingview or a DM in twitter @CryptoNTez.
Best regards and happy trading.

10D vs 20D SMA Cross + PPO DIV -- @TheEyeofCrypto110D vs 20D SMA Cross + PPO Div analysis for Potential buy/sell signals.
idea from @TheEyeofCrypto1 (Check his twitter).

@CryptoGat Strategy 3EMAs CrossStrategy based on this video from @CryptoGat www.youtube.com
Longs and exits are displayed on the chart for better reference


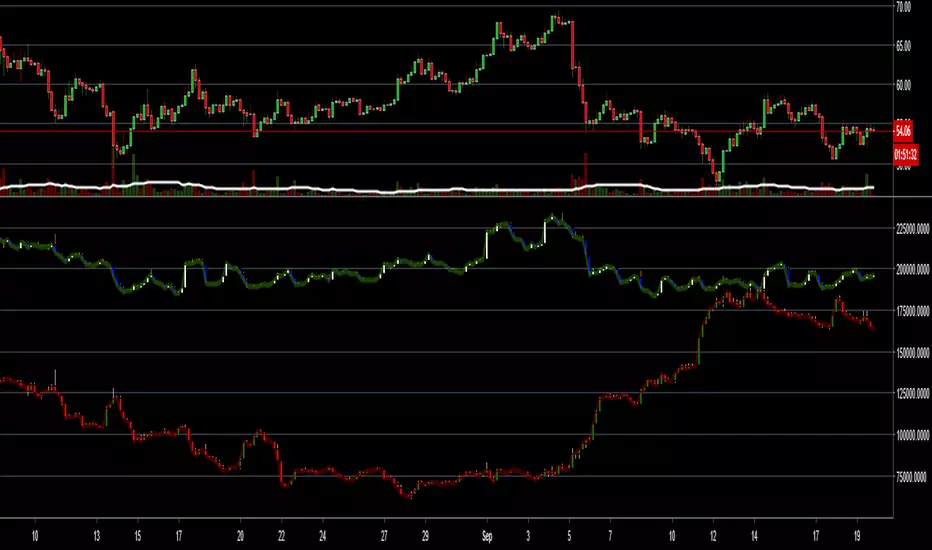
LTC Shorts & Longs (candles) - BitfinexSimilar version of my other scripts - this one is for LTCUSD Shorts and Longs in one indicator including the candles so you can see actual movement as well.
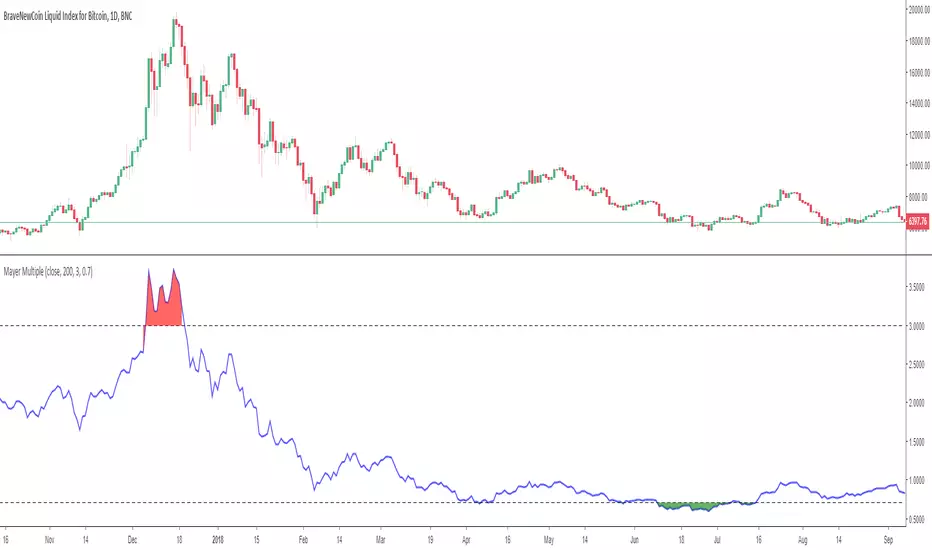
HSS Bitcoin Mayer MultipleIntroducing the Mayer Multiple script…the Mayer Multiple looks over extended periods of time and pinpoints when a cryptocurrency was overbought/sold. The calculation itself is simply the price of the cryptocurrency divided by the 200-day SMA. The default settings are based on Trace Mayer’s recommended numbers but can be adjusted to satisfy your own preferences.
So check it out – I hope you find it useful. As always, this indicator/script should not be taken as trading or financial advice of any kind; it should be used for educational purposes only.
Israr21 [RSI]In Previous Post, I have uploaded Israr21(Reverse Fisher). Now For more accurate results, I am publishing Israr21(RSI), which will be given as bonus with Reverse Fisher after Purchasing. Using both indicators will be helpful for trader to trade as risk-free. For understanding, I have marked signs in Red and Green along text. Before purchasing, you can contact me for Free Trial version of 2 Days. .
If someone Trade short/sell, then Trader should have checked 15Min Chart to close the short. After RSI touched 0.00 Level.

Momentum IndexTo be Used with MACD HISTOGRAM
what to look for ?
normal divergences as well as cross divergences aka HIDDEN
when both stars align then its extra strong
flip the K&D settings for more dramatic results .
message me for access.
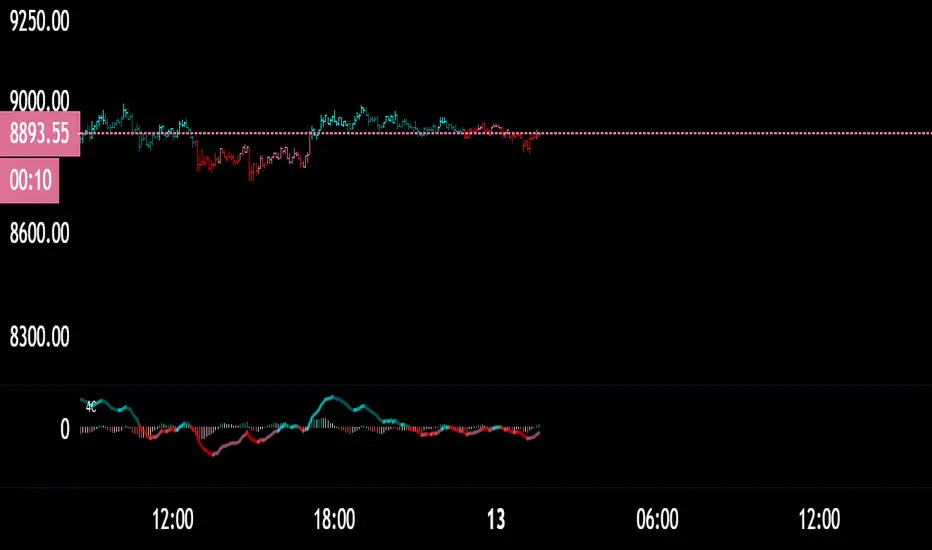
Bull Bear Trend Anlysis Signals by ActualEquationThis indicator analyzes the trend utilizing MACD and other math algorithms to find confirmed entries and exits.
How To Use
Best used on TF larger than 1 hour for highest accuracy.
The higher the wave the stronger the trend.
For entries, wait for the wave to rise then enter after a color flip.
Once flipped, you can look for entries at a smaller time frame to narrow down your buy price.
For shorts, wait for confirmation of color flip with initial red wave down.
BOUNCE PLAYS:
1. Find Divergences via the height of the wave.
2. The more stretched from 0 the stronger the strength.
3. If second drop/rise is less than first, then divergence is present, look for entry.
4. Zoom in to the hourly charts to find initial bounces, then zoom into 5 minutes to look for setups.
NOTE: all signals strength are based off the charts macro strength and most are delayed. If the signal is too high, then it should be the time to close position soon.
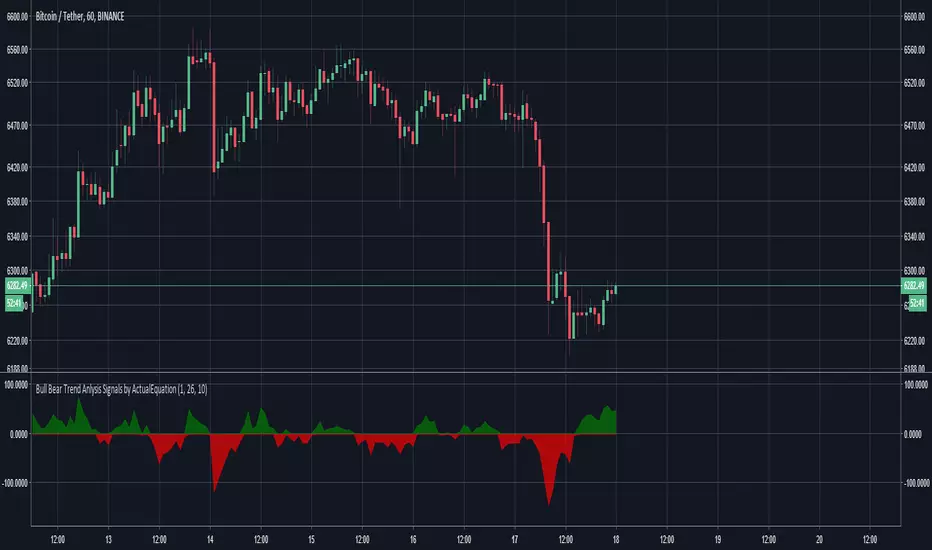
BitcoinNinjas 'Ninja Signals' Buy/Sell Alert Trading Script v3.0Bitcoin Ninjas 'Ninja Signals' Buy/Sell Alerts & Backtesting TradingView Script v3.0
(for Cryptocurrencies, Forex, GunBot, ProfitTrailer, automatic trading software, and more)
This is version 3 of our popular Ninja Signals trading script, which is similar to version 2, but with a new hard-coded calibration (resolution) setting that automatically matches candle size (period) to ensure that no repainting occurs regardless of the number or type of indicators and filters traders apply when configuring the script.
'Ninja Signals' v3.0 (SCRIPT)
'Ninja Signals' v3.0 (STRATEGY)
'Ninja Signals' v2.0 (SCRIPT)
'Ninja Signals' v2.0 (STRATEGY)
'Ninja Signals' v1.0 (SCRIPT)
'Ninja Signals' v1.0 (STRATEGY)
-Allows users to easily set automated buy and sell alerts on TradingView for use with automatic and manual trading of cryptocurrencies, Forex securities, and more (alerts are compatible with automatic trading software such as GunBot, ProfitTrailer, and more).
-Synthesizes many powerful indicators [e.g. Relative Strength Index (RSI), stochastic RSI, Money Flow Index (MFI), Moving Average Convergence Divergence (MACD), etc.) into one super script to generate very precise buy and sell signals in almost any market condition.
-Buy arrows (blue) and sell arrows (red) can be changed or hidden for ease of viewing.
-No lag EMA trendline featuring trend-reversal color-coding (white uptrend, black downtrend).
-Adjustable ‘calibration’ setting allows users to customize the script to work for any currency or security available through TradingView, on any exchange, simply by adjusting a number.
-Complete with backtesting strategy version of script which allows users to test various buy and sell strategies based on the alerts the script generates (see info and screenshots below).
-Backtesting strategy incorporates a user-defined adjustable date range, so users can estimate the script’s performance over specific periods of time, such as the last day, week, or month.
-Backtesting strategy utilizes a minimum protective gain setting to help you never sell for a loss. Simply adjust your minimum profit (%) per trade, and the test results will update.
-Backtesting strategy allows for pyramid buying to test various average down / double up buying strategies. Simply adjust the number of pyramid buys and the quantity of each buy.
- Free 7-day trial available for TradingView users who join our free BitcoinNinjas community.
-Free 24/7 support via BitcoinNinjas Telegram GunBot support group with script purchase.
-Fully compatible with GunBot automatic trading software (TradingView plugin is required).
-Special discount available for traders who purchase GunBot automatic trading software and the GunBot TradingView plugin from BitcoinNinjas, allowing for fully automatic trading.
-Contact us via Email or Telegram for more information, to request additional / custom screenshots, or to start your free trial.
DISCLAIMER: By using our BitcoinNinjas ‘Ninja Signals’ planning script, you agree to the BitcoinNinjas 'Terms of Use', as presented on our website (www.BitcoinNinjas.org) and as stated here. No sharing, copying, reselling, modifying, or any other forms of use are authorized for our documents, script / strategy, and the information published with them. This informational planning script / strategy is strictly for individual use and educational purposes only. This is not financial or investment advice. Investments are always made at your own risk and are based on your personal judgement. Bitcoin Ninjas is not responsible for any losses you may incur. Please invest wisely.

Free Log-Normal Bollinger Bands for CryptoBollinger Bands don't work on crypto currency, this is because crypto is so volatile it makes exponential growth a more obvious factor. Bollinger bands assume price will form a normal distribution around the mean which is WRONG, as prices increase in an exponential way, and the price will never fall below $0.
This is a bollinger band based around a log-normal distribution. Which is how prices actually behave.
Use this one instead. It's free.

Coinopi_matrixstrategy_[babelii]Best Oscillator for trade cryptocurrency
- Very easy to use
- Highest profit
------------------
eth/btc
zrx/btc
Coinopi_ma_stratgy[babelii]Best Oscillator for trade cryptocurrency
- color bar
- Very easy to use
- Highest profit
-------------------
eth/btc
zrx/btc
Coinopi_Trendstrategy_[babelii]Best Oscillator for trade cryptocurrency
- Very easy to use
- Highest profit