加密數字貨幣
ElasticityGreater elasticity the price returns with greater force
-----------------------
Mayor elasticidad el precio retoma con mayor fuerza

ElasticityGreater elasticity the price returns with greater force
-----------------------
Mayor elasticidad el precio retoma con mayor fuerza

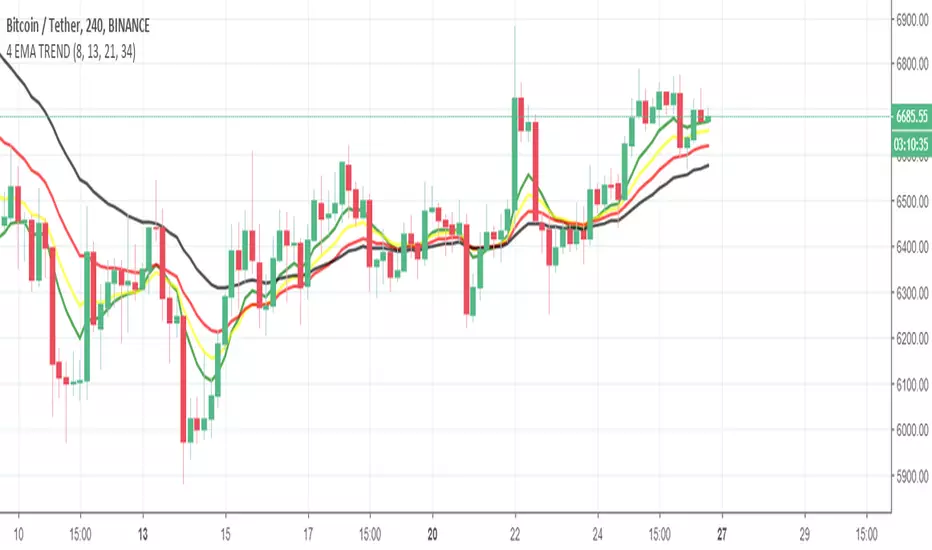
4 EMA TREND INDICATORİf GREEN > YELLOW > RED > BLACK
UPWARD TREND
If BLACK > RED > YELLOW > GREEN
DOWNWARD TREND
In upward trend , if green(fastest ema) crossunder YELLOW or RED or both of them , you can close the position . Dont wait the Downward Trend.
Lengths of EMAs are based on Fibonacci numbers ( 8,13,21,34) , if you want, you can change it based on your strategy.
gentoku MACDThe gentokuMACD is the colored MACD to judge a trend easily.
In the gentokuMACD, both the MACD line and histogram are colored and it is enable to anticipate small movements and determine a convergence of trends.
It also can be used to find a price range by displaying a resistance and support levels, JYA!

Ruler's Trend System V1This is the first version of my Trend Trading indicator. For this I have pulled many different techniques into one:
- We have a powerful EMA based trend cloud along with a smaller MA cloud
- Trend focused candlesticks (at the moment, works best on a Black/White themed chart, bullish white candles, bearish black candles)
- A double ATR trend channel
- Smaller Buy/Sell signals based off of a shorter EMA cloud
I will continue to work on this indicator over the next few days/weeks. For those who want access, just comment below or PM me. All suggestions are welcome!

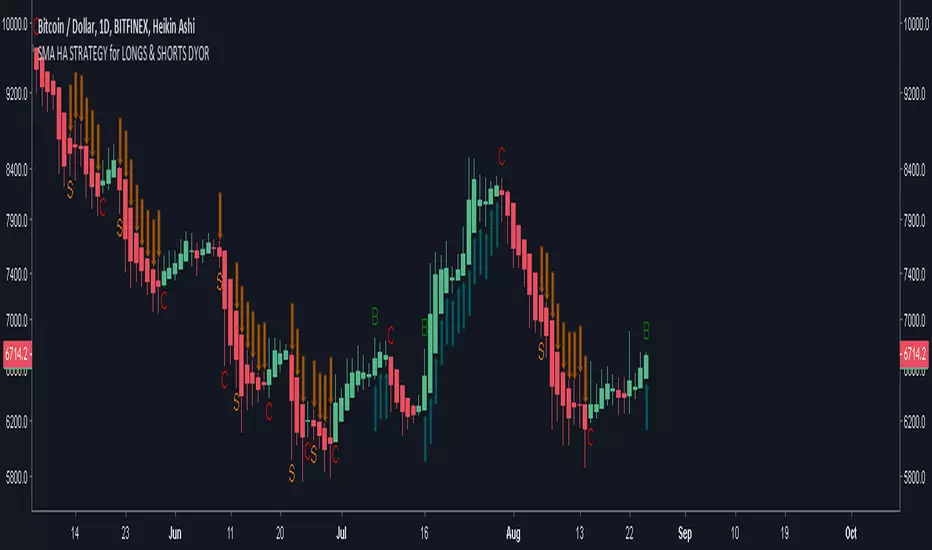
SMA HA STRATEGY for LONGS & SHORTS DYOR (10D v 20D)Script around SMA crossing.
10Dv20D
Usefull for Longs and Shorts signals.
Trunico HTF -- @TrueCrypto28Trunico for HTF
Again the script will let you know when to short or long the market.
The script will be released soon.
regards.

Trunico3 -- @TrueCrypto28New version of Trunico.
Looking really nice for calling Shorts and longs.
We will releasing this scripts soon through @TrueCrypto28 Twitter.
Regards.

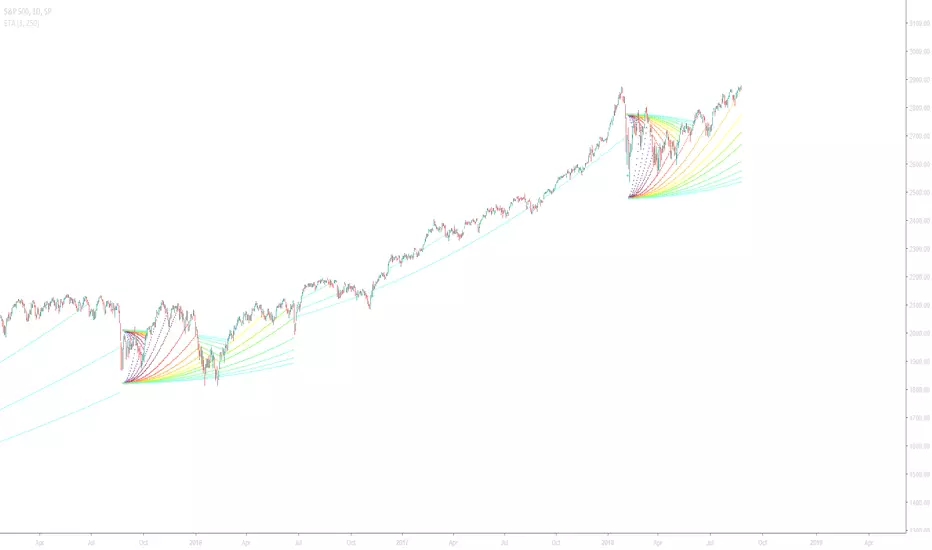
Extreme Trend Amplifier (ETA)Introduction
This indicator was created in V3 Pinescript and all projections will be displayed in real-time for active trading use.
This indicator has been designed so that it can be used across a range of securities such as equities, bonds, FX and cryptocurrencies.
All time-stamps are supported.
Comment and Like to try it out!
Understanding the Extreme Trend Amplifier
Extreme price changes are often result in a change of trend. This indicator not only allows you to identify the breakout, but to follow the direction of the change. Below is an example of the indicator using normal input values and the Dark TradingView Theme.
The Extreme Trend Amplifier is an indicator that measures the rate of change within a bar of the time stamp and plots a function when the user-defined threshold has been breached. The plot projects parabolic lines that squeeze towards the market price at an ever-increasing rate. The acceleration can also be defined in the indicator settings panel.
Indicator Utility
The first example below is the forex pair, AUD/USD using a rate threshold of 1% and an acceleration factor of three and the second using a rate threshold of 0.8% and an acceleration factor of nine.
We can observe that an increased rate threshold results in fewer instances and that a higher acceleration factor results in the instance projecting farther.
Notice that the acceleration factor is inversely related.
Input Values
Select the “ Format ”, button located next to the indicator label to adjust the input values and the style.
Rate of change (ROC) is the percentage rise/fall of the security within the time stamp. If ROC is set to 1, this is directly proportionate to 1%.
Securities such as cryptocurrencies are very volatile and will require an increased threshold.
Forex pairs will require a reduced threshold in order to produce an output as volatility is far less.
The line color, thickness and style can also be personalised to customise the strategy even further.
In this example, I have adjusted the projected instance that appears below the bars blue and above the bars red, indicating an uptrend or downtrend.
It is also possible to change specific bars in order to identify the extent to which a trend has continued as seen below.
If you would to find out more about this indicator, visit www.kenzing.com
Trend Strength Indicator - "Tren"The Tren indicator is a combination of Trend Strength Indicators that I combined in an attempt to better aid position taking. It utilizes certain conditions amongst trend strength indicators and plots numbers 0-12 above (if bullish) or below (if bearish) depending on the conditions. The higher the number, the stronger the Trend Strength is. If one wanted to go long or short, but the trend strength was weak - a trader might want to reconsider their position. If a trader was currently in a position and experienced a retrace, but the trend strength was high and in their favor, a trader might use this indicator to reconsider exiting a trade - therefore maximzing profits.
This indicator is not currently for sale, and is in its beta stages. Follow me for more updates and indicators.


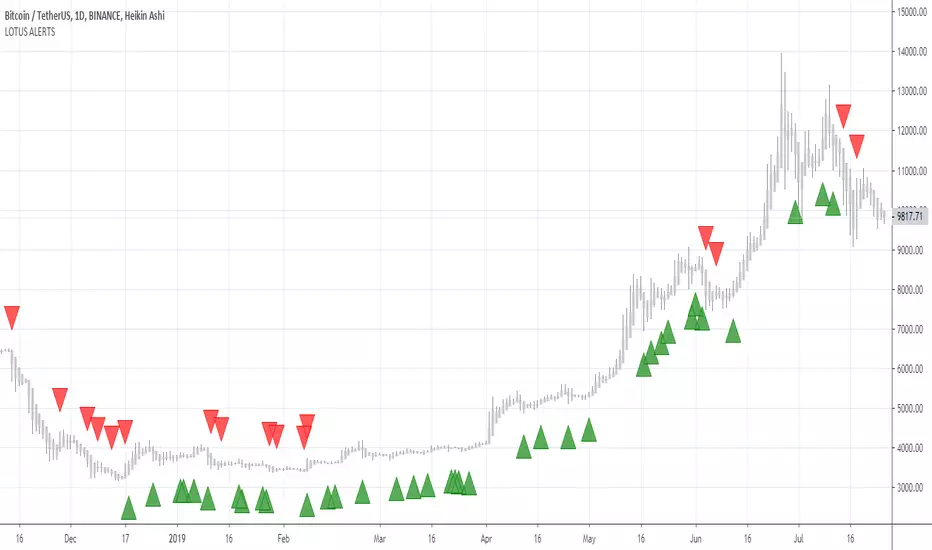
LOTUS ALERTSThis is an Alert script for the LOTUS 2.0 Trading BOT which will allow you to create alerts. This script works with the LOTUS 2.0. When the LOTUS 2.0 paints a buy or sell signal, this alert script will also paint a signal on the chart. It will paint multiple signals and continue to send you alerts as the buy or sell condition is continuously met.
- you can change the colors of the triangle signals


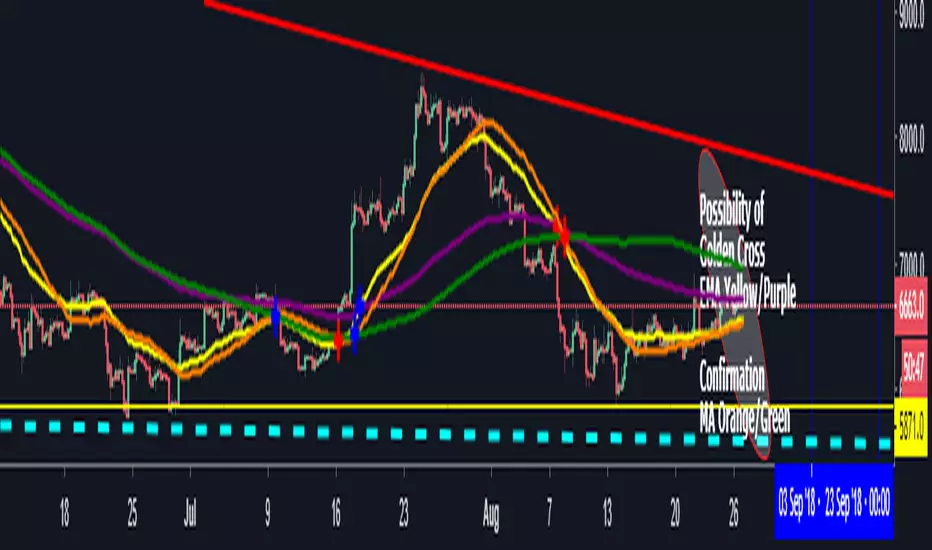
EMA Cross for Long and Short with Stoch/MACD/RSI + IchimokuPrimary and Secondary EMA Cross analysis for Long and Short with Stoch/MACD/RSI Analysis + Ichimoku Cloud
The script will let you choose to show (or not):
*Primary EMA Trend
*Secondary EMA Trend
*Stochastic Alerts
*MACD Alerts
*RSI Alerts
*LONG or SHORT Alerts
It will also let you configure the EMA periods. ichimoku, MACD and RSI seetings
The cost to the tool is 0.005BTC.
For custom scripts send me a PM.

MACD CrossOver/CrossUnder Alert ScriptThe script let you know when to sell or buy around MACD indicator.

Ichimoku for Buy and Sell signalThis indicator coded base on Ichimoku source. Support signal for Buy and Sell signal. Only follow the color of Ichimoku and the signal buy and sell. Only use for Cryptocurrency Market
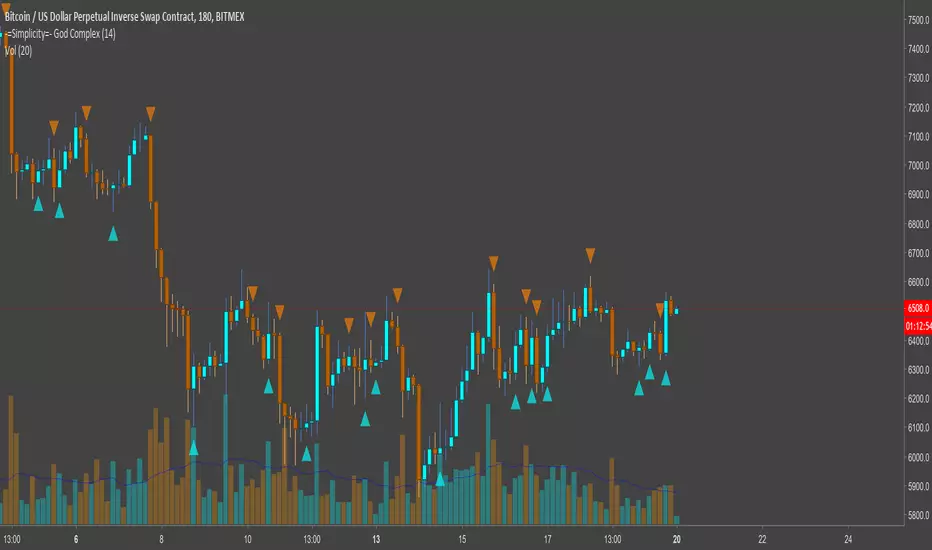
-=Simplicity=- God ComplexMaking money is simple when you wield untold power
-=Simplicity=- God Complex is a non-repaint, set-and-forget indicator for identifying optimum times to enter and exit the market, with both longs and shorts.
Applicable to any asset-type, market, candle type and timeframe, God Complex is a quintessential tool for both new and veteran traders.
With only one variable to change it will take a minimal amount of time to find a value that suits you. As a rule of thumb, the higher the value the less it will fire signals, but the safer those signals will be.
You can also opt to only enable 'Long' or 'Short' signals on the chart. This is meaningful when trading leverage or margin along trend that you are able to identify.
This can be used as a guide for manual trading, but is best utilized as a tool for automating trades so that you don't miss out on any market activity.
This is a link to a document elucidating a little more on the script: docs.google.com
---------------------
Here are a few charts showing how the script performs against them. Enjoy.
Below is a chart depicting XBTUSD (BitMEX) on a 30M timeframe. Both longs and shorts are enabled and the variable is set to a value of 144.
Below here we have a chart for BNBBTC (Binance) on a 1HR timeframe with variable set to a value of 14 on Heikin Ashi candles. Large orange arrows are shorts and smaller blue arrows are closing shorts. There's a clear downtrend, hence we're only shorting.
This is EOSBTC (Bitfinex) on a 2HR timeframe with a variable set to 7 on Renko charts. Small orange arrows are exiting a long position and large blue arrows are entering a long position. The uptrend is obvious to see, so that's why we're mainly displaying longs here.
Not that I reccommend anyone to trade such a small timeframe, but this is for all you scalpers out there. XBTUSD (BitMEX) on a 1M timeframe with a variable value of 233. Both longs and shorts are enabled for this chart. Normal bar candles apply.
Finally, this is ARKBTC (BitTrex) on a 2HR timeframe against a 500R chart with a variable of 377. Only shorts are enabled, as we're in a downtrend.
---------------------
Please contact @overttherainbow on Telegram if you'd like to discuss anything, alternatively reach out to me here (although Telegram is better for a quick response; I'll be around 9AM-11PM GMT)
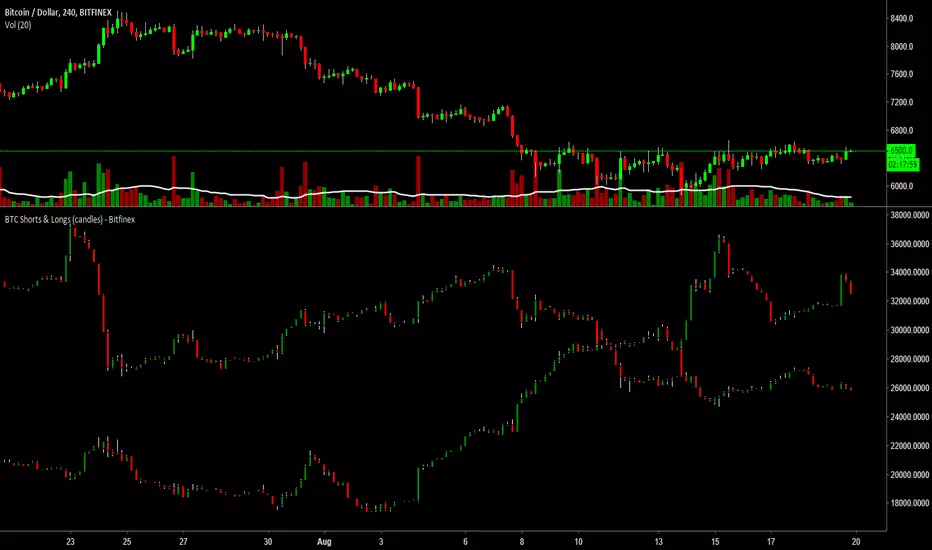
BTC Shorts & Longs (candles) - BitfinexBTCUSDLONGS and BTCUSDSHORTS indicator people like to use but I combined them into one chart/indicator to make them easier to see how the longs or shorts may be building.
Please give it a like if you use or enjoy the indicator.
EMA analysis with Stoch OverSold/Bought indicator + IchimokuThe script will analyze trend around EMAs (configurable periods) and let you know when to short or long the market.
It will also tell you when there is a Overbought / Oversold Cross over Stochastic indicator
The script also includes a Ichimoku cloud so you can add this to your analysis for a trading action.
There will be more indicators coming into this script since im constantly working on Trading view scripts and analysing new strategys.
If you want access to it, contact me. (Its not free but also not expensive)
Best Regards.

Coinpirate Channels BTCFrom a request to simplify the chart, here we have an easy to read map. It's built on calculated price forecast, math, geometry, historical movement, and fundamentals. Enjoy and invest wisely.
NOT INVESTMENT ADVICE. For educational and learning purposes only. BTCUSD -0.30% Bitcoin -0.30% BTC -0.30%

