加密數字貨幣

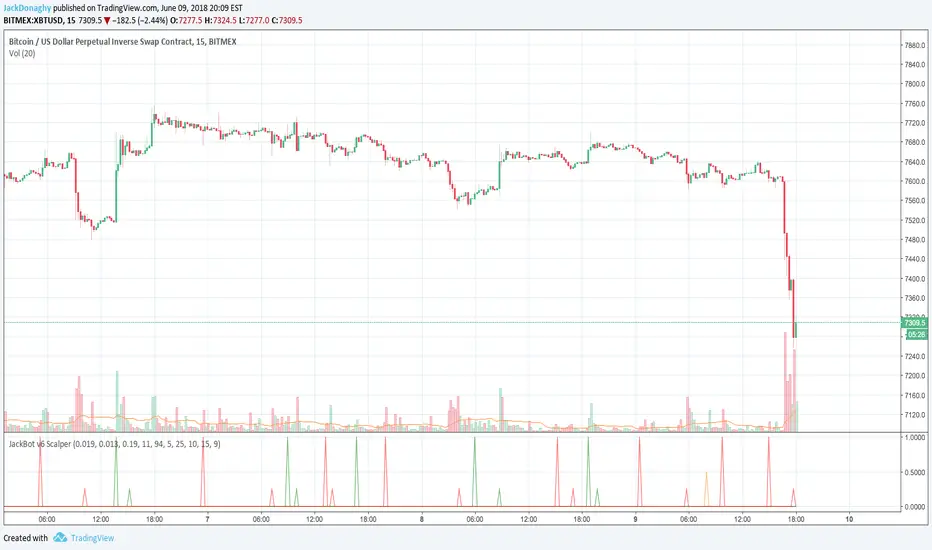
JackBot Scalper v6Jackbot Scalper v6 Update
In Version 6, Jackbot has improved performance on higher time frames with close to 85% success rate on 1-hour times frames and 70% success rate on 15-minute time frames.
Who
I am Jack Donaghy, a crypto trader and wealth strategist at an international asset management firm. I have traded billions in assets for clients and have grown a portfolio of personal assets by nearly 2200% within the last 1.5 years from trading. I originally invested in cryptocurrencies in November of 2016 and have been catching waves ever since. This bot is for those interested in scalping methods.
What
Jackbot Pro Scalper is a scalping study for Bitcoin that operates on small timeframes. It has a 60-70% success rate and operates with the goal of maximizing gains while minimizing losses. This bot works well with leveraged strategies as it pursues both long and short positions. While I primarily use the bot on BitMex, I have seen good success on Bitfinex with various USDT pairs including VEN and ETH.
When
With v6, the best results have come from 13, 15, and 17-minute charts with incredible success found on the 1-hour charts.
How
The bot works by 1. Defining its entry point. 2. Defining a take profit 3. Defining a stop loss. The magic of the bot is that it will not close a trade at the take profit, if volume and price are increasing, it will hold the exit until another indicator determines a reversal of the trend. More than that would ruin the logic so you will just have to see for yourself.
To Trade
Large Spikes = Entries (Green = Long, Red = Short)
Small Spikes = Take Profit (Green = Long Exit, Red = Short Exit)
Medium Spikes = Stop Loss (Purple = Long SL, Yellow = Short SL)
Previous Results
Backtested, Jackbot v6 shows that with 1 Bitcoin (unleveraged) you can make about 12K in a 1.5 month period. My personal experience was trading a test amount of Bitcoin on a particularly good run at 25x leverage using 25% of a test portfolio It went from 0.015 Bitcoin to 0.091 within 10 days. See ibb.co (This test was from V5.4 which V6 has improved upon.)
Disclaimer: This strategy is by no means perfect and not every trade will be a winner. It is a tool in your belt, not a perfect 100% trader. Previously, results show with a 25x leveraged position, the losses are ~20% before it will cut off the trade, however, the gains can be 40%+ (As the bot continues to run in certain conditions, it will often pick up major moves and hold them for longer.) It can have bad runs and a slew of poor entries, especially in tight volatile ranges.
PLEASE NOTE: This strategy can struggle with chop following major moves, if you are manually entering, consider other market conditions before entry if the price is in a tight range.
Cost
Jackbot will be offered for 0.1 Bitcoin and will be limited to the first 100 people who apply.
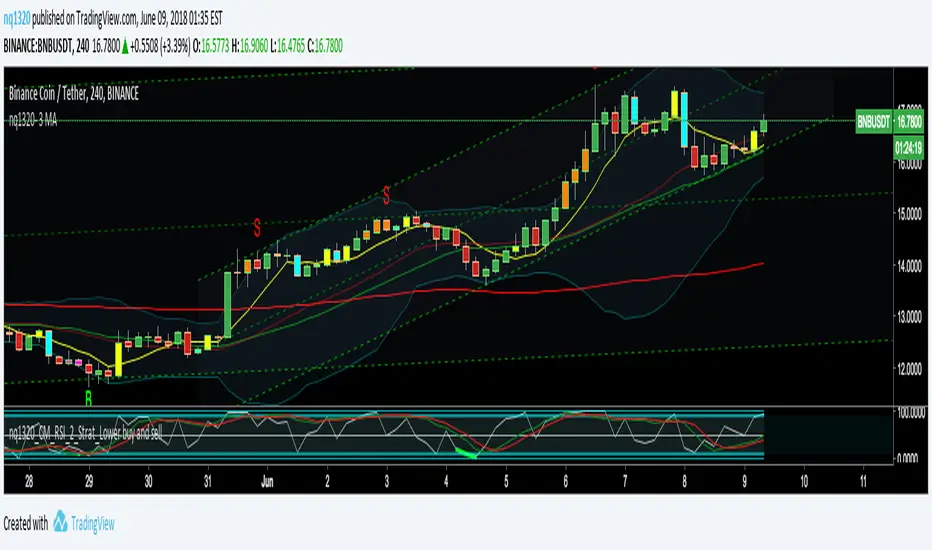
nq1320 3 Moving AverageScript with
- 3 Moving Average ( 7,25,99)
- 1 Bollinger Bands
- Stoch RSI HighlightBars

Taint's OscillatorThis oscillator is great for both scalping and larger time frame trading. It is based on a larger strategy I use. This oscillator takes into account volume and also eliminates lag.
Buy Rules:
-Green dot on the signal line is the weaker buy signal, and it can give false signals.
-Signal line crosses above zero is a strong buy signal.
-Best practice is to wait for the signal to cross above zero after seeing the green dot appear
Sell Rules:
-Red dot on the signal line is the weaker sell signal, and it can give false signals.
-Signal line crosses below zero is a strong sell signal.
-Best practice is to wait for the signal to cross below zero after seeing the red dot appear
Strength Wave
-This typically shows whether you are counter trend trading or trading with the trend.
-A buy signal from the signal line (zero cross) while the Strength Wave is red, far way from crossing above zero,
and not trending sharply towards zero may be short lived.
-A buy signal (zero cross) when the strength wave is red and near crossing zero or green and trending up has a
high chance of resulting in a higher move up and better returns.
-A buy signal when the strength wave is green but near zero or trending sharply towards zero should be approached with caution.
-These same rules apply inversely to sell signals
Sentiment Line
-This histogram showsbullish or bearish sentiment. Above zero is bullish. Below zero is bearish.
-Crosses above or below zero can signal trend reversals.

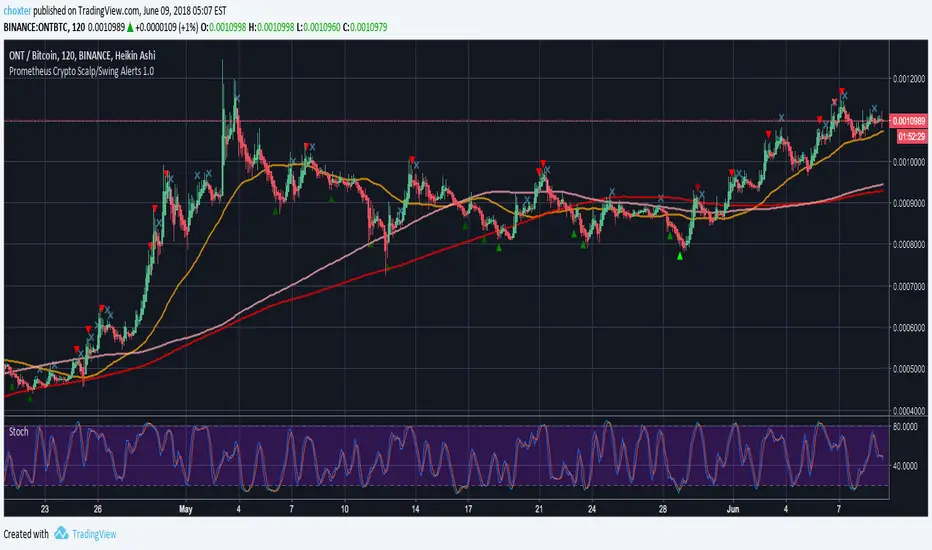
Prometheus Crypto Scalp/Swing Alerts 1.0Prometheus Crypto Scalp/Swing Alerts was built for scalp/swing crypto traders but you probably got that figured out by yourself. It offers high quality entries and exits which can be manually adjusted to suit your trading style. It performs great on any timeframe but scalp traders will love it for it’s ability to offer many entry points followed by quick exits, giving you opportunity to earn a few % within a few hours.
It has built in BUY/SELL alerts that can be connected to Autoview for automated trading.
How it works?
No drama, no complicated numbers - you only need to set the Alert strength indicator value (5-50) and according to that you will get the kind of alerts you like most. Choosing higher quality alerts will result in smaller quantity of those while picking out just the best entry and exit points and removing less interesting ones. You can always experiment and see what suits your trading style best.
Did we get your attention? If you wish to buy our script, shoot us a PM.
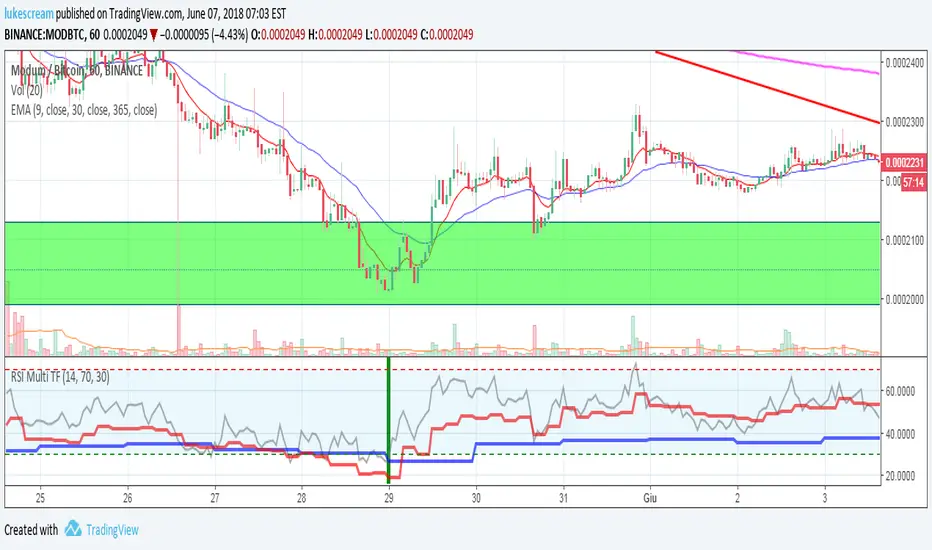
RSI Multi Time Frame - Spot Panic Sell Moments and profit!Union of three RSI indicators: 1h, 4h and daily. In order to show 1h RSI, you have to set it as active time frame on the chart.
Purpose: spot "triple oversold" moments, where all the three RSI are under the threshold, which is 30 by default but editable.
Target Market: Cryptocurrencies. Didn't try it on other ones, may work as well. Fits Crypto well as, by experience, I can tell it usually doesn't stay oversold for long.
When the market panics and triple oversold occurs, the spot is highlighted by a green vertical bar on the indicator.
The indicator highlights triple overbought conditions as well (usually indicating strong FOMO), but I usually don't use it as a signal.
I suggest to edit the oversold threshold in order to make it fit the coin you're studying, minimizing false positives.
Special thanks to Heavy91, a Discord user, for inspiring me in this indicator.
Any editing proposal is welcome!
I reposted this script, as the first time I wrote it in Italian. Sorry for that.
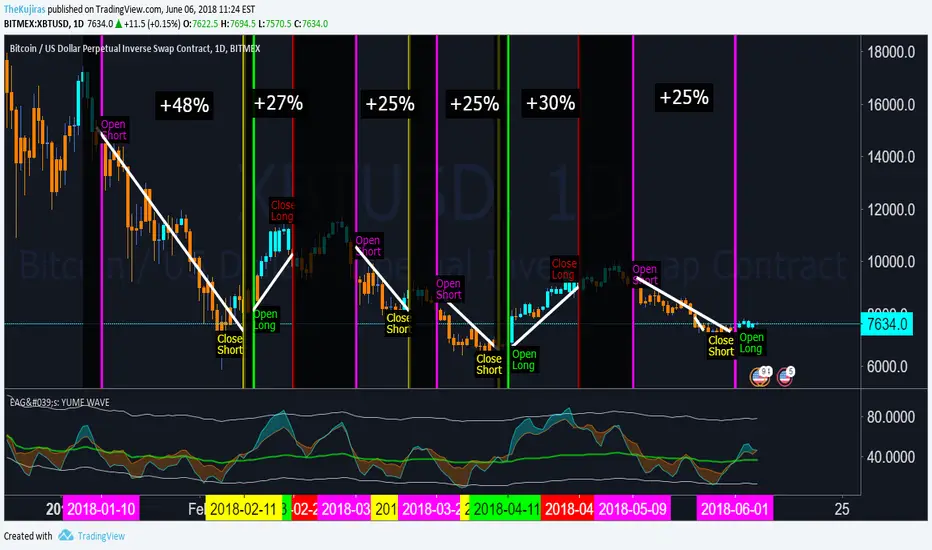
EdgeAnalysisGroup: Yume WaveDONATIONS APPRECIATED
--------------------------------
ETH: 0x862E6C54397Cf681887136472d5F16cCA22C80Fe
BTC: 16wnhEyNB5zx7ErwNi5KyszNeHhtjH2syx
ABOUT
-----------------
Yume (aqua line) is a modified high moving average of RSI
Akume (orange line) is a modified low moving average of RSI
Miaku line (green line) is a variable median line that determines market outlook
Nami is the wave (aka: cloud) that the Yume Akume lines create.
BAR COLORS are based on market sentiment using volume + price action to determine the overall health of the market and probable direction.
MODERATE RISK STRATEGY
-----------------
Bullish Long indicator:
Yume crossing above Akume over the Miaku Line (aqua wave twist)
Close Long Indicator:
Akume crosses above Yume over the Miaku Line (orange wave twist)
Bearish Short indicator:
Akume crossing above Yume under the Miaku Line (orange wave twist)
Close Short Indicator:
YUME crosses above Akume under the Miaku Line (aqua wave twist)
-----------------
DONATIONS APPRECIATED:
ETH: 0x862E6C54397Cf681887136472d5F16cCA22C80Fe
BTC: 16wnhEyNB5zx7ErwNi5KyszNeHhtjH2syx
SmartWave AlgorithmRide The Waves & Snag Some Gains
I'm currently getting great results with this setup so I thought I'd get it live as soon as possible.
All options unlocked so you can tweak it if you need to, but the default settings should be great for most.
This indicator detects the waves in the market so you can ride the trends.
BONUS FEATURES
I've also added in the ability to filter signals using RSI and/or MFI should you wish to trade only the higher probability signals.
Trial Access
Send me a PM if you would like to try this out for 24 hours
Full Time Access
Access to this and all of our other indicators can be gained by becoming a CryptoProTools member
As always, just hit me up if you have any questions!

Auto Support & ResistanceAutomated Support & Resistance Lines
Save yourself some time by taking away the need to manually draw your horizontal S&R lines on each and every currency pair you are analyzing!
Support & Resistance plays a big part in any traders technical analysis, so why not automate it? Spend less time on TA with this handy script.
Trial Access
Send me a PM if you would like to try this out for 24 hours
Full Time Access
Access to this and all of our other indicators can be gained by becoming a CryptoProTools member

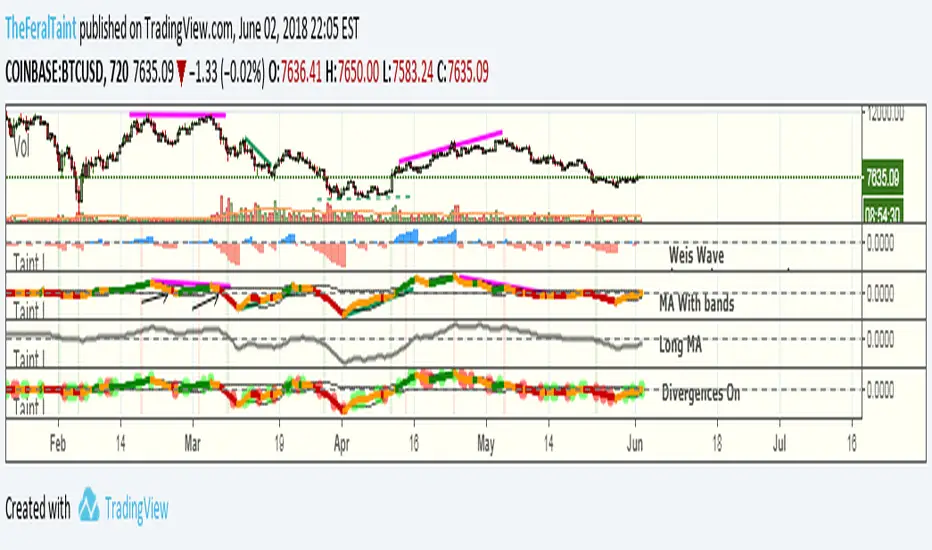
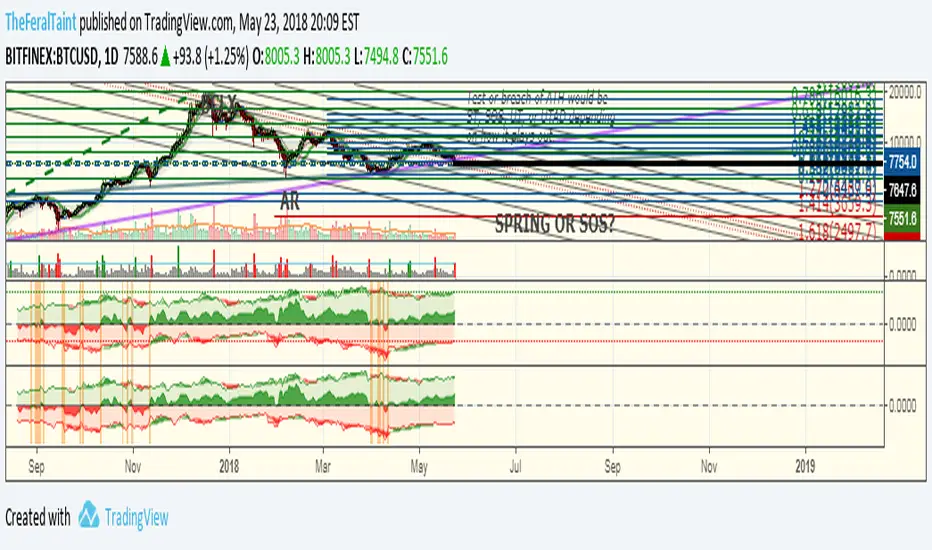
Taintalicious IndicatorThis indicator gathers data from the Weis Wave indicator (thanks to @LazyBear for the original code), and coverts it to something like a VPCI or a Chaikin Oscillator. This indicator is quite versatile. It can be ran with Weis Wave turned on and the Bands + MA turned on together, though I find the scaling becomes an issue. If it is the only indicator you're using, scaling isn't a problem as long as you enlarge it. I prefer to run the Bands + MA + Long MA as one setup, and flip to Weis Wave when I need to see the raw data underneath. You can use this indicator to spot momentum shifts, the strength of bullish or bearish moves, bull/bear divergences, trend reversals, consolidation/squeezes, and even Wyckoff springs. It will take some getting used to though.
Tips for interpretation:
--Bearish/Bearish Divergence: TI diverges from price. TI is making lower highs or higher lows while price is making higher highers or higher lows. You can turn on the setting to highlight some of these divergences, but I find it easier to simply look for them.
--As an Oscillator: TI crossing zero can indicate a shift in momentum. The deeper the initial rise or fall past zero, the stronger the momentum shift.
--Overbought/Oversold: When TI breaches the bands while they are wide--indicating high volatility in the same way Bollinger Bands do--this can be viewed as an overbought or oversold signal. Begin looking for an entry once TI forms a "v" shape, and begins moving back towards the bands. The best entry is typically when TI breaks back into the bands. These breaches are highlighted with either green or red.
--Long MA: This can be used for bull/bear divergence as well as a leading indicator for trend reversals or momentum shifts. TI crossing above or below the Long MA is one signal. Whether the Long MA is above or below zero indicates the market sentiment/trend over the last 100 periods--above zero being bullish and below zero being bearish.
Best setting for Trend Detection Length is 4
Feel free to contact me on Twitter if you have questions: @TheFeralTaint
Taint's Chaikin Money FlowAn adaptation of the standard Chaikin Money Flow. I've added the appropriate ranges to the indicator. Signals between 0.05 and -0.05 are to be disregarded. Signals greater than 0.2 or -0.2 are very strong signals. The addition of a moving average of the the Money Flow line has proven to be quite beneficial through back testing. It's best use case is for confirming trend/momentum changes on larger time frames when trading Bitcoin. I find the VWMA and SMA work best. EMA has it's uses, but I've found a 50 period EMA is more useful on shorter time frames. CMF is a powerful tool if used correctly.

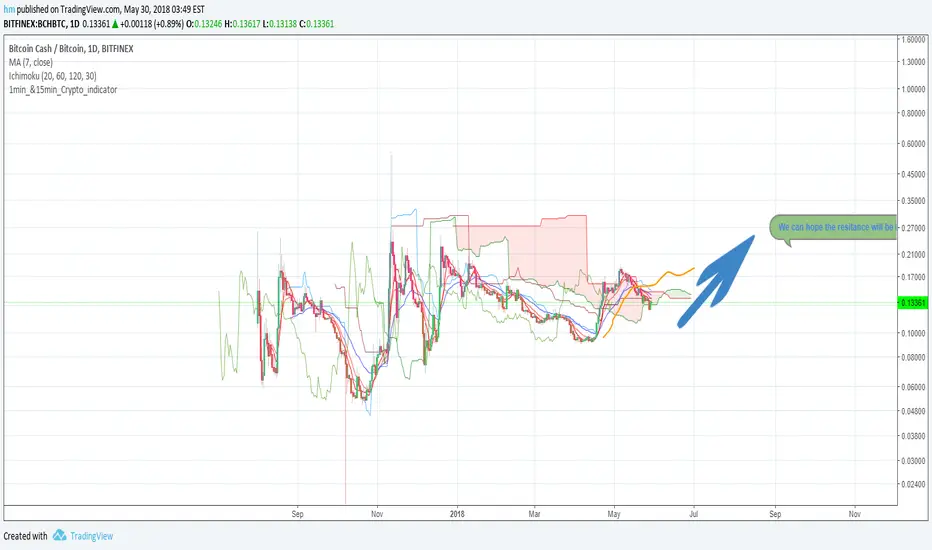
1min_&15min_Crypto_indicatorDear Crypto Community,
on
I set for my thesis a crypto indicator for 15 minutes mostly. It's work at 87 % on BTCUSD & BCH
easy to use:
Green to Short
Purpule to Buy
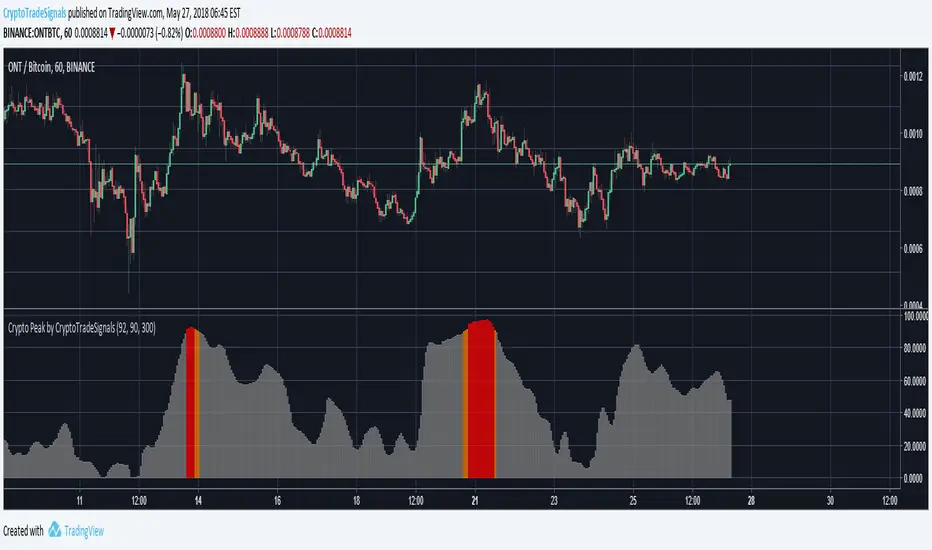
Crypto Peak by CryptoTradeSignalsRelease Notes:
1. AUTOMATED ALERTS: Staring at your phone all day? Get "Crypto Peak" alerts via email or via SMS (requires TradingView PRO Subscription).
2. CRYPTO PEAK SIGNAL: Not sure if a crypto has reached it’s “high point”? Identify the top of the market with this trading signal. When used in combination with the “Crypto Bottom Signal”, identifying the best points to “buy in” now becomes possible.
>>Get access to our Crypto Trading Indicators by visiting our website (please go to my main profile page or check the my signature)<<
QFT Crypto Bottom Feeder v2I use this indicator for testing with alerts and Autoview for buy signals. There are no sell signals, so that is entirely up to you. The goal is to catch the bottoms of small swings buy layering in. You can adjust the base sensitivity as well as how far down it's looking to buy. The buy plots are absolute locations - so where they lie, is where the buy signal alert will fire. Autoview will attempt to place a trade at the time of the alert. The goal here is to buy under the base and sell on the way up or at the support level.
How you use this is entirely up to you. I just play around with these alert signals for testing profitability. If you use this for buying alerts, you're using them at your own risk.
The average base crack % is going to be the lowest layer shown, and the other layers will go up from there. There are 5 layers.
Example: Average Base Crack is 5%
Layer1 = 1% , Layer2 = 2%, Layer3 = 3%, layer 4 = 4%, layer 5 = 5%
Example2: Average Base Crack is 10%
Layer1 = 2%, layer2 = 4%, layer3 = 6%, layer4 = 8%, layer5 = 10%

Taint's Crypto Longs v. Shorts
Taint's Longs v. Shorts
This indicator displays the relationship of longs to shorts across futures markets. The default settings are set to Bitfinex BTCUSD Longs and Shorts. You can change these to the markets of your choosing. It's best to leave the averaging to the default settings. Also, if you turn the price lines on for the first two plots, you can see the current number longs or shorts in relation to historical levels.
Middle Signals:
Longs are greater than Shorts = center area green and above zero
Shorts are greater than Longs = center area is red and below zero
These flips are highlighted with orange bars as well
Outer Signals:
The ribbon at the top of the longs and shorts area is used to judge sentiment.
Green Longs and Green Shorts = strong bullish sentiment
Red Longs and Red Shorts = strong bearish sentiment
Green Longs and Red shorts = bullish sentiment could weakening
Red Longs and Green shorts = bearish sentiment could be weakening
You can change the averaging from the defaults (7, 30) if you wish.
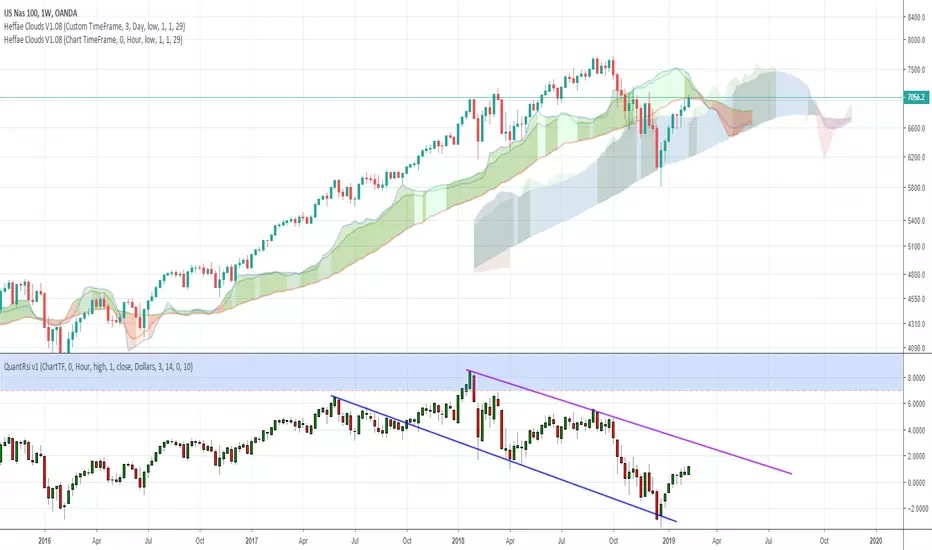
Heffae Clouds v1.00Heffae Clouds v1.0 - Ichimoku Modernized
Heffae Clouds Alpha release Version 1.0
Heffae Clouds functions as adaptive support and resistance. It has real-time paths and offset clouds, similar to ichimoku.
Paths are calculated by the complex discovery of prior behaviour for any crypto or forex asset.
Uses 5 single layer networks to calculate the optimal path fitting for any asset or timeframe.
The cloud color provides granular detail on path validity.
Please see the pastebin link for access information and links:
pastebin.com
Video introduction and trading strategy:
Some Beta-tester comments:
"It's like now having a microscope if you get what I mean. Which says great things about what you have done here. Love it man"
"I just find myself makes so many good decisions with your system it's hard to believe"
"this is without a doubt an improvement of Ichimoku (Which is my favorite tool by far). So much more info with your cloud system.."
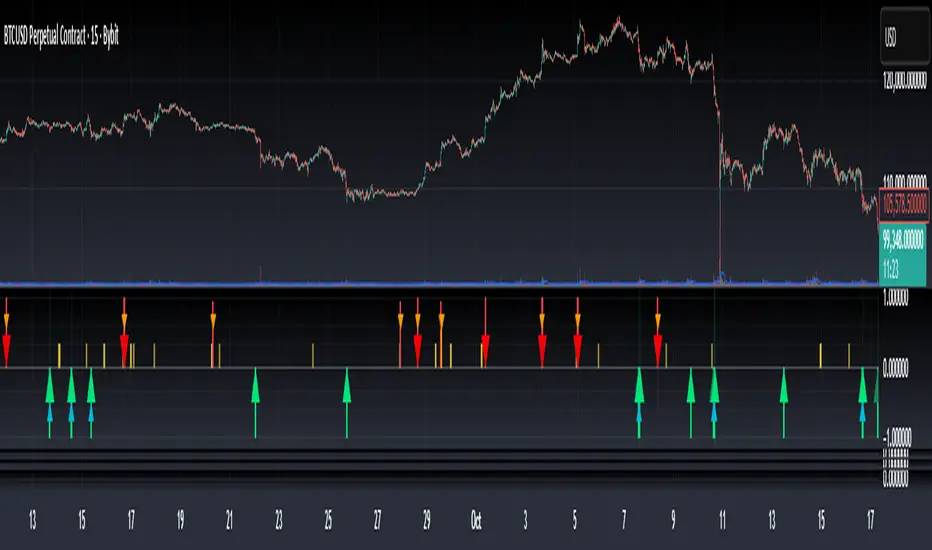
Bottom & Top Finder v3.0Bottom & Top Finder v3.0 is a proprietary multi-component oscillator designed to identify potential market reversals and extreme price conditions. The indicator analyzes momentum, volatility, and price behavior to generate bullish and bearish signals with strength classification.
█ OVERVIEW
Each signal is classified into three strength levels (Weak, Medium, Strong) allowing traders to prioritize high-conviction setups.
Signal Classification:
• Strong signals (±1.0): High conviction setups with multiple confirmations
• Medium signals (±0.6): Moderate conviction with key component alignment
• Weak signals (±0.33): Early warnings or preliminary indications
█ KEY FEATURES
Smart Signal Management
The indicator includes an intelligent system that allows signal sequences to complete naturally while preventing excessive noise. Unlike traditional cooldown systems that block all signals during a cooldown period, this implementation allows consecutive signals during a "run" and only applies cooldown after the signal run ends. This ensures complete multi-bar patterns are captured while preventing rapid flip-flopping.
Advanced Filtering System
Three optional filters allow adaptation to different market conditions:
• Volume Confirmation Filter: Validates signals against recent volume activity across a configurable lookback period. Checks if any bar in the lookback window exceeded average volume by the specified multiplier.
• Trend Alignment Filter: Four operational modes including With Trend, Counter Trend, Statistical Distance, or Off. The anomaly mode uses calculations to identify signals only at statistical extremes rather than simple directional bias.
• Signal Type Selection: Enable or disable weak, medium, and strong signals independently based on your trading style and risk tolerance.
Comprehensive Alert System
Ten distinct alert conditions cover every use case. Alerts include price level and timestamp, and are ready for webhook integration with automated trading systems.
█ HOW TO USE
Basic Setup
1 — Add "Bottom & Top Finder v3.0" to your chart in a separate indicator pane
2 — Optionally add "Bottom & Top Finder v3.0 - Chart Labels" for on-chart visual markers
3 — Configure lookback periods (defaults work well for most timeframes)
4 — Enable or disable signal strengths based on your trading style
5 — Apply filters as needed to reduce noise in your specific market
Signal Interpretation
Histogram magnitude indicates signal conviction. Multiple signal types can fire simultaneously and are aggregated into the composite score.
Alert Configuration
Set up alerts through TradingView's standard alert system using the built-in alert conditions. Choose from individual signal types (for specific setups) or aggregate alerts (for broader monitoring).
Recommended Approach
• Combine indicator signals with price action and support/resistance analysis
• Use strong signals for entries, weaker signals for early warnings or exits
• Enable filters when trading liquid markets with reliable volume data
• Adjust cooldown period based on timeframe: lower for active trading, higher for swing setups
• Start with default settings and adjust based on backtesting results
█ SETTINGS
Lookback Settings
• Main Lookback Period: Primary calculation period for most components (default: 21). Lower values increase sensitivity, higher values smooth signals.
• Range Lookback: Extended lookback for range high/low analysis (default: 50). Affects extreme condition detection.
Signal Settings
• Enable Weak Signals: Toggle weak signal detection (default: on)
• Enable Medium Signals: Toggle medium signal detection (default: on)
• Enable Strong Signals: Toggle strong signal detection (default: on)
Filter Settings
• Enable Volume Filter: Require volume confirmation (default: off)
• Volume Lookback: Period to check for volume spikes (default: 30)
• Volume Spike Multiplier: Threshold above average volume (default: 1.3x)
• Trend Filter Mode: Off, With Trend, Counter Trend, or Anomaly (default: off)
• Trend SMA Period: Moving average period for trend calculations (default: 50)
• Anomaly Threshold: Minimum statistical deviation for anomaly mode (default: 1.5)
Display Settings
• Show Composite Histogram: Toggle main histogram display (default: on)
• Show Signal Bars: Toggle triangle markers in indicator pane (default: on)
• Show RSI Reference: Overlay normalized RSI for context (default: off)
█ TIMEFRAME CONSIDERATIONS
The indicator works on any timeframe from 1-minute to monthly charts. However, optimal performance requires timeframe-appropriate configuration:
Shorter Timeframes (1m-15m)
Consider reducing main lookback period for increased responsiveness. Volume filter may be less reliable in some markets during low-liquidity sessions.
Medium Timeframes (1H-4H)
Default lookback periods are optimized for these timeframes. Volume and trend filters provide good noise reduction.
Longer Timeframes (1D+)
Consider increasing lookback periods for smoother signals. Filters are highly effective at these timeframes.
█ BEST PRACTICES
Risk Management
This indicator is a technical analysis tool designed to identify potential reversal zones and does not guarantee profitable trades. Users should:
• Understand that signals indicate potential setup zones, not guaranteed outcomes
• Employ proper position sizing and risk management on every trade
• Combine indicator signals with their own analysis and trading strategy
• Paper trade and backtest thoroughly before live implementation
• Never risk more than they can afford to lose
Signal Context
Indicator signals should be evaluated within broader market structure. Consider:
• Proximity to key support and resistance levels
• Overall trend direction and strength
• Market volatility and liquidity conditions
• Confluence with other technical indicators or patterns
• Fundamental factors that may override technical signals
█ NOTES
• All signals use confirmed bar data and do not repaint
• The cooldown system tracks top and bottom signals independently
• Multiple signal types can fire simultaneously; the composite score aggregates them
• Anomaly mode measures standard deviation magnitude, not just directional bias
• Volume filter checks any bar in the lookback period, not just the current bar
• Strong signals require more confirmations than medium or weak signals
Nefitty Cryptowave: Visual Control Lite 90DBest used under the influence of Com Truise
The wave will careen off the top and bottom of the channel. Use it to anticipate possible upcoming support and resistance lines. The midline is usually purple, and turns red when it is higher than the channel ceiling, 45 days back. Intended for daily timeframe only.
This indicator requires additional research:
Are there any leading indicators before the wave smashes into an edge?
How do we read it when it begins tightly hugging one extreme?
Can we use the midway line to predict changes?
That's it for now.
Godspeed, soldier.
- nefitty
Find me on r/cryptocurrency Discord

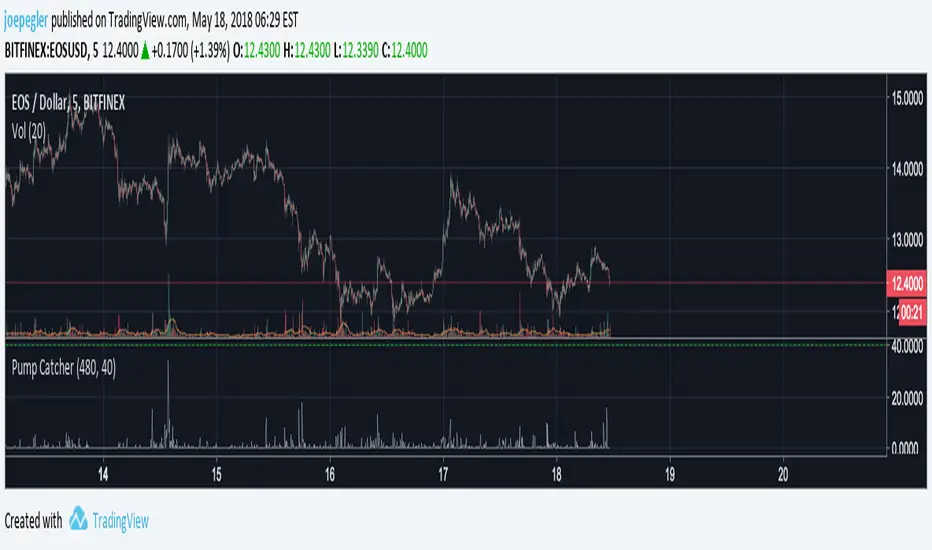
Pump CatcherThis indicator attempts to detect moments of abnormal and accelerating increase in volume. Because pumps happen over short time frames, this script is potentially better used on smaller timeframes (1 - 15 minutes). It takes two inputs: The length of the lookback for the volume rate of change (vroc) calculation (default=20), and The threshold over which a pump is determined to have happened (0-100, default=50). The vroc has been normalised to a result between 0 (no rate of change) and 100 (maximum rate of change the asset has ever undergone to date).
Top Finder 1.1Top Finder is an automated cryptocurrency signals and analysis tool which uses a complex algorithm involving multiple indicators, trends, and cross-overs including proprietary formulas developed in-house to predict the top or near top price of cryptocurrencies. It also works well on stocks, gold, oil and forex, even soybeans!
Top Finder is the sister indicator to Bottom Finder (check my other scripts).
Signal strength is represented by height/color of the signal. (Taller signal = stronger signal).

Bottom Finder 2.2Release 2.2
Bottom Finder is an automated cryptocurrency signals and analysis tool which uses a complex algorithm involving multiple indicators, trends, and cross-overs including proprietary formulas developed in-house to predict the bottom price of cryptocurrencies. It also works well on stocks, gold, oil and forex!
Future updates will be included onto this script.
Tip #1: In a bear market, the Half height (fuchsia colored) signals should be ignored by the risk averse trader. In a bull market feel free to buy on both the signals.
Tip #2: In a bear market, use a smaller percent gain instead of TSSL to set your exit targets. In a bull do the opposite, using TSSL (or method of your choice) to exit.

Bottom Finder 2.1Release 2.1 Final!
Bottom Finder is an automated cryptocurrency signals and analysis tool which uses a complex algorithm involving multiple indicators, trends, and cross-overs including proprietary formulas developed in-house to predict the bottom price of cryptocurrencies. It also works well on stocks, gold, oil and forex!
