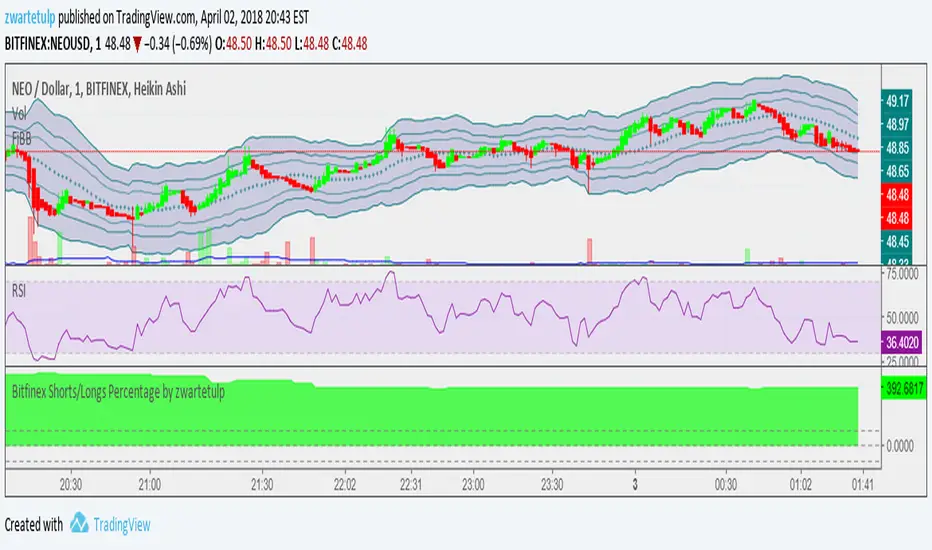
Bitfinex (BFX) Shorts/Longs Percentage by zwartetulpShows the percentage of longs vs shorts on Bitfinex (BFX).
Green area = longs > shorts
Red area = shorts > longs
加密數字貨幣
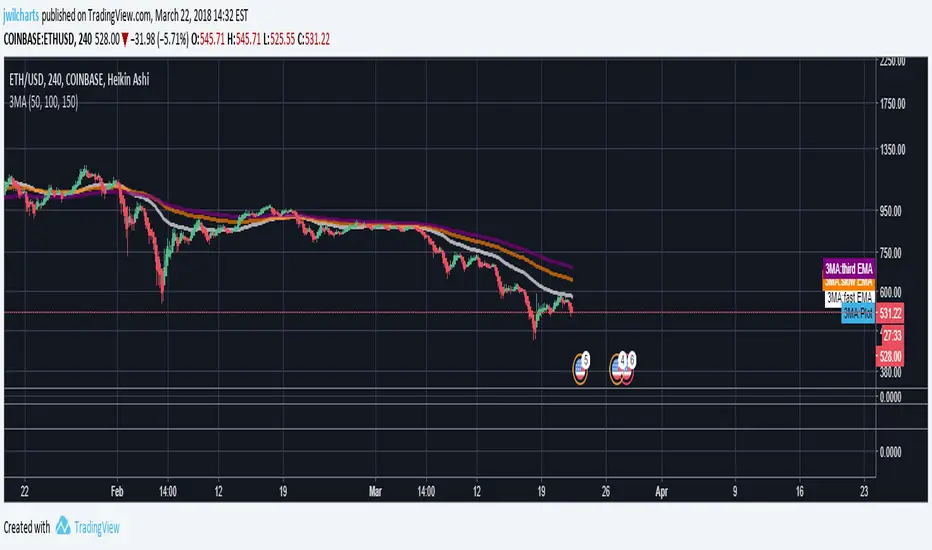
ETHUSD LONGS & SHORTS Bitfinex (margin traders)It is the interpretation of margin positions ETHUSD. Data — Bitfinex

UncleBo EasyVersion_BETAHey friends,
The Beta version of UncleBo indicator.
Trying to make it as simple and powerful as possible.
I will publish it once i feel like it does the job perfect.
----------------------
For more details and inquiries please pm me.


Ágios + MMEste script é uma versão flexível de ágios e médias movéis. Além de alterar o comprimento da média ao que acha mais adequado, o usuário pode escolher livremente o ativo (criptos ou outros) e comparar o preço entre diferentes exchanges. Ainda é possível alterar livremente a conversão de moedas.
BTC World Volume (Multi-Exchange)Release: 2018-03-29
__________________________
WHAT IT DOES
Bitcoin is listed on multiple exchanges. Many people have called for a single global index that would quote BTC volume across all exchanges: this script is such a virtual volume aggregate of the 17 largest fiat exchanges on TradingView (listed in the script comments, and in Format > Inputs for you to select). It includes USD, EUR, JPY, KRW and USDT sources.
It will, independently for each tick, quote the volume from all selected exchanges and display a stacked representation, freely inspired from CoinMarketCap charts; also a Moving Average. Each fiat/continent has its own general color, to be able to quickly glance at where volume is coming from, e.g. BitMEX or Asia. (colors are based on Google's Material Design).
By default:
Grey: BitMEX
Green: USD
Yellow: Tether (USDT)
Red: Asia (JPY, KRW)
Blue: Europe (EUR)
No more "on Coinbase this" or "on Bitstamp that", you've now got a global overview! It becomes easy to debunk a few common myths.
See CoinMarketCap for reference.
Note: Bitmex is not taken into account in CoinMarketCap (afaik) since it's trading a derivative asset (XBTUSD contracts), but it usually amounts to ~50% of the overall BTC volume in USD value. The 16 other exchanges quote their volume in BTC, and they represent 30~40% of the overall BTC volume. I believe the whole is good enough to smooth out exchanges variations, and get a fair representation of real-time activity.
__________________________
HOW TO USE IT
Just add it to your chart, it will appear as a separate indicator. By default, it appears as stacked colored "areas". There is also a total volume Histogram, which is transparent by default: you can tweak that in Format > Style.
The darker and lighter backgrounds are respectively indicative of a downward price candle (open > close), or an upward price candle (close > open). They are unrelated to volume and simply help interpreting the indicator.
You can check/uncheck exchanges in the Format > Inputs tab to remove/add some of them from computation. All are enabled by default.
You can check/uncheck exchanges in the Format > Style tab to hide them (usually you would hide all or none).
You can edit colors and transpareny as well for each exchange.
You can edit "Volume histogram" transparency to have it show (it's a simpler representation than areas).
Moving Average: You can select the type (SMA, EMA, DEMA or TEMA) and length.
__________________________
Please leave feedback below or pm me directly for bugs and suggestions.


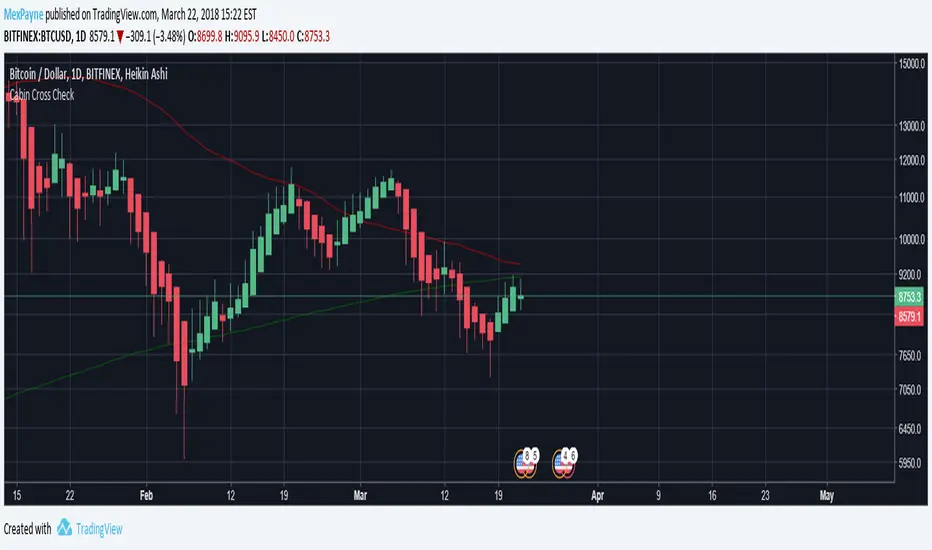
Death Cross - 200 MA / 50 Cross CheckerBITFINEX:BTCUSD
You can check if 200 day MA crossed by 50 day MA. Nuff said.
Triple EMAA simple script for displaying 3 EMA's. Commonly referred to as the "Triple EMA" strategy.

Rainbow RoadRainbow Road allows you to visualise the price in relation to the barriers of support and resistance that are the moving averages. The price can be observed breaking above barriers , or falling below them.
Rainbow Road displays these bands like a ribbon so that the strength or weakness of a security such as Bitcoin, can be observed in a very vibrant and obvious fashion.
The name "Rainbow Road" is inspired by the final course of the Special Cup featured in all Mario Kart games and is the climactic course of each game it appears.
.,-'"*.,-'"*Housekeeping*"'-,.*"'-,.
In order for you to make your chart look exactly like this one when you apply the Rainbow Road indicator, you will need to follow these simple steps.
1. Right click on your chart -> Price Scale -> Undo Indicator Labels
2. Right click on your chart -> Price Scale -> Undo Indicator Last Value
3. Right click on your chart -> Color Theme -> Black
4. Right click on your chart -> Properties -> Background -> Vert Grid Lines -> Slide transparency bar -> Horz Grid Lines -> Slide transparency bar
@#$%@#$%@#$%@#$%@#$%@#$%@#$%@#$%@#$%@#$%@#$%@#$%@#$%@#$%@#$%@#$%@#$%@#$%@#$%@#$%@%
I appreciate the feedback of all of my followers!
Like and follow for more awesome indicators!

OneX HiteshB Scalping Indicator 1.0Full Documentation:
This script uses the 10 and 20 period EMAs on the higher time frame to determine the trend and 14 period Stoch RSI from current time frame to determine entries in the direction of the trend.
Available Settings :
1. Turn On/Off Trend - This will show you the bearish trend in a red background and the bullish trend in a green background. Redundancy only, the indicator is already calculating trend without this setting.
2. Stoch RSI settings - These are set to default. The SRSI sensitivity is set to 15 for oversold and 85 for overbought, and this cannot be edited.
3. Target and Stop Loss offsets - You can modify this according to your Reward:Risk.
Known Issues:
-Old entries do not erase if the stop loss was hit
Pros:
1. Very useful in scalping in the direction of the trend
2. Can be used on ANY time frame, across ANY asset class (however I recommend using this between the 5 minute to 30 minute time frames for the most profitability, with the 15min being my personal favourite)
3. Current average profitability stands at roughly 65% across any mix of trends - this will be proven in the strategy to be released later this week)
Cons:
1. Unable to call any sort of trend reversal
2. Does not account for stop runs on lower time frames (1min-3min but I don't recommend using those time frames anyway)
Future Plans:
-Implementation of SRSI divergences
If you have any criticism or suggestions, please do comment below.
DepthHouse - Trend & Reversal CandlesticksDepth House Trend and Reversal Candlestick Indicato r is a custom trading tool designed to help traders determine trend direction, and possible trend reversal points.
Here is a video which I give a brief overview and show it in action:
youtu.be
How it works:
Based on the default settings, there are 5 primary colors that each have their own possible signal.
The colors are:
Green - Trending upwards
Red – Trending downwards
Lime –Trending upwards with a chance of reversal
Orange – Trending downwards with a chance of reversal
Grey – General trend is unknown
Please Note: There are NOT trading signals. Each colored candle represents nothing other than a possibility of which way the trend may go. Be sure to use your own adequate analysis. Use at your own financial risk.
How to get:
As you can see this is an invite only script. In the coming months this indicator, along with many others will become pay to use only. (website on my profile page)
However all my indicators will be FREE until May 1, 2018 . So please try them out!
To take advantage of this FREE trial:
1. Subscribe to my YouTube channel. I have many more videos to come! Maybe even leave a comment of what you would like to see next!
2. Comment on this indicator post! Maybe even give me a follow :D
I hope you all enjoy!!
Indicator website: depthhouse.com

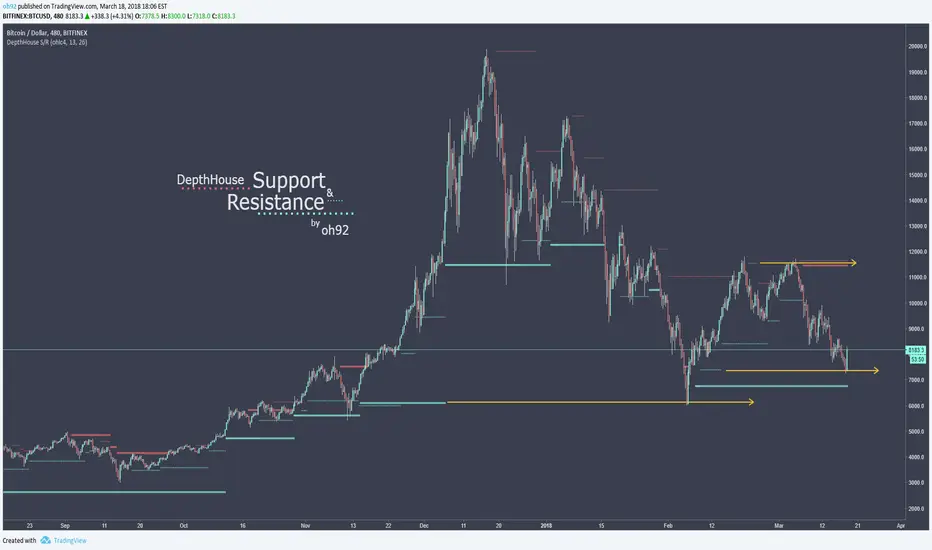
DepthHouse - Support and Resistance IndicatorDepth House Support & Resistance Indicator is a custom trading tool designed to help traders locate possible support and resistance levels on stocks, cryptocurrencies, and all forex pairs.
A fantastic tool on all time frames.
Here is a video which I give a brief overview and show it in action:
youtu.be
How it works:
Based on the default settings, the ticker dots represent strong support and resistance while the smaller lines tend to represent weaker support/resistance.
As shown on the chart above, even after a line stops plotting, it still serves as possible support and/or resistance.
Changing the settings completely alters the support lines, so adjust and find what works best for you!
How to get:
As you can see this is an invite only script. In the coming months this indicator, along with many others will become pay to use only. (website on my profile page)
However all my indicators will be FREE until May 1, 2018 . So please try them out!
To take advantage of this FREE trial:
1. Subscribe to my YouTube channel. I have many more videos to come! Maybe even leave a comment of what you would like to see next!
2. Comment on this indicator post! Maybe even give me a follow :D
I hope you all enjoy!!
Indicator website: depthhouse.com
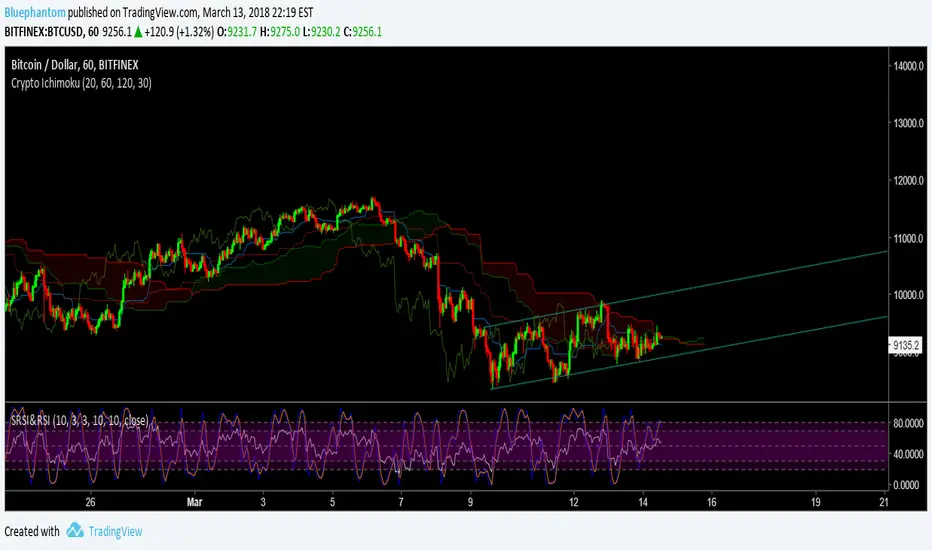
Crypto Ichimoku by BluephantomAs Cryptocurrencies are a 24/7 market I've created a cryptocurrency version of the Ichimoku.
I haven't made any major changes to how the ichimoku works.
Default settings are (20,60,120,30);
you can also try (10,30,60,30).
If you find my Scripts useful and would like to donate:
BTC:
3DVzwAggm2PuQ9y3ENxB8UWe5Sij7L55Nz
LTC:
MDTsyKDp9eshASbMvcwXFM2MRNBDEBbXiA
UncleBoUncleBo looks for the institutional finger prints, the whales or the big boys.
Looks for price, volume , momentum analysis tools and COMBINES the most famous indicators.
Works for any kind of market.
Only thing you have to do is forget about any indicator you used before and look at lines. This helps you overcome your emotions.
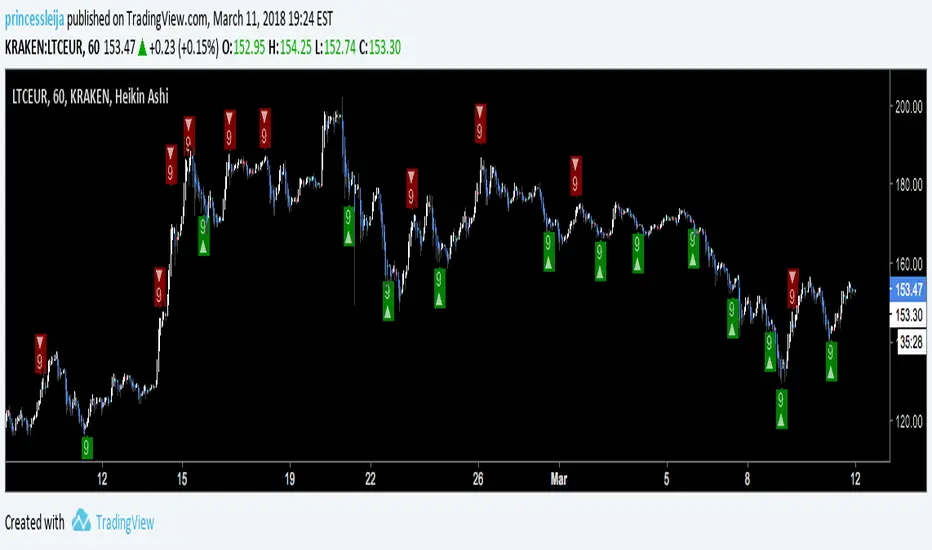
PRINCESSLEIJAS TDSSDue to several requests I'm going to give you temporary access to my TDSS script once again. In this version you can add the signals to your alerts (just right-click on a green/red signal and choose "Add Alert"). Please remember just to buy under a solid base and just use these signals as an indicator to catch highs/lows.
ALWAYS USE HEIKIN ASHI
May the force be with you,
-princessleija-
[NG] Territory - BTC - v1This indicator marks the territory for BTC growth
- when the indicator is in positive region (above zero-line) - it means, that BTC is expected to grow.
- when the indicator is in negative regision (below zero-line) - it means, that BTC price may decline.
This Indicator offers several options, and can be used for:
- spotting long term trades
- spotting intraday/short term trades (set MA Diff to 'on')
- trend indication via bar colors or background colors
- several ma types for the indicator in-built
- smooth out indicator plot, etc.
Here is another version of this indicator:

Bitfinex Margin VolumesQuick view on longs/short margin positions on Bitfinex for current Crypto Symbol.

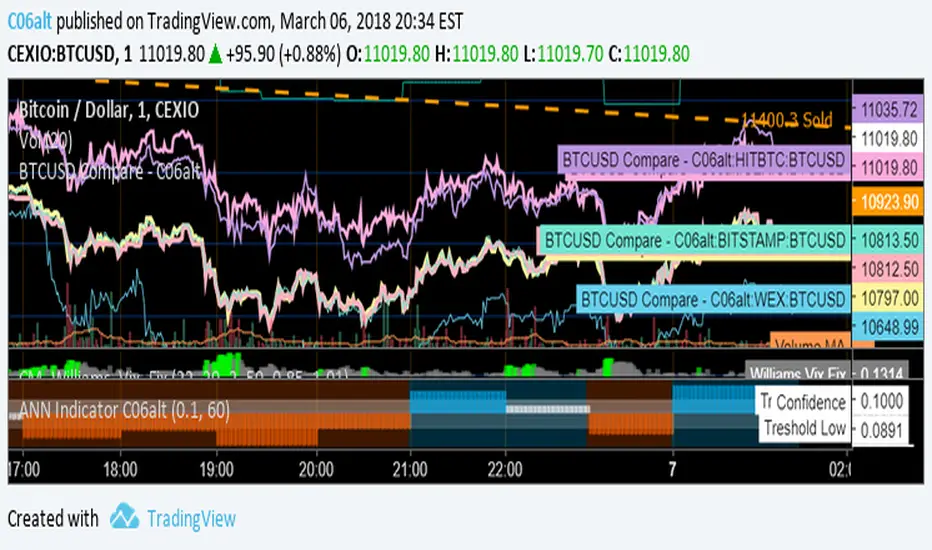
BTCUSD Compare - C06altThis Indicator allows for quick comparison between the BTCUSD exchange closing prices.