Accumulation/Distribution ViewsThis is a script for a view I wanted to go along with the Autoview plugin I bought. Keep in mind this is my first script and was created for me to learn the Pinescript framework. This isn't meant to be perfect. Indicator colors are usually blue or green or red. Also keep in mind since this is my first script in a new framework, the more stuff I build the better improvement. This is just something I wanted to first create with settings I wanted for variance and colors. The things I create in the future will obviously be an improvement.
加密數字貨幣
Auto Divergence StudyDiscover Divergences of Price vs Momentum or Price vs. CCI
Ready to be used with Autoview to automate your Trades
Supports Pyramiding
Buy-/ Sell-Signals
Alerts to open and close Trades
This Work is based on and combines the following Studies:
Jeddingen Divergence v4
CCIDivergence
Thanks to this amazing guy, who helped me with the Autoview support:
www.tradingview.com

X-LinesИндикатор X-lines давно известен для пользователей торговой платформы Metatrader 4 & 5. Он показывает интересные рынку цены (уровни поддержки и сопротивления). Индикатор работает без опоздания и как только бар будет закрыт по интересующей рынок цене, тут же над ним появится символ "X" и начнется прорисовка уровня до следующего важного значения . Уровни (цены) которые указывает индикатор являются истинно важными для рыночного процесса (по ним отрабатывается или отрабатывался в прошлом крупный объем сделок). Соответственно подобные цены в будущем могут быть целью торгового процесса и могут выступать, как поддержкой так и сопротивлением.
Настройка индикатора предельно проста, имеется возможность менять значение только одного параметра: Levels Power (сила уровней), по умолчанию значение равно 9-ти. Чем выше значение тем более слабые уровни показывает индикатор (соответственно уровней становится больше). В случае низких цифр индикатор показывает сильные и более важные цены (соответственно уровней становится меньше). Работу индикатора обеспечивает авторский алгоритм. Индикатор не строит уровни по вершинам цен или по краевым барам он автоматически и своевременно определяет отработку объема по цене закрытия бара тем самым обеспечивая практически 100% точность уровня.
Важно отметить, что в силу особенностей облачного языка PINE индикатор кое что потерял, а кое что приобрел. Для более удобной разметки уровней, просто расставите горизонтальные ценовые уровни соответственно показаниям индикатора.
English
The X-lines indicator has been long time known by users of the Metatrader 4 & 5 trading platform. It shows interesting market prices (support and resistance levels). The indicator works without delay and as soon as the bar is closed at the interesting price, immediately after that the symbol "X" will appear above bar and the level will be drawn to the next important value . The levels (prices) that the indicator showing are truly important for the market process (according to them, a large volume of transactions is processed or was working out in the past). Accordingly, such prices in the future can be the goal of the trading process and can act as support and resistance.
The adjustment of the indicator is extremely simple, it is possible to change the value of only one parameter: Levels Power, which default value is 9. The higher the value, the weaker the levels, the indicator (correspondingly, the levels becomes larger). In the case of low figures, the indicator shows stronger and more important prices (correspondingly, the levels are getting smaller). The work of the indicator is provided by the author's algorithm. The indicator does not build levels at the tops of prices or on edge bars, it automatically and in a timely manner determines the amount of work to be done at the closing price of the bar, thereby providing a nearly 100% level accuracy.
It is important to note that, due to the peculiarities of the cloud-based PINE language, the indicator has lost something, and has acquired something. For a more convenient level markup, simply place the horizontal price levels according to the indicator readings.

Cryptotutor CrossThe cryptotutors cross is a lagging indicator that can help detect a change in the trend. For example, it can help detecting an upwards or downwards movement of Bitcoin (on 1H), which can save you a lot of money when you are in altcoins.

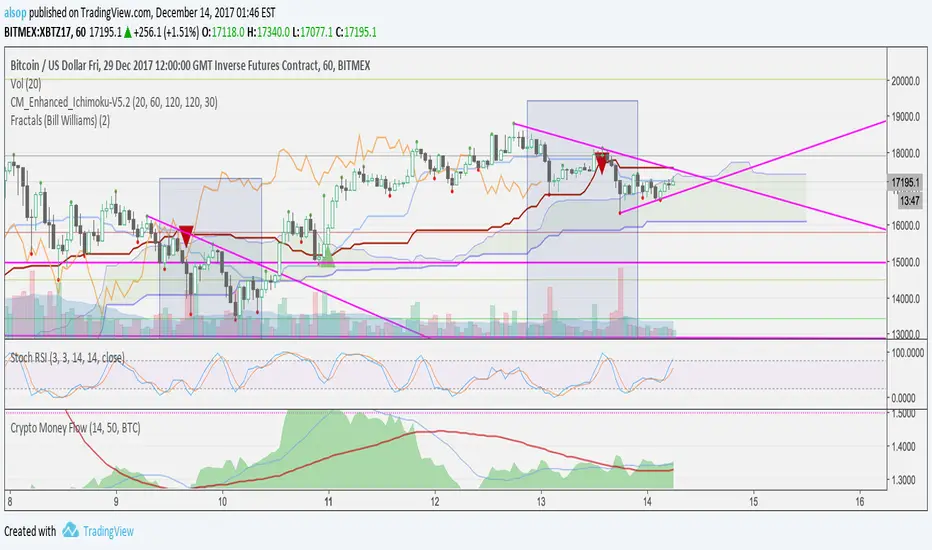
Crypto Money Flow RatioThis indicator shows you the movement of buyers and sellers in the market. Combined with other indicators like Stochastic RSI it can be a very powerful early indicator to buy and exit.
In this example, there are two moving averages applied to the indicator (at the bottom). Once the Fast crosses the Slow and the area is above both - this tells you the major market players are accumulating and you should be looking to long.
In addition, Stochastic RSI is also oversold and Ichimoku shows price above the cloud - all confluence on a long trade. As you can see, in the next hour price rocketed.
This size of move isn't always common, and this move may have been due to news. Even if so, people were aware and started buying and you could see it happen.
Another example here with DASH.
In this example, you can see there was a previous bull move that we applied a fib to and had a 38% retracement. We bought on the indicator cross and ratio above averages with a target of a 38% extension. It hit almost exactly and we closed out.
To apply this to other currencies, change the settings. For example, for ETHUSD - change the setting from BTC to ETH.
BITFINEX:BTCUSD
Simple Spread Simple spread between two tickers. Click format to set inputs for tickers. ex: "COINBASE:BTC:USD"

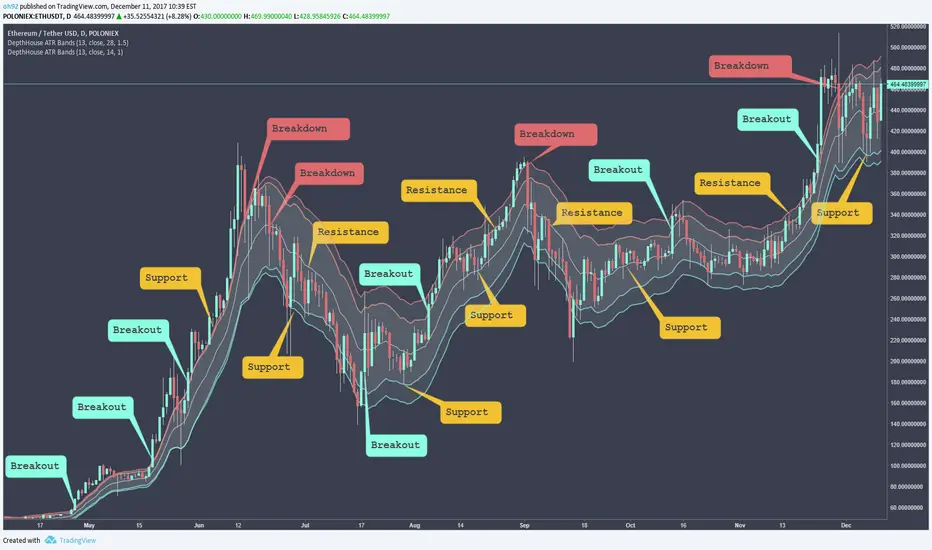
DepthHouse - ATR BandsDepthHouse ATR Bands is a FREE INDICATOR
Similar to the well-known Bollinger Bands.
Instead of using the standard deviation formula, ATR Bands determines the size of the bands based on the adjustable average range.
IF you use this FREE Indicator:
Please like and comment!
Check out my channel on YouTube! youtu.be
Bitcoin and Ethereum Donations are always appreciated :)
BTC : 1MLnVPqebcFTqYEVAKm9dSCRWhyNDmAb5W
ETH : 0xEEcD7Ce6E22AfA6083074c4CCd326Be0b1C932d9
How to use:
The bands tighten while the markets’ range becomes lower, and widens as its' range becomes broader. Giving the indicator a loaded spring effect.
A break outside of the bands in either direction indicates a possible breakout.
All 3 bands serve as possible support and/or resistance. Meaning breaks back into the bands could indicate a reversal, or end of the breakout.
This indicator is completely customizable, so compiling multiple sized bands on top of each other may create a strong competitive edge.
--
IF YOU SUBSCRIBED
This indicator was intended to be available for purchase Jan 2018.
However, with recent change of mind I have decided to make it free to use.
IF you previously subscribed. I greatly appreciate your interest and I hope you enjoy this now FREE indicator!
Once again, thank you!
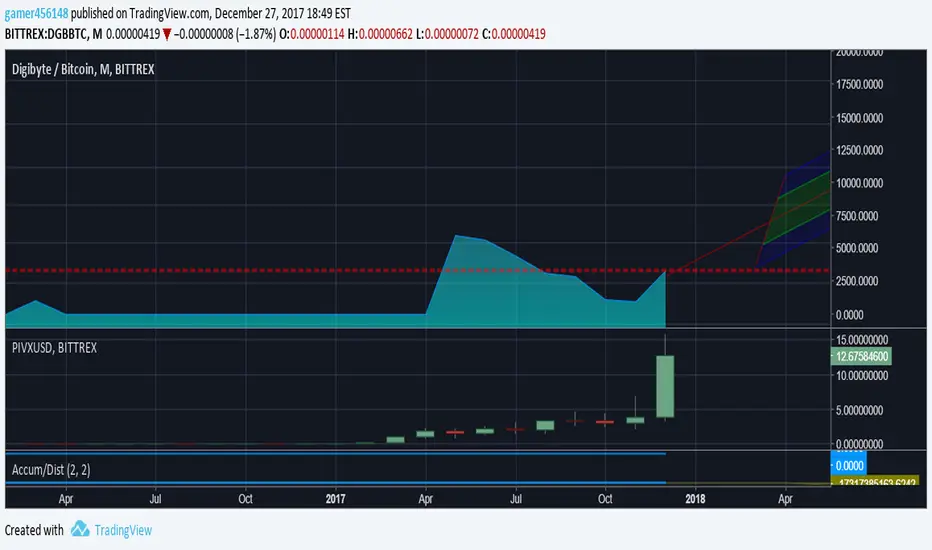
IOTA Market CapThis plots the exact value of the current IOTA market capital in real-time.
You can find this indicator in the public indicator library!
Search, " IOTA ".
Like and follow for more cool indicators! :)

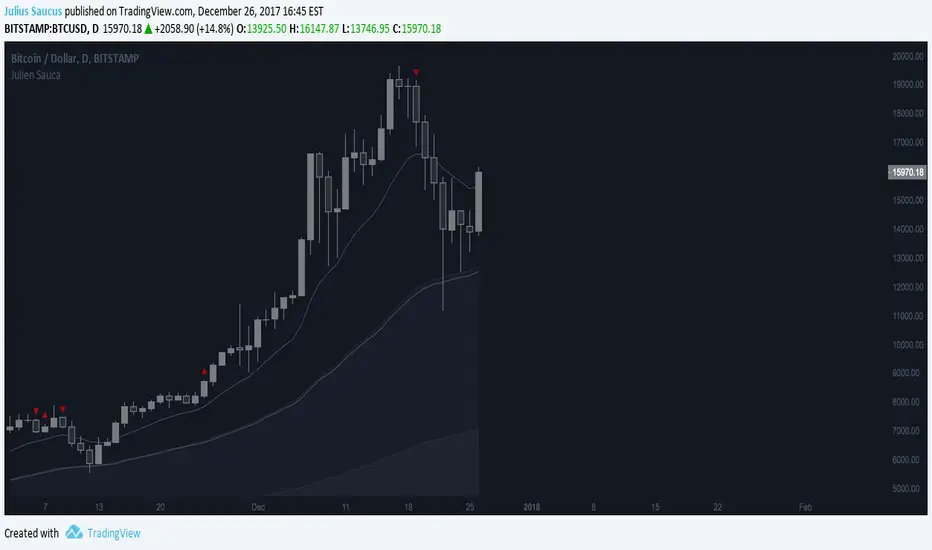
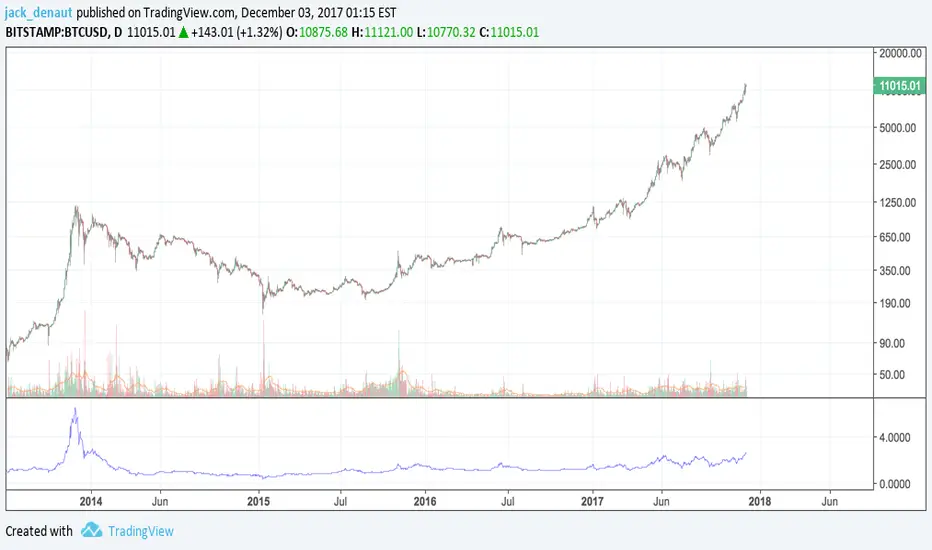
Bitcoin MultipleMultiple of Bitcoin over the 200 day average.
Inspired from: www.theinvestorspodcast.com
NG [Crypto Hype Meter]Highly configurable crypto market hype meter. Very simple to use.
Time to time update market circulation values from coinamrketcap.com
Essentially if you see green hype is high if you see red market is chaotic.
Additionally 2 ema for confidence.
Thanks @CryptoPredictions for idea

DepthHouse - Moving Average ChannelsThe indicator Moving Average Channels was created for experimental purposes due to the parabolic moves BTC has made in the recent past.
How it works:
The basis, or center line, is a standard moving average that is set by the user.
The bands are then a customizable percentage of the basis.
Which based on the settings, could serve as possible support and resistance.
DepthHouse – Moving Average Channels has been published for you all to see and try for yourselves.
Maybe this indicator has uses elsewhere? If you find something feel free to post it in the comments below!
If you like this indicator, please drop a like or comment!
They are very much appreciated!
Be sure to go to my profile and check out my other indicators!

DepthHouse-MaxADXDepthHouse's MaxADX is 1 of 3 indicators that will be available for purchase via subscription come Jan 2018.
This indicator combines the use of directional information and smoothed moving averages to help traders indicate trend reversals and strengthening trends. As you can see in the chart above this indicator makes it very easy to spot trend reversals in trending markets.
Where this indicator falls short unfortunately, is its use in ranging markets.
This is a great indicator for all beginners and professionals who prefer to trade in volatile markets such as cryptocurrencies.
This indicator package will come with 3 indicators:
MaxADX
Premium oscillator to help spot forming trends and reversals.
MaxADX Signals
Taking MaxADX a step farther by creating an overlay that show possible trend strengthening and reversals via bar colors and shapes.
ATRBands
Like Bollinger Bands, this indicator is uses to help spot breakouts, and overbought/sold areas.
How to get:
To qualify for the trial period which ends January, 1st 2018, please go to the link in my bio and click subscribe!
You will then be sent directions for your account to be added to the whitelist.

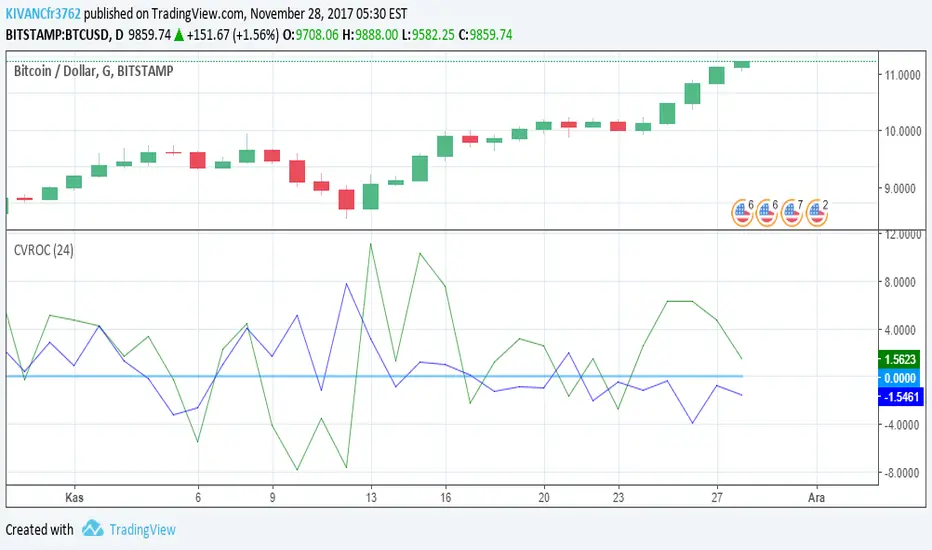
CVROC - Close Volume Rate Of ChangeIndicator designed for cryptotraders to understand whether if the price change is supported by the volume or not
deafult value os SMA of volume is 21 periods
which can be optimized by the user
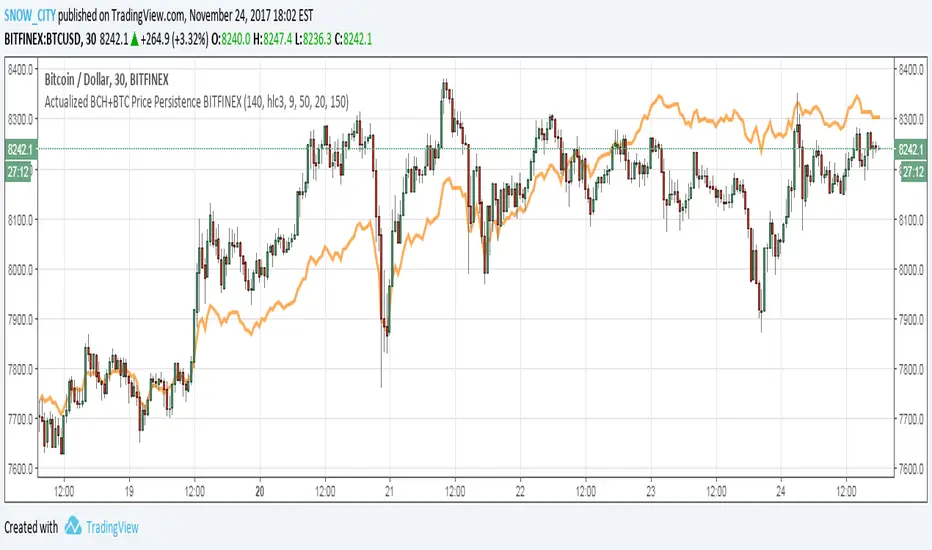
BCH / BTC Domination Correlation - FINEXBlue Line shows the BCH dominance of a particular BTC price move.
Blue is fast, orange is slow
This version is the oscillator script of a 2-in-1 overlay + oscillator depending on which plots are enabled.
Use with "Actualized BCH+BTC Price Persistence BITFINEX" - the overlay version of this script.
SNOW_CITY

Actualized BCH+BTC Price Persistence BITFINEX
Price Line overlay shows combined BCH+BTC price normalized to the price of BTC, which is the realtime combined price (BCH+BTC) averaged over the SMA of BTC - SMA of BCH.
This indicator is a 2-in-1 overlay + oscillator depending on which plots are enabled.
This version is the overlay script, this is why there are maths that are not used by the plot.
NEED to adjust the SMA Persistence normalization depending on chart resolution.
Use with BCH "Domination Correlation" - the oscillator version of this script.
SNOW_CITY