CryptoKiller Support ResistanceThe CK family is ready to welcome a new indicator: CryptoKiller Support Resistance.
Our oscillator determines the levels where the price has congestion, both up and down.
This is why we decided to exploit these signals so as to make an indicator capable of tracking supports and resistances.
The indicator marks the support and resistance levels found by CryptoKiller Oscillator, the blue / light blue lines are found
during bullish movements; purple and magenta lines are found during bearish movements.
The light blue and magenta colors indicate probable support levels, the blue and purple colors indicate probable resistance levels.
If multiple lines occur in a narrow price range, the price is in an area where there is a high probability of reversal (probable market top or bottom).
As well as CryptoKiller and CryptoKiller Oscillator it is optimized for ETHUSDTPERP 30 min, BTCUSDTPERP 30 min and BNBUSDTPERP 30 min, but it can be used on any chart and timeframe, there is a custom mode with which to change the input parameters.
This script is provided together with CryptoKiller and CryptoKiller Oscillator. It is also possible to have it separately from the others, as always with a free trial week.
加密數字貨幣

ExpertToken Buy/Sell SignalExpertToken Buy/Sell Signal เป็นอินดิเคเตอร์ที่สามารถบอกสัญญาณการซื้อขาย และบอกแนวโน้มของราคาได้
หลักการทำงาน
สัญญาณ Buy/Sell ถูกกำหนดโดยการใช่ CCI วัดโมเมนตัมการซื้อขาย หาก CCI ส่งสัญญาณว่าแรงขายเยอะเกินไป และมีแนวโน้มราคาจะกลับตัวสูงขึ้น ก็จะส่งสัญญาณ Buy แต่หาก CCI ส่งสัญญาณว่าแรงซื้อเยอะเกินไป และมีแนวโน้มราคาจะกลับตัวต่ำลง ก็จะส่งสัญญาณ Buy
เส้นสีน้ำเงินเป็นเส้น EMA 200 ไว้ใช้บอกแนวโน้มระยะยาว
เมฆขาว ประกอบไปด้วย เส้นสีเขียว(เส้น EMA เคลื่อนที่เร็ว) และเส้นสีแดง(เส้น EMA เคลื่อนที่ช้า) โดยให้ทั้งสองเส้นตัดกันเพื่อบอกสัญญาณการกลับตัว ค่าเริ่มต้นของทั้งสองเส้นเป็น 20, 50
วิธีการใช้อินดิเคเตอร์
ขั้นตอนแรก ให้ดูเส้นสีน้ำ หากราคาอยู่เหนือเส้นสีน้ำเงิน อาจมีแนวโน้มที่ราคาจะขึ้น
ขั้นตอนที่สอง ให้ดูเมฆ ที่ถูกสร้างขึ้นโดยการน้ำเส้น EMA 2 เส้น สีเขียวและสีแดง หากเส้นสีเขียวอยู่เหนือเส้นสีแดง ราคาอาจมีแนวโน้มที่ขึ้น หากเส้นสีแดงอยู่เหนือเส้นสีเขียว ราคาอาจจะลง แต่ถ้าหากราคาอยู่ในโซนเมฆขาว(ราคาอยู่ระหว่างเส้นเขียวกับสีแดง) ราคาอยู่ในช่วงเป็นกลาง
สุดท้าย หากมีข้อความบอกสัญญาณบอกว่า Buy หรือ Sell ให้พิจารณาจากสองขั้นตอนก่อนหน้านี้ หากมันสอดคล่องกับสองขั้นตอนก่อนหน้านี้ ให้พิจารณาการเปิดตำแหน่งตามสัญญาณ
################################################################################################
ExpertToken Buy/Sell Signal is an indicator that can give you trading signals. and tell the trend of the price
How it works
Buy/Sell signals are determined by using CCI to measure trading momentum.
If CCI signals too much selling pressure and there is a tendency for the price to reverse higher It sends a buy signal, but if CCI signals that it is overbought and the price tends to reverse lower will send signal Buy
The blue line is the EMA 200 line to indicate a long-term trend.
The white cloud consists of a green line (fast moving EMA line) and a red line (slow moving EMA line), with the two lines intersecting to signal a reversal. The default values for both lines are 20, 50.
How to use the indicator
The first step is to look at the watercolor lines. If the price is above the blue line There may be a tendency for prices to go up.
The second step is to look at the clouds that are created by watering the 2 EMA lines, green and red. If the green line is above the red line The price may tend to go up. If the red line is above the green line, the price may go down, but if the price is in the white cloud zone (the price is between the green and red line), the price is in the neutral range.
Finally, if there is a signal to say Buy or Sell, consider the previous two steps. If it complies with the previous two steps Consider opening a position based on a signal.

RaBot V1.0.0 - BacktestingRabot is an indicator for new users as well as experienced users.
This indicator tries to predict both buy and sell signals. You can configure it for both scalping and swing trading.
It has two modes, one more "conservative", where the number of entries will be less than the other "greedy" mode.
Based on the famous and complex indicator "Koncorde" that combines both trend and volume knowing the manipulation of strong and weak hands, patterns, and crossing of emas customized by us; for example: a buy signal in conservative mode will only open if the trend is bullish and vice versa.
The user can configure the way they like by opening many positions or few but more secure based on their trading style.
The indicator also has the option to configure which chart we want to obtain the trend from, this is to avoid perhaps opening shorts in a very bullish trend line for example.
Rabot is a fairly complex indicator, which can be used for automatic use of inputs and outputs, as well as manual.
You also have the option of NOT opening a position if there is one currently open, and the option for the next signal to be the opposite of the last one.
5TPs, 1SL, and Breakeven after take profit achieved.
Finally version 1.0.0 is now available! :)
This version contains backtesting with 5000 backbars to see if it is being profitable or not.
We are continuously working, testing and updating bugs and improvements.
Do not hesitate to get in touch for a feedback, it will be welcome and we will take it into account.

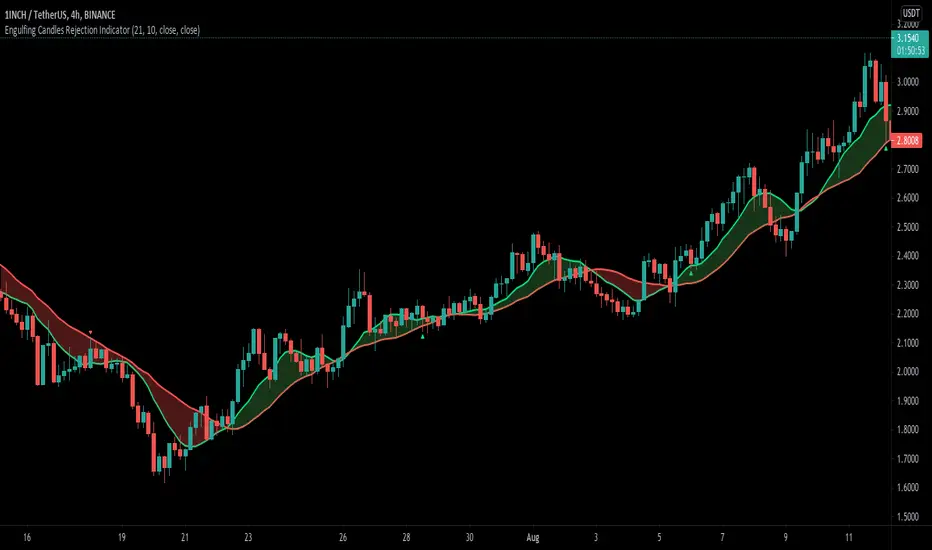
Engulfing Candle Rejection IndicatorThis indicator allows you to filter noisy chart, with engulfing candles which have been rejected from current trend lines. Trend lines by default are 21 MA (fast) and 10 MA (slow one). If fast moving average is greater than slower one, automatically indicator would represent that like uptrend, and if opposite then like a downtrend.
Consider to work only on higher time frames like 1H and higher, so you really can find only best entries.
Have fun, best wishes!
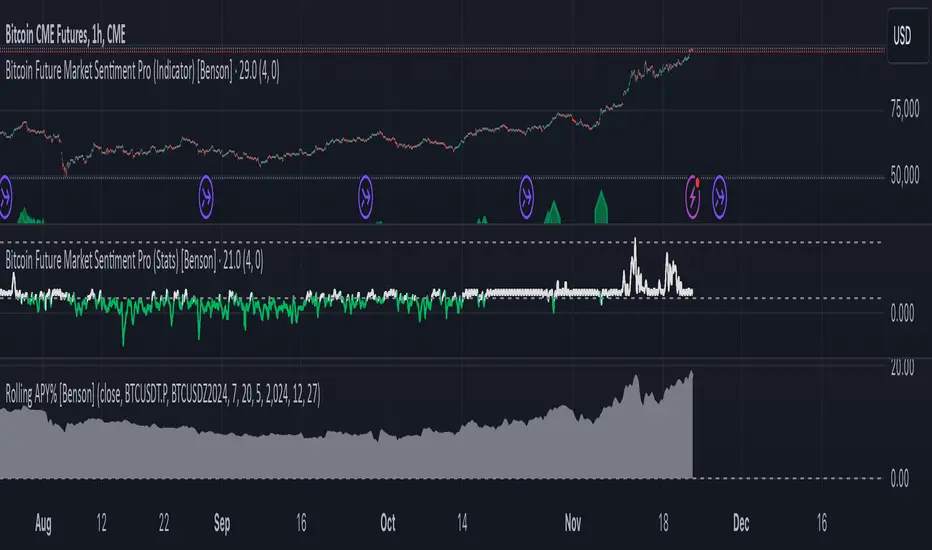
Rolling APY% [Benson]The indicator shows future rolling APY%.
Users can change the market by changing symbol. BTC is the default market.
Meanings of different BTC Rolling APY%:
Below 0 %= DOOMSDAY (it happened during the big crash on March 12, 2020)
0%-5% = extremely fearful
5%-10% = neutral
10%-15% = slightly optimistic
15%-20% = very optimistic
Above 20% = FOMO (it happened during the global top on 14 April, 2021)
Use this indicator to identify the arbitrage opportunities and the price top/bottom.
This is a paid indicator. Only for Sentiment Indicator subscribers.
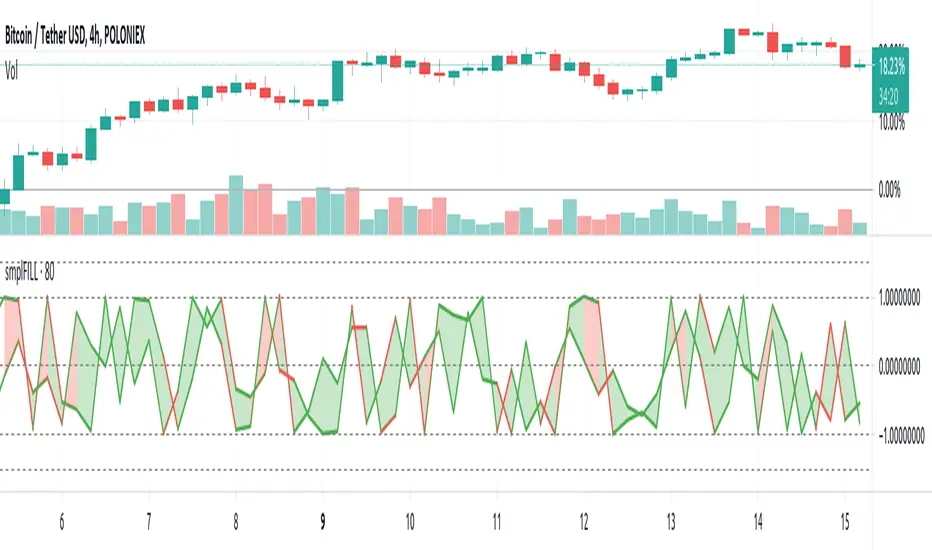
FILL - SimpleFill might flip you a lot of signals close on transitions involving high volatility having wide price swings within settings sensitive intervals. In other words, the script redraws like crazy, so alerts set to 'once per bar' are reset on redraw to view the bar as just having started again.
So, if you do webhook with this, you might find it the easier way to deal with the behaviour; using a personal alert-handling API and programmatic access to an Exchange trading account, filtering and checking that alerts are treated on volatility, volume and velocity, missing ingredients in this particular implementation.
The script is about 20 lines long with declarations and horizontal line decorations included in that number.
Alerts may not work as expected.
Enjoy.
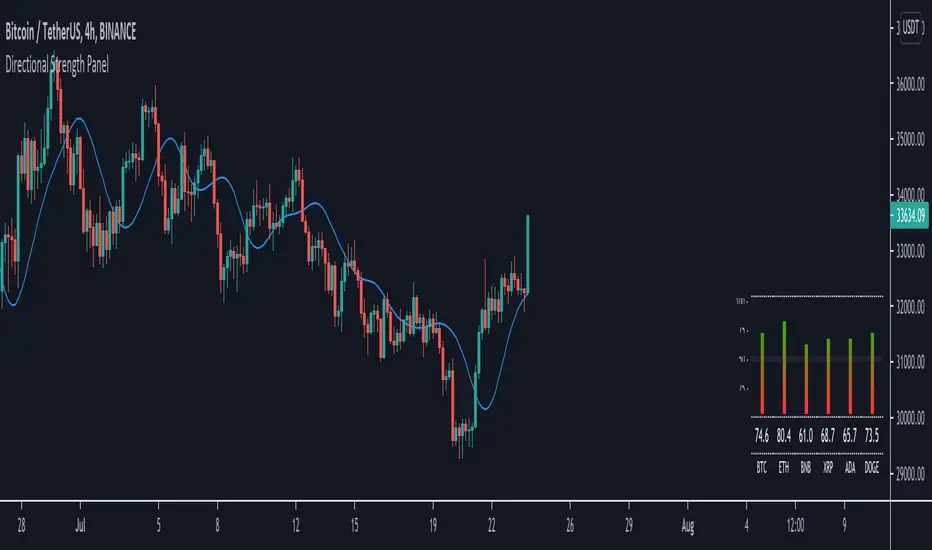
Directional Strength Panel█ OVERVIEW
The panel display trend momentum of selected coins/symbol (up to 6) based on the Arnaud Legoux Moving Average (ALMA). I'm using ALMA to measure the trend because it resolves 2 main issue of the more common moving averages, smoothing and responsiveness. By removing the minor fluctuations in price without sacrificing the responsiveness, the trend become much more clearer and easier to be measured.
In essence, as the meter approaches 100, it means the ALMA is pointing up (0 means pointing down)
█ Features
- Adjustable ALMA settings with options to turn on/off display the ALMA on current chart
- Select 6 symbols of your choice to be monitored in the settings (You have to manually update the label to display)
- Working on all timeframes
- Switch the panel color to suit background chart theme (Light/Dark)
█ Developer Notes
I'm working with table a lot lately and decided to publish this as a sample if anyone wishes to edit the script to display whatever they want. main calculation in get_data() function should be clamped to value between 0-100. As for the panel size, you can edit the row_max (currently set to 20 and 40) if you need it to be smaller or bigger (**i feel anything smaller than 16 is ugly)
█ Disclaimer
Past performance is not an indicator of future results.
My opinions and research are my own and do not constitute financial advice in any way whatsoever.
Nothing published by me constitutes an investment recommendation, nor should any data or Content published by me be relied upon for any investment/trading activities.
I strongly recommends that you perform your own independent research and/or speak with a qualified investment professional before making any financial decisions.
Any ideas to further improve this indicator are welcome :)
Boltoc DominanceThis indicator is simply an oscillator form Bitcoin Dominance made to ease the process of comparing cryptocurrencies with Bitcoin's Dominance

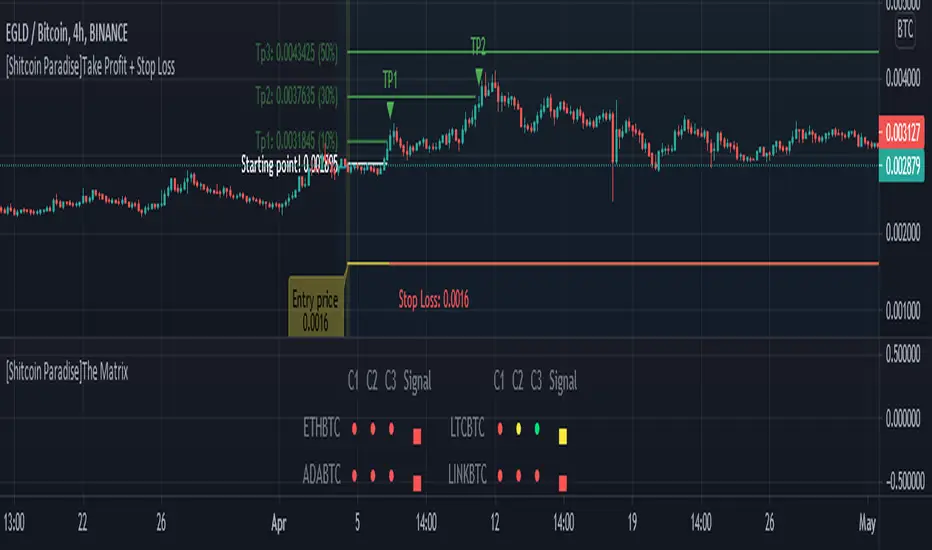
[Shitcoin Paradise]Take Profit + Stop LossThe Take profit + Stop loss indicator is built around The Matrix strategy , it is not suitable for anything else!
*Use it only on 4h charts*
How to use it:
- when a setup from The Matrix is ready, set the date and hour when that setup happened
- set the entry price
- set the targets (you can use the default ones)
- for conservative trading, check the "Use only one TP?" box
- set alert messages for every event
When the price reached the first TP, the stop loss will automatically be moved at entry price, yellow line (entry price) become red(stop loss).
The indicator can be set to have 3 take profits (it takes longer to finish a trade, the reward is greater, but also the risk is bigger), or the conservative way, with only one take profit.
The Take profit + Stop loss indicator uses 3 different stop losses in cascade, multiple algorithms and MTF to calculate them and calculate the starting point, from where the targets are calculated.
Scenario 1:
The price have a setup for continuing the trade, the price touches 1st TP, SL is moved to the entry price, the price reaches all targets => the trade is closed.
Scenario 2:
The price have a setup for continuing the trade, the price touches 1st TP, SL is moved to the entry price, the price fail to touch the other TPs and SL is triggered.
Scenario 3:
The price does not have a setup for continuing the trade, the SL is triggered.
Scenario 4 (conservative trading):
The price have a setup for continuing the trade, the price touches 1st TP => the trade is closed.
For invites, more details and questions, you can send us a private message.
Enjoy!
Shitcoin Paradise

[Shitcoin Paradise]The MatrixThe Matrix strategy is a strategy developed by @zsone and @edward_Z, that combine multiple indicators and algorithms on various time frames.
*Use it only on 4h charts*
The Matrix is built for multiple currencies/pairs and user friendly.
Features:
- possibility to choose your own crypto currencies
- setup is ready when the square from the Signal tab is green (3 green dots)
- set only 1 alert for the entire script (no need to set one alert for each pair)
- it uses multi time frames for better entries
- it uses multiple confirmations
- it have a safety net (you can set to not buy if the candle is greater than x%)
- can be easily paired with 3commas or other trading platform via webhooks
- it is user friendly, so it's ready to use/plug and play
The Matrix strategy gives setups for entries, after that you can set your own exits (take profit, stop loss, trailing stop...), or you can use our Take Profit + Stop Loss indicator , which is built for The Matrix.
For invites, more details and questions, you can send us a private message.
Enjoy!
Shitcoin Paradise
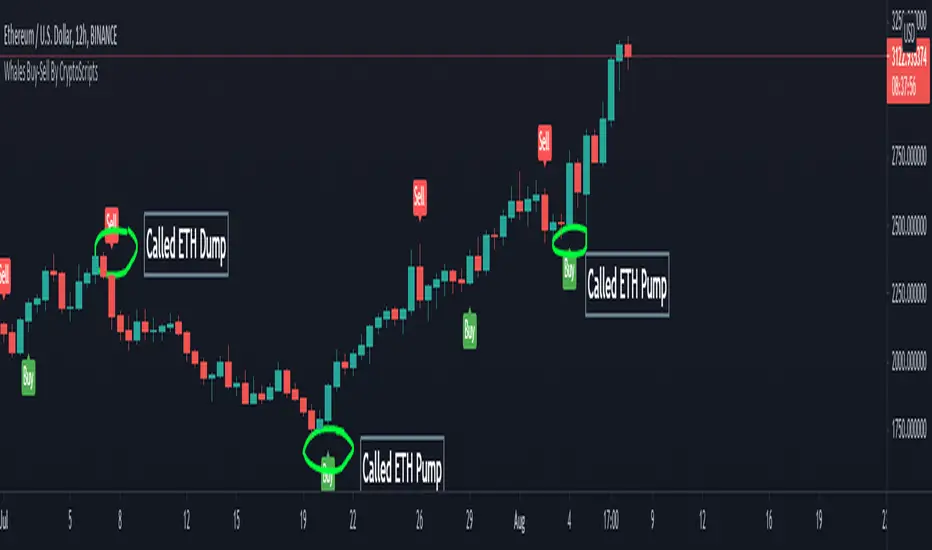
Whales Buy-Sell By CryptoScriptsThe Whales Buy-Sell indicator is very unique because it uses a combination of the smoothing range, average ranges, and hi-band/low-bands combined with various moving averages to nail whenever the overall trend is changing. This is extremely important during periods of high volatility and large moves. It helps to keep someone in a trade longer and get out fast if the trend is changing. The big caveat I can stress is waiting until the candle closes so that you know the signal is confirmed! Use the Bar Replay feature to further understand the intricacies of how the indicator produces signals. I find it is better on larger timeframes (1h and higher) because it's measuring larger trends. It can still be used on smaller timeframes but may not be as accurate. The big shortcoming is that is doesn't do well in choppy environments (i.e barely any price movement up or down) and you may get a lot of back and forth buy/sell signals so PLEASE keep that in mind. Experiment with various tickers/timeframes and see what works best for you :)
This indicator is a trend analysis indicator. Trend analysis is a technique used in technical analysis that attempts to predict future stock price movements based on recently observed trend data. Trend analysis is based on the idea that what has happened in the past gives traders an idea of what will happen in the future, but that is NOT always the case! Past performance is NOT indicative of future returns. There are three main types of trends: short-, intermediate- and long-term. Trend analysis tries to predict a trend, such as a bull market run, and then ride that trend until data suggests a trend reversal, such as a bull-to-bear market.
Alerts
You can set alerts for either a 'Buy Signal' or 'Sell Signal'. I recommend setting alerts for the candle close so that you know the signal is confirmed! If the "Add Alerts" option is greyed out for the indicator, just refresh your tradingview page and you should be able to see it :)
PM me to obtain access and please let me know if you have any questions!
RSVP Extractor By CryptoScriptsThis indicator has the same alerts as the VP Extractor except I overlaid the RSI on top of it (yellow line) to help take advantage when the RSI is overbought/oversold while also being able to see what the VP extractor is saying :)
It highlights yellow any time the RSI is below 30 (potential buy signal) and highlights orange anytime the RSI is above 70 (potential sell signal). You can also adjust the settings so that it'll highlight yellow when RSI is below 25 or 20 etc. so you can pick whatever value you want and the colors will adjust accordingly :) You can also set alerts for RSI overbought/oversold!
Please see the VP Extractor Alerts below! Those are still the same as before but since I now have RSI then you can be more confident in your signals if RSI is flashing a yellow shaded area (oversold) and the VP extractor is flashing a rocket symbol (buy), then both together would be a very strong buy signal. Using the RSI signals with the VP Extractor signals below will make you VERY successful with this indicator :)
The VP Extractor signals is a combination of the Volume Extractor and Price Extractor. There was a lot of coding involved in this one and it involves a Volume / Price Oscillator derived from various volume /price metrics combined with Bollinger Bands and Overbought/Oversold levels. This indicator is unique because it not only measures the standard deviations whenever the oscillator crosses outside the BBs but it does so at ranges that are most advantageous for the trader to identify KEY buy/sell levels (as shown above). I'll break down each signal below and how to best take advantage of them so you can get the best entries and capture the most profit per trade.
*This indicator works best on the Binance or Bybit exchange for crypto but also works for stocks and forex. It's best used on small-medium timeframes such as the 15min, 1h, 4h, 8hr, or 12h. It tends to give more false signals on the 1D timeframes and higher.
Red Alarm - this signal indicates that the volume and/or price oscillators are overbought and/or crossing outside of the bollinger bands . This is a STRONG sell signal but should still be combined with support/resistance levels and confirmed with other indicators.
Red Diamond - this signal indicates that the volume and price oscillators are crossing outside of the bollinger bands above the 20 level but is not yet overbought. This is a potential sell signal but should still be combined with support/resistance levels and confirmed with other indicators.
Red Shaded Area - this indicates the volume and price oscillators are overbought. This is a potential sell signal but should still be combined with support/resistance levels and confirmed with other indicators.
Rocket - this signal indicates that the volume and/or price oscillators are oversold and/or crossing outside of the bollinger bands . This is a STRONG buy signal but should still be combined with support/resistance levels and confirmed with other indicators.
Green Diamond - this signal indicates that the volume and price oscillators are crossing outside of the bollinger bands below the 20 level but is not yet oversold. This is a potential buy signal but should still be combined with support/resistance levels and confirmed with other indicators.
Green Shaded Area - this indicates the volume and price oscillators are oversold. This is a potential buy signal but should still be combined with support/resistance levels and confirmed with other indicators.
Input Options
Show 80 Levels - This checkbox will create a red zone and green zone for the 60-80 levels on the indicator. This is useful if the volume and price oscillators reaches one of these levels, you can be sure it's going to reverse soon and can have more confidence if it crosses outside of the BBs in addition to that.
VEO Length - This changes the height of the oscillator and will change how your signals flash (more or less often). Use this if you find you're getting too many signals or not enough. I find this is best at 21 but feel free to test out what works for you depending on your timeframe.
Moving Average Volume Source - This is currently set to None but you can change it to Exponential, Hull, or Simple moving average . I found that None works best but feel free to test out the different options.
Moving Average Length - Changing this length will do nothing to your chart if None is selected for the Moving Average Volume Source, therefore you will most likely keep this setting default at 9.
Alerts
I've set alerts on this indicator for each icon (Red Alarm, Red Diamond, Overbought, Rocket, Green Diamond, Oversold). I HIGHLY recommend setting the alerts for Candle Close so that you can be sure the signal is confirmed.
You may notice that the indicator can give multiple signals back-to-back or be overbought/oversold for multiple candles. When this happens, it's best to look at other indicators such as the RSI , MFI Pro, etc to nail the best entry and have confluence with your decision. With that said, having multiple signals back-to-back can also be an indication that the move is close to happening.
This indicator is a strong indicator by itself but works best when combined with my other indicators just as the Whales Buy-Sell and the MFI Pro as well as the RSI , and MACD i.e taking a trade when all indicators are showing overbought, "Buy", "Sell", etc. Measuring volume and price action is an extremely important aspect of trading and one I believe should not be overlooked. I hope I made everything as clear as possible and please let me know if I didn't.
PM me to obtain access and please let me know if you have any questions! :D

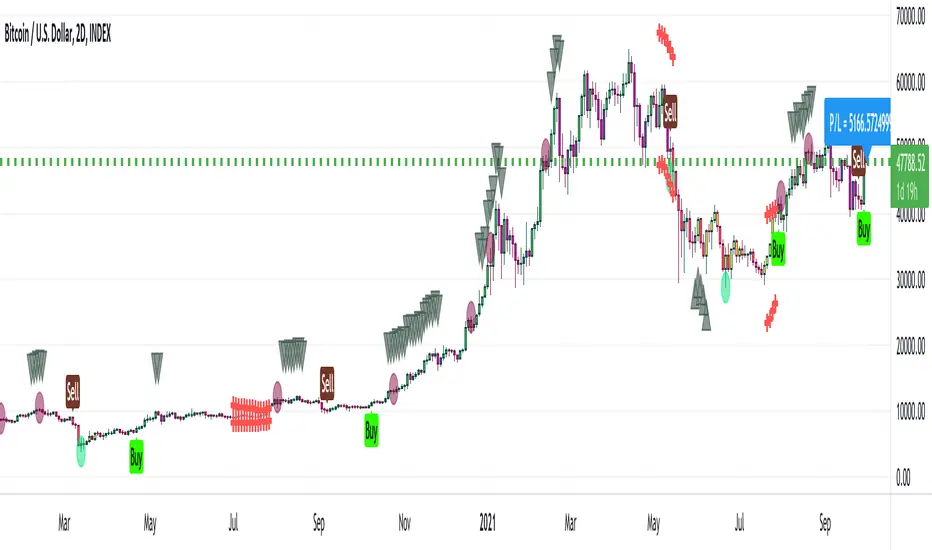
[Joy] Aladdin (1.0.0 Alpha)Explanation of the markers in the indicator
* Bearish / Sell sign: On the candle's close, I open a short position
* Bullish sign: On the candle's close, I open a long position
* Red circle: On the candle's close, I take at least 50% unrealized profit into a realized profit of any running long leverage position. I might even convert some portion of the position into stable coins.
* Green circle: On the candle's close, I take at least 50% unrealized profit into a realized profit of any running short leverage position. I might even convert some portion of the position into stable coins.
* Down Arrows: When the down arrow finishes and the candle close, I put a tighter stop loss of any running long leverage position. It sometimes indicates the local top.
* Up Arrows: When the up arrow finishes and the candle close, I put a tighter stop loss of any running short leverage position. It sometimes indicates the local bottom.
* Purple candle: Weakly bullish.
* Green candle: Strongly bullish
* Red candle: Strongly bearish
* Yellow candle: Weakly bearish
FAQ
Q: Does it use some EMA /MA/etc.? Does it use any indicator with tweaked settings?
Answer: No.
Q: What does it mostly depend on?
Answer: Volume and gradual flow of non-interrupted data. The logic depends purely on volume, price bars and the wicks.
Q: Does it work with all coins, stocks, futures, instruments?
Answer: I prefer to use the exchange with the best possible data. Then backtest out to find the best possible timeframe, stop loss and target all derived from this script data.
Q: Can you make it free or make it open source?
Answer: There is no free lunch in this world. I will never reveal or share the source code!
Q: Do you provide ongoing support for the indicator?
Answer: Yes, as long as I can, I will continue updating the indicator
Q: Are the bullish /buy & the bearish /sell markers automatic?
Answer: I have no control over the markers. It is driven purely by logic from the script.
Q: Is this financial advice?
Answer: This is not financial advice. I do not guarantee any profit or loss. I am not responsible for any of your losses or profits. My indicators do not assure profit or loss. It also does not auto-open or auto-close a trade.
Note:
The Aladdin has been derived from the Super Algorithm Indicator. I have depreciated the Super Algorithm Indicator I have automatically migrated every user to Aladdin, who had Super Algorithm Indicator. One should not use the SA indicator. One should start using this indicator instead.
Version 1
A derived version of Super Algorithm Indicator with optimized code (uses arrays, removes few warnings in the code, makes code more reusable) so that I can add further features in the future. A few new coding features in the pine script encouraged me to go for this version. Since the codebase has been revamped, it made sense for me to make it a new indicator. have also changed a small parameter that is configurable at the moment. Previously it was valued at 26. Now I am putting value at 21.
Aggregated Volume Colored (Bitcoin, ETH, Altcoins, everything)BITSTAMP:BTCUSD
This indicator aggregates trading volume data of up to 10 symbols and can display the individual data by color.
It is useful for assets which are traded on multiple exchanges, like cryptocurrencies, commodities, forex and derivatives showing you what is happening across the market and on the individual exchanges to give you beter insights.
You can change the symbols from which the indicator gathers data in the settings under inputs, just like the colors, and you can add a moving average.
By default trading volume is aggregated from the following symbols:
Binance, BTC /USDT
Binance, BTC /BUSD
Bingbon, BTC /USD
Huobi, BTC /USDT
OkeX, BTC /USDT
Coinbase, BTC /USD
Bitfinex, BTC /USD
Gemini, BTC /USD
Kraken, XBT/USD
Bitstamp, BTC /USD

Compare Crypto Bollinger Bands//This is not financial advice, I am not a financial advisor.
//What are volatility tokens?
//Volatility tokens are ERC-20 tokens that aim to track the implied volatility of crypto markets.
//Volatility tokens get their exposure to an asset’s implied volatility using FTX MOVE contracts.
//There are currently two volatility tokens: BVOL and IBVOL.
//BVOL targets tracking the daily returns of being 1x long the implied volatility of BTC
//IBVOL targets tracking the daily returns of being 1x short the implied volatility of BTC.
/////////////////////////////////////////////////////////////////
CAN USE ON ANY CRYPTO CHART AS BINANCE:BTCUSD is still the most dominant crypto, positive volatility for BTC is positive for all.
/////////////////////////////////////////////////////////////////
//The Code.
//The blue line (ChartLine) is the current chart plotted on in Bollinger
//The red line (BVOLLine) plots the implied volatility of BTC
//The green line (IBVOLLine) plot the inverse implied volatility of BTC
//The orange line (TOTALLine) plots how well the crypto market is performing on the Bolling scale. The higher the number the better.
//There are 2 horizontal lines, 0.40 at the bottom & 0.60 at the top
/////////To Buy
//1. The blue line (ChartLine) must be higher than the green line (IBVOLLine)
//2. The green line (IBVOLLine) must be higher than the red line (BVOLLine)
//3. The red line (BVOLLine) must be less than 0.40 // This also acts as a trendsetter
//4. The orange line (TOTALLine) MUST be greater than the red line. This means that the crypto market is positive.
//5.IF THE BLUE LINE (ChartLine) IS GREATER THAN THE ORANGE LINE (TOTALLine) IT MEANS YOUR CRYPTO IS OUTPERFOMING THE MARKET {good for short term explosive bars}
//6. If the orange line (TOTALLine) is higher than your current chart, say BTCUSD. And BTC is going up to. It just means BTC is going up slowly. it's fine as long as they are moving in the same position.
//5. I use this on the 4hr, 1D, 1W timeframes
///////To Exit
//1.If the blue line (ChartLine) crosses under the green line (IBVOLLine) exit{ works best on 4hr,1D, 1W to avoid fakes}
//2.If the red line crosses over the green line when long. {close positions, or watch positions} It means negative volatility is wining

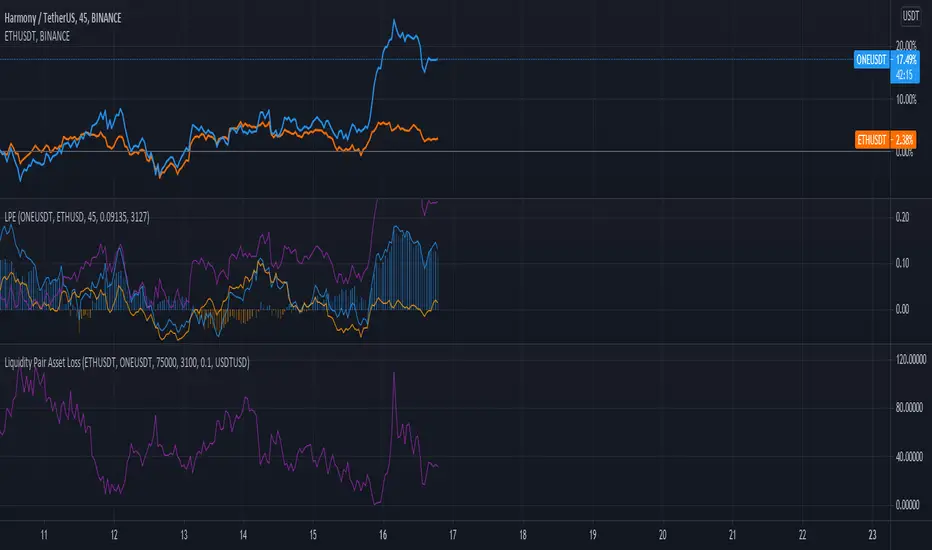
Liquidity Pair Impermanent Asset LossWith limited tracking of impermanent loss for liquidity pairs across all chains, I wanted a very simple display of live dollar value loss in an asset pair. This should allow you to set alerts based on how much you are down and take action if needed. The output column is by default set to show your losses in USD. For those that need it, I also setup an option to track the output in something other than USDT, e.g., GBP or ETH, etc..
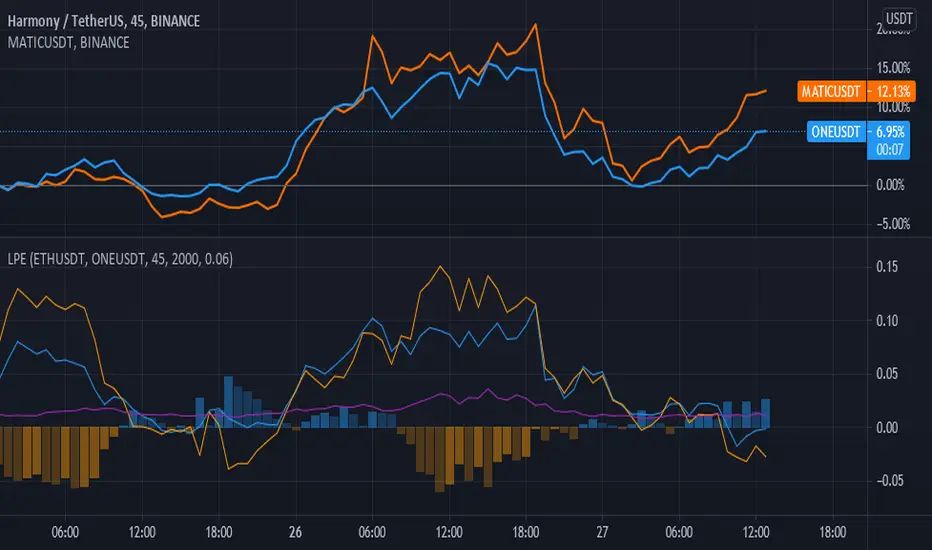
Liquidity Pair EvalWhile there are many tools for generating your impermanent loss in liquidity pools, depending on your choice of chain, I was mostly concerned about monitoring the creep between the pairs. This V0.1 attempt should give us a general comparison of the selected asset returns given your time period and also display the percent loss assuming the initial purchase price values are input correctly.
This is a work in progress and I am open to suggestions to make this even better.
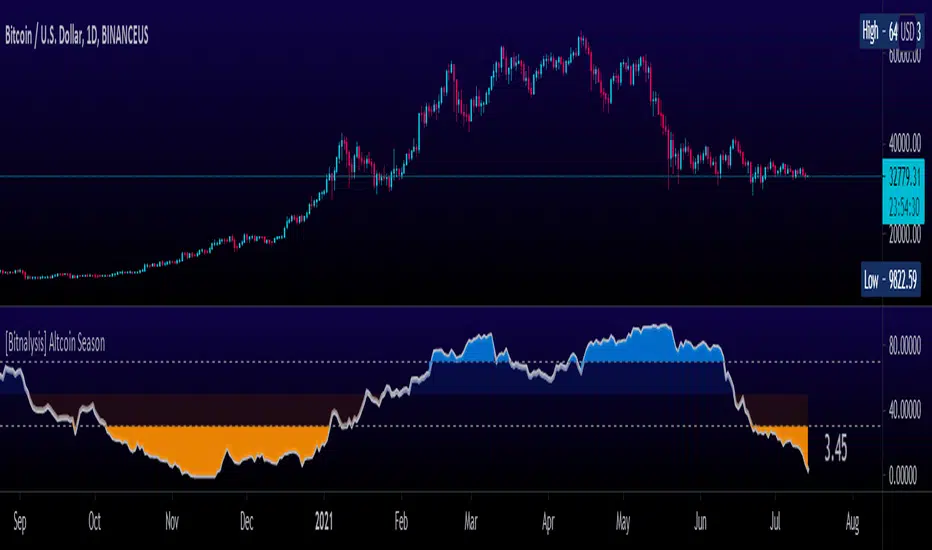
[Bitnalysis] Altcoin Season IndicatorThe Altcoin Season Indicator compares performance of Bitcoin with the performance of the top altcoins over a specified period. The indicator weights the results, giving greater weight to the first specified altcoins. By default, the larger market cap altcoins, such as ETH, BNB, ADA, etc., are included first and therefore given greater weight in the algorithm. To remove the weighting from the formula and consider the performance of all listed altcoins equally, set the weighting setting to "0".
The output shows to what extent altcoins are outperforming Bitcoin; the higher the number, the more altcoins are outperforming Bitcoin. This indicator helps traders predict when "altcoin season" is about to begin or end.
MacroCorrelation (Bitcoin Real Value)The best minds in the financial world think about how to determine the real value of an asset.
I constantly say that it is necessary to buy an asset only at the moment when its market price is below or equal to its fundamental value. Let's see what is the difference between these two concepts.
Fundamental value
Imagine that we decided to grow and sell, for example, strawberries. For this, we purchased the necessary equipment, tools, fertilizers, seeds, and more. Let's say that we needed $ 3000 for this purpose.
To facilitate the task, in our calculation we will not take into account all types of possible costs (electricity cost, workers' wages, necessary tax deductions, etc.).
If we had to take a loan to meet the initial needs, for example, at 10% per annum , then each borrowed $ 1000 in a year would cost us $ 1100. That is, $ 3000 would cost us $ 3300 per year.
Let's agree that our initial funds were completely enough to buy everything we needed, and we didn't need to take out a loan at a certain percentage. In this case, we exclude from the calculation the cost of the capital required to start your own business.
Suppose we managed to harvest 100 kg of strawberries. This means that the real value (fundamental value) of 1 kg of our strawberries is $ 30.
Market price
Things are a little different with the market price. The market price is determined by the volume of supply and demand for a particular product or service at a particular point in time.
By demand, we mean the intention to purchase a product or service (secured by the ability to pay a set price for it). A need that exceeds solvency is not a demand.
By offer, we mean the willingness to provide ownership (use) of the object of demand for a certain fee.
Simply put, the market price is the price at which the buyer is willing to buy (and the seller to sell) the volume of goods we need.
In our case, the price at which we sell 1 kg of our strawberries will depend on how much people really need our strawberries.
If we are the only sellers of strawberries in a certain territory and, at the same time, buyers really want to taste fresh strawberries, its market price can be as high as the last buyer is able to pay. If not, everything will depend on how high quality our product will be for its price. At the same time, the price constantly varies over a certain period of time ( seasonality and other factors). For example, if in winter we could sell 1 kg of our strawberries for $ 90, then in summer for $ 50. Strawberry prices range from $ 50 to $ 90.
Magic formula
We now understand what is the difference between fundamental value and market price. If the first is made up exclusively of a set of real metrics, the second is a variable factor that depends primarily on “human factors” (what is the maximum price the buyer is willing to pay, what is the minimum price the seller is willing to set at a particular moment in time).
You should try to buy an asset only at the moment when its market price is below or equal to its fundamental value.
However, how can you independently determine the fundamental value of an asset?
Unfortunately, there is no universal answer to this question, just as there is no universal “magic formula” in nature (my sincere respect, Joel Greenblatt) that could determine the fundamental value of any asset on the planet. The point is precisely in the criterion of universality. If we consider each asset (or at least the market) separately, we can well determine its fundamental value.
Even those things that seem free to us in everyday life (just their cost are negligible) have a fundamental value.
Three factors to assess the fundamental value of Bitcoin
Let's try to take a separate asset, for example Bitcoin , and do with it everything that we did earlier with our “strawberry business”.
When assessing the real (fundamental) value of Bitcoin , we will take into account 3 main factors.
1. The maximum possible and current supply in the Bitcoin market
The reward for mining a Bitcoin block is halved every 210,000 blocks. This fact is called halving (halving). When all blocks are mined, the total amount of existing bitcoins will be 21 million coins.
Accordingly, the maximum supply in the Bitcoin network will not exceed 21 million coins.
In reality, things are even better, since this volume also includes a certain amount of lost coins. By lost, we mean all those coins whose “private keys” the last owner no longer has access to. For example, at the time of the appearance of Bitcoin in 2009, its real value was doubtful and not obvious to most of its owners, many of whom did not pay due attention to understanding the safe storage of an asset, periodically losing access to hundreds and thousands of coins.
As a result, we understand that the total supply in the Bitcoin market will be significantly less than 21 million coins.
To evaluate the proposal, it is not enough to understand how much of the asset exists, because a certain amount of it, as we have already understood, can either be lost or be blocked for a long time. It is also important to take into account the criterion of “supply in time”. That is, the current total “liquidity” of the network.
2. Bitcoin network hashrate
The main indicator of the viability and stability of the Bitcoin network is the hash rate (computing power). Stable hashrate = network security.
3. The real value of the US dollar
When analyzing the Bitcoin / Dollar pair, in addition to the real value of Bitcoin , it is also necessary to take into account the real value of the US Dollar .
It is believed that assets such as stocks or cryptocurrencies are extremely volatile (the price can change over a wide range within a relatively short period of time). At the same time, to reduce volatility , experts advise using the so-called “currency baskets”.
A currency basket is a certain percentage of foreign currencies in which the investor's capital can be distributed. The ratio of currency units in the basket is used to reduce the potential risk of currency fluctuations.
The main problem is that, due to inflation , the purchasing power of the currencies themselves drops significantly over time.
With the $ 100 we earned in 1913, already in the 1920s we could have purchased 50% fewer goods and services than before. In the 1980s, it was 90% less, and in the 2010s it was already 98% less.
This fact must also be taken into account when assessing the real value of Bitcoin , since everything is relative, and in the Bitcoin / Dollar pair, we determine the value of Bitcoin , expressed in US dollars.
The real value of Bitcoin
After assessing the relationship of the factors described above and drawing up a mathematical formula, we can proceed to the analysis of the results. In order to cut off unnecessary noise when constructing the function, we will use the graph for 1 month.
Analyzing the resulting chart, first of all, the following is striking: the fundamental value of Bitcoin grows over time. This is due to the gradual expansion of the "user base" of the network, as well as the growth of its popularity among investors of completely different classes.
I propose to compare the graph obtained earlier with the graph of Internet users (in% of the number of adult US citizens ). Similar, don't they?
The more the number of Internet users, the higher its influence and economic potential. The more the number of users of the Bitcoin network, the higher its economic potential and fundamental value.
However, understanding the fundamental value alone is not enough. We, as investors, first of all need to understand when to buy any asset.
To do this, compare the chart of the market price of Bitcoin with the chart of its fundamental value obtained earlier.
Now that we have a complete picture of what is happening and understand both the fundamental value of the asset and its market price, the fact of the numerical prevalence of the price over the fundamental value for 116 out of 133 months becomes quite clear. Periods of Bitcoin being below its fundamental value are extremely rare and only take ~ 13% of the trading time.
For about 87% of all trading time, Bitcoin's market price is above its fundamental value. Those rare periods when traders are willing to sell bitcoin below its fundamental value are an incredible gift for a long-term investor.
Bull and Bear Markets
If you buy Bitcoin (like any other asset) below its fundamental value, this is an absolutely incredible idea in terms of potential profitability, who in their right mind would sell their assets below this mark ?!
It's all about the emotionality of people. Saying “I will not do stupid things when the time is right” is easier than actually maintaining composure. Especially when it comes to money. Your money. And sometimes even dreams.
The classical market theory usually divides the market into two main phases: A bull market is a period of time during which the price rises systematically (accordingly, the demands and expectations of traders gradually grow). A bear market is a period of time during which the price gradually falls (accordingly, traders' requests and expectations gradually fall).
There is also the concept of “correction”: A correction is a temporary change in the price of an asset, contrary to the main trend.
For the current day, there is not a single clear criterion that separates the concept of a bear / bull market from the concept of a correction. However, we can say with confidence that the market change (from bullish to bearish or from bearish to bullish ) is interconnected with the fundamental factors of the market. Corrections, on the other hand, have significantly less connection with fundamental indicators.
and are rather related to the “physiology of the market” (nothing can only rise in price every unit of time for a significantly long time, nothing can only fall in price every unit of time for a significantly long time).
In this case, the most rational would be to define a bear market as a delay in updating the absolute historical highs of the price with a preliminary touch of the fundamental value.
Buying below the fundamental value is always a smarter idea than buying above the fundamental value, since, in most cases, it is the touch of the fundamental value that globally separates a bear and a bull market.
Fun fact: If we were to buy Bitcoin every time it touched the fundamental value, the average buy price as of July 2021 would be $ 1,506.65, which is 87% less than the current fundamental value of Bitcoin .
Conclusions
1. The total amount of Bitcoins , as well as the speed of their production (mining) over time, are programmatically limited, which limits the volume of the maximum possible supply
2. Bitcoin is transported, which means that the volume of supply for the current minute will also depend on the actual volume of assets available for sale
3. The viability of the network is based on the amount of computer power supporting it (network hash rate)
4. When analyzing the Bitcoin / Dollar pair, in addition to the real value of Bitcoin , it is also necessary to take into account the real value of the US Dollar
5. Price ≠ fundamental value
6. Buying below the fundamental is always a smarter idea than buying above the fundamental.
7. Don't believe the headlines of financial news and the public words of financiers
8. Selling strawberries can make a fortune too

Value Area OscillatorThis is an oscillator version of the Value Area Indicator. The Value Area Indicator employs a custom, volatility-weighted moving average formula, which produces a moving average that becomes more reactive during volatile periods. The indicator then provides fibonacci channels above and below the main MA line. The fibonacci channels are sized based on the "golden ratio." This indicator may be helpful to show when the particular cryptocurrency or other instrument is oversold or overbought. If you are looking to add to your position, this indicator can help determine the best times to do so.

Value Area IndicatorThe Value Area Indicator employs a custom, volatility-weighted moving average formula, which produces a moving average that becomes more reactive during volatile periods. The indicator then provides fibonacci channels above and below the main MA line. The fibonacci channels are sized based on the "golden ratio." This indicator may be helpful to show when the particular cryptocurrency or other instrument is oversold or overbought. If you are looking to add to your position, this indicator can help determine the best times to do so.

Quantum Cryptocurrency Strength Indicator (CCSI)Exciting new markets require exciting new indicators and with the plethora of cryptocurrencies now available and increasingly being offered through mainstream brokers, at Quantum Trading we thought it was time for us to step in and develop something unique to help traders and investors trading the new kids on the block.
Cryptocurrencies like their more established cousins in forex, are in a constant state of flux moving from overbought to oversold and back again, but at a much faster pace, and generally associated with volatility. The challenge of course is picking those phases of price action where these conditions have been met and so offering the trader two opportunities. Either to take a position ahead of any reversal and so get in early before the trend develops, or alternatively to wait until the trend is underway and then jump in. You can think of this as a train in the station. Do you board early before it leaves, or jump aboard once it is underway? Both approaches have advantages and disadvantages, but the choice is yours.
So, our development team set to work to deliver the perfect indicator to deliver this information for you visually and quickly, and we are proud to announce the Cryptocurrency Strength Indicator or the CCSI for short. And if you thought this looks similar to its hugely popular currency strength indicator for forex then you would be right.
This indicator is of course a little different, though the principles of how to use it can be considered the same. So how does it work? Well, first of all, here we are dealing with a cryptocurrency pair, rather than isolating out the currency itself, as every cryptocurrency is quoted against the USD in some way. In these markets we are seeing the movement of the cryptocurrency against the US dollar and in developing the indicator we have chosen to display this against Tether. In other words, USDT.
The indicator displays seven of the most popular cryptocurrencies against the USDT, but what we have also included in the design is the option to deselect these and select others of your choice, so you have complete control of those cryptocurrencies you wish to trade. In addition, we understand that alerts are a hugely popular function of the TradingView platform, so we have added these in these also. And of course, as you would expect we have included the option to isolate out those of interest. So how do we use the indicator?
First, as you might expect, the cryptocurrency market tends to move ‘en mass’ – in other words generally either moving higher or lower together. You can think of this as an equivalent to the currency matrix in forex, where currencies of one denomination, such as the yen will all move in the same direction if the yen is being bought or sold universally. It is the same here. On occasion, on the faster timeframes, one does see divergence, but as a general rule, they will all tend to move together which is great as it gives you the confidence you are trading in the direction of the entire market. What is important however is the direction of the USDT. This will ALWAYS be in the opposite direction which is why we isolate it out from the others, to reveal precisely how this is moving. Remember, what drives a strong trend is when one currency is rising and another falling in forex and it is exactly the same here. When the USDT is rising strongly and the cryptocurrencies are falling, then a strong trend is underway. Equally, if the USDT is falling strongly then you will see a strong trend in your chosen cryptocurrency.
Next, we look for overbought and oversold opportunities in precisely the same way as for the currency strength indicator. Cryptocurrencies are in a constant state of flux moving from oversold to overbought and back again in all timeframes so there are always plenty of opportunities to employ this tactic and get in early at the start of a new trend. The angle of inclination of the line reveals the strength of the move, but equally, if the cryptocurrencies are moving sideways along with the USDT then we have to wait and be patient. But the beauty of this market is that it genuinely trades twenty-four hours a day, and seven days a week. Trend trading is another great tactic and as soon as the move is underway you can jump on the moving train and join a current trend and with cryptocurrencies, you don’t normally have to wait long as the price action is constant.
However, don’t just think of the Cryptocurrency Strength Indicator as a tool for simply getting you in. It will also help you to stay in and get out at the right time. After all if it’s good enough to get you in then it’s good enough to keep you in also. But remember, when the lines are moving sideways along with the USDT, then it’s a question of being patient and waiting. In other words, it helps to keep you out too.
The indicator works in all timeframes on the TradingView platform from seconds and upwards, so all trading approaches and tactics are catered for with this indicator. It can be used with any instrument whether through a conventional broker or for trading binary options which are extremely popular, and of course cryptocurrency futures too.

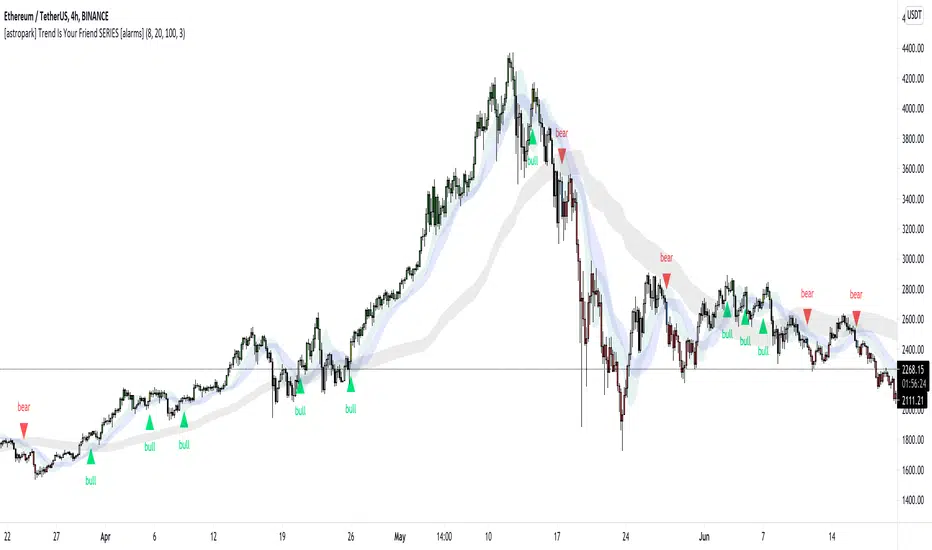
[astropark] Trend Is Your Friend SERIES [alarms]Dear Followers,
today I'm glad to present you an indicator which is a mix of three indicators of mine: Trend Is Your Friend Series !
As you may easily understand from the name, this indicator incorporates all 3 Trend is You Friend indicators I made in past.
This way you can control all of them just with one indicator.
Of course this comes with some useful integration features:
a bull green triangle appears when all trends are bullish (you can set an alert for this)
a bear purple triangle appears when all trends are bearish (you can set an alert for this)
bar coloring reflects the bullish/bearish integration too
you have an option to enable/disable all trends buy/sell signals
you have an option to hide trend clouds borders (chart will be way cleaner this way)
you can still customize each trend indicator settings and set alerts on each trend individually
you can enable/disable heikin ashi analysis
As per Trend is Your Friend V1/V2/V3, this indicator is for higher timeframe trading, from 4h and above is suggested.
This indicator is pretty good for both Swing and Scalping , you can run it over a bot or use it on Renko chart!
If you are a scalper, you will love suggested entries for fast profit. You can run it on 1h timeframe in this case (below is not suggested, there is "no-trend" below 1h!). If you are used to scalp trading, be sure to close each trade whenever you feel happy (a proper trailing stop strategy is suggested for example).
As I always say, all tools are great if you use them correctly: this is not the "Holy Grail", so always use proper money and risk management strategies.
For your reference, here you can see original basic indicators that were integrated here:
V1 backtesting strategy
V2 backtesting strategy
V3 backtesting strategy
This is a premium indicator , so send me a private message in order to get access to this script.