Market Sector Scanner/Screener With MOM + RSI + MFI + DMI + MACDMARKET SECTOR SCANNER/SCREENER MOM + RSI + MFI + DMI + MACD FOR STOCKS CRYPTO & FOREX
This script scans 9 markets constantly and returns the values of 5 different popular indicators.
This indicator helps you see when one of your favorite stocks is bullish or bearish when you are not watching that chart so you can always catch the big moves as they happen.
***HOW TO USE***
A great way to use this market screener is to set up separate chart layouts for each sector you like to trade. Such as the top 9 stocks in the S & P 500, top 9 stocks in the XLF etf, etc. Make sure to set up separate chart layouts in Tradingview so you don’t have to change the symbols constantly. This will give you a good idea in real time if that entire sector is bullish, bearish or mixed. When the entire grid goes red or green, those are very strong signs of market direction across that entire sector, so trades in the corresponding direction are quite safe.
This can be done for crypto as well, using the top 9 cryptocurrencies by market cap. Watch the grid and wait for the entire lot to turn green or red and then take a position in that direction.
You can also use this with a variety of your favorite tickers so you can see when specific markets are looking strong in either direction, instead of constantly changing charts or missing good opportunities because you weren’t watching that specific chart.
This grid can also be used to determine how long to hold a position as well. If the entire grid is still green or red, according to your trade direction, you can usually expect price to continue in that direction until you see some conflicting colors start to pop up on the grid. As it starts to give mixed signals, you can expect the market to be indecisive or reverse which is a good time to get out.
If you have your scanner setup to show similar markets in one sector, be careful taking trades when the grid is very mixed in color. This shows signs of indecision and will likely have choppy price action until the market decides a direction so make sure to use caution when the grid is mixed. It is best to wait for the entire grid to turn green or red and then take position.
***COLOR MEANINGS***
When each indicator value is in bullish territory, the background of that value will turn green.
When each indicator value is in bearish territory, the background of that value will turn red.
When each indicator value is in neutral territory, the background of that value will turn blue.
When all 5 indicators for a ticker are bullish, the ticker background will turn green.
When all 5 indicators for a ticker are bearish, the ticker background will turn red.
When there is a mixture of bullish and bearish values, the ticker background will turn blue.
***CUSTOMIZATION***
You can customize which tickers are in your scanner including stocks, crypto, futures and forex, the source of the indicators, the length of the indicator settings and the smoothing parameters.
***INDICATORS USED***
The indicators used for each ticker are as follows:
Momentum(MOM) - Default length is 14. Bullish is above zero, bearish is below zero.
Relative Strength Index(RSI) - Default length is 14. Bullish is above 50, bearish is below 50.
Money Flow Index(MFI) - Default length is 14. Bullish is above 50, bearish is below 50.
Directional Movement Index(DMI) - Default length is 14 and smoothing is 14. Calculated by subtracting di minus from di plus. If the value is positive, it is bullish. If the value is negative, it is bearish.
Moving Average Convergence & Divergence(MACD) - Default settings are 12, 26, 9. If the short line is greater than the long line, then it is bullish. If the short line is less than the long line, it is bearish.
***MARKETS***
This market scanner can be used as a signal on all markets, including stocks, crypto, futures and forex.
***TIMEFRAMES***
This scanner can be used on all timeframes and pulls data from other tickers using the same timeframe as what your current chart is set to.
***TIPS***
Try using numerous indicators of ours on your chart so you can instantly see the bullish or bearish trend of multiple indicators in real time without having to analyze the data. Some of our favorites are Trend Friend Scalp & Swing Signals, Auto Fibonacci, Directional Movement Index, Volume Profile With Buy/Sell Pressure, Auto Support And Resistance and Money Flow Index in combination with this Scanner. They all have real time Bullish and Bearish labels as well so you can immediately understand each indicator's trend.
Cryptoscreener

Crypto Volume/Strength ComparatorHello Traders,
Here is an attempt to perform comparative analysis between top cryptos based on strength (oscillator) and volume. Methodology used here is similar to Magic Number formula described in the post : Enhanced Magic Formula for fundamental analysis . But, instead of using fundamentals, we are making use of few technicals to derive similar outcome. Usage of the available stats will not be same as Magic number since we are using technicals.
⬜ Process
▶ Get crypto exchange based on prefix of instrument being used.
▶ For the given exchange, get data for all the tickers available in input fields.
▶ Calculate Oscillator, Momentum based on price for each tickers.
▶ Calculate Oscillator, Momentum based on volume for each tickers.
▶ Calculate Volatility for each tickers.
▶ Rank Price-Oscillator, Price-Momentum, Volume-Oscillator, Volume-Momentum, Volatility for each tickers.
▶ Calculate combined rank by adding up individual ranks.
▶ Calculate movement of rankings from bar to bar
▶ Sort tickers based on rank and populate them on table. Display direction of rankings.
⬜ Components
Display components are as follows:
⬜ Settings
Settings are pretty simple and straightforward
⬜ Calculations
▶ Oscillators : High values of oscillators are considered as ideal as the process is intended towards finding trend.
▶ Momentum : Momentum is calculated on the basis of Squeeze Momentum Indicator by @LazyBear.
▶ Volatility : Volatility is calculated on the basis of Williams Vix Fix by @ChrisMoody. Here too since we are in trend following mode, lower vix fix is considered ideal.
⬜ Few Notes
Tickers will show data only if selected exchange has them. Some tickers are not available in all exchanges. In that case, it will show NAN. This is kind of unavoidable as we need to have fixed size arrays for any calculations.
Indicator works only on crypto tickers which has valid exchange.
Tickers move through the rankings in real time. Background of all stats are based on gradient from green to red.
Tickers on top may not always have better long opportunity or tickers at bottom may not always be optimal for shorting. We need to consider how long the instrument may stay in the position or how fast it is moving in opposite direction. Hence, directions of the ranking movement are also shown on the table.

Multiple Indicators ScreenerA screener for multiple indicators with nice table output.
I was asked many times to update custom screener to display results in a table form. This way it looks much better.
You can play with background colors depend on values you're looking for.
In the screener, for example, I'm highlighting overbought/oversold RSI values, big ADX levels and trend of the Supertrend.
In parameters you can change settings for all indicators and change/disable tickers if 40 is too many for you.
There is only 1 function that calculates all these indicators. Potentially you can change and even add more indicators to this function.
Writing code for these kind of screener is a bit time consuming, so I even created a code generator in Python for these kind of indicators :) .
Disclaimer
Please remember that past performance may not be indicative of future results.
Due to various factors, including changing market conditions, the strategy may no longer perform as well as in historical backtesting.
This post and the script don’t provide any financial advice.

Multiple Screeners with AlertsI already published few version of my custom screeners. Unfortunately, because of TradingView's security function call limit you can't use more than 40 stocks in 1 screener.
Fortunately, you can compute multiple values in your function and screen few indicators at once.
In this script I show how you can compute 5 indicators at the same time for 40 instruments. I display then in different labels.
Every label consist of list of instruments satisfying current indicator conditions and a value for it. It can be absolute value as for RSI or -1/1 representing Bullish/Bearish event.
Also you can create 1 alert with result of all screeners inside.
In this example I took 5 indicators with following conditions:
RSI - "RSI < 30" or "RSI > 70"
TSI - "TSI < -30" or "RSI >30"
ADX - "ADX > 40"
MACD - "MACD Bullish Cross" or "MACD Bearish Cross" (1 and -1 in screener)
AO - "AO Crosses 0 UP" or "AO Crosses 0 DOWN" (1 and -1 in screener)
Params
- bars_apart - this parameter define how may bars apart you labels are on your chart. If you see labels overlapping, increase this number.
- Parameters for all used indicators
- 40 symbol inputs for instruments you want to use in this screener
Alerts
You can create an alert from it easily by selecting screener name from the list and then selecting "Any alert() function call".
No additional configuration is required, message and alert on close is generated in the code.
You should better change default name for your alert. Sometimes because of big amount of inputs you might receive an error.
Disclaimer
Please remember that past performance may not be indicative of future results.
Due to various factors, including changing market conditions, the strategy may no longer perform as good as in historical backtesting.
This post and the script don’t provide any financial advice.

Screener Outside BarsBased on the teachings of Rob Smith
1= Inside Candle
2= Goes past the previous candle's price up or down
3= Goes past the previous candle's price on both sides
Outside Bar (3) is a bar that has broken the price of both sides of the previous bar.
Ability to change the timeframe and the symbols this indicator is scanning through in the input tab under settings of this indicator. Maximum symbols 40.
Looking for outside bars within 40 symbols. By default some symbols are entered in the indicator already. They cannot be left empty. If left empty, the script might not work properly.
By changing the timeframe, outside bars can be looked under many timeframes like Monthly, Weekly, Dialy, Intraday, etc.
First label is for all of the symbols the indicator is scanning.
Second label is the result of the scan. Text is bigger than in this label than the first label to differentiate from the first label and for ease of use.
Please DM me on how to access this indicator.

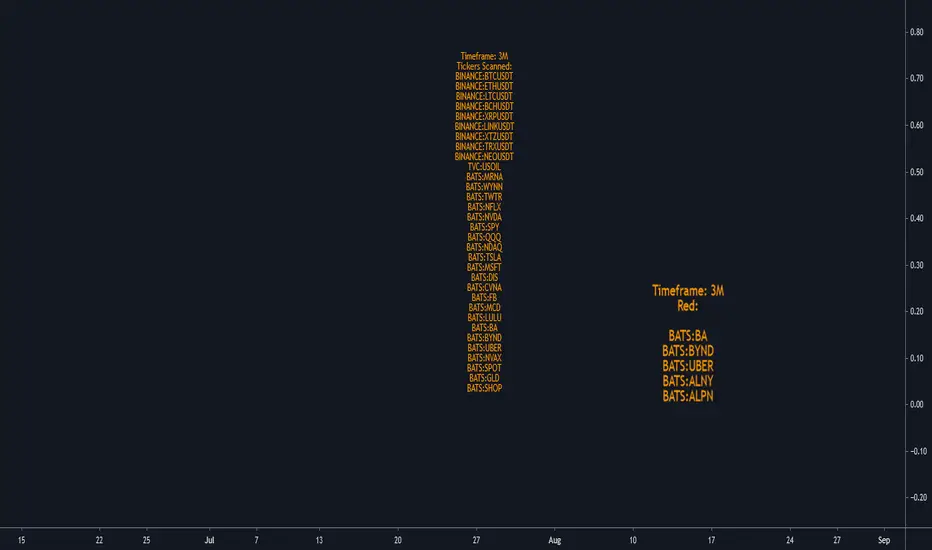
Screener Red?Based on the teachings of Rob Smith
Ability to change the timeframe and the symbols this indicator is scanning through in the input tab under settings of this indicator. Maximum symbols 40. All of the symbols need to entered. If any symbol field is left empty, the script might not work properly.
This is a simple screener which checks if the current candle is red/going down.
I add it 4 times and change the timeframes on each one to tell me if any of the symbols scanning through have FTFC(Full time frame continuity). If a symbol appears in all of the timeframes selected, it would have continuity in all of those timeframes. Meaning going down in all of those selected timeframes.
I like to add a textbox on top of the labels manually when I change the timeframe to tell me which timeframe the indicator is scanning through.
Always double check in the settings of the indicator that the correct timeframe is selected.
First label is for all of the symbols the indicator is scanning.
Second label is the result of the scan. Text is bigger in this label than the first label to differentiate from the first label and for ease of use.
Please DM me on how to access this indicator.
Screener Potential 312 / 212 / 122Based on the teachings of Rob Smith
1= Inside Candle
2= Goes past the previous candle's price up or down
3= Goes past the previous candle's price on both sides
Ability to change the timeframe and the symbols this indicator is scanning through in the input tab under settings of this indicator. Maximum symbols 40.
Looking for short or long setups within 40 symbols. By default some symbols are entered in the indicator already. They cannot be left empty. If left empty, an error comes up and the script doesn't load.
The reversal setups this indicator is looking for
212
312
122
Can look through many timeframes like monthly, weekly, daily, intraday by changing the timeframe in the input tab under settings.
Default timeframe is set to 1 Day.
First label is for all of the symbols the indicator is scanning.
Second label is the result of the scan. Text is bigger than in this label than the first label to differentiate from the first label and for ease of use.
Please DM me on how to access this indicator.

Screener Inside BarsBased on the teachings of Rob Smith
1= Inside Candle
2= Goes past the previous candle's price up or down
3= Goes past the previous candle's price on both sides
Ability to change the timeframe and the symbols this indicator is scanning through in the input tab under settings of this indicator. Maximum symbols 40.
Looking for inside bars within 40 symbols. By default some symbols are entered in the indicator already. They cannot be left empty. If left empty, an error comes up and the script doesn't load.
By changing the timeframe, inside bars can be looked under many timeframes like Monthly, Weekly, Dialy, Intraday, etc.
First label is for all of the symbols the indicator is scanning.
Second label is the result of the scan. Text is bigger than in this label than the first label to differentiate from the first label and for ease of use.
Please DM me on how to access this indicator.
