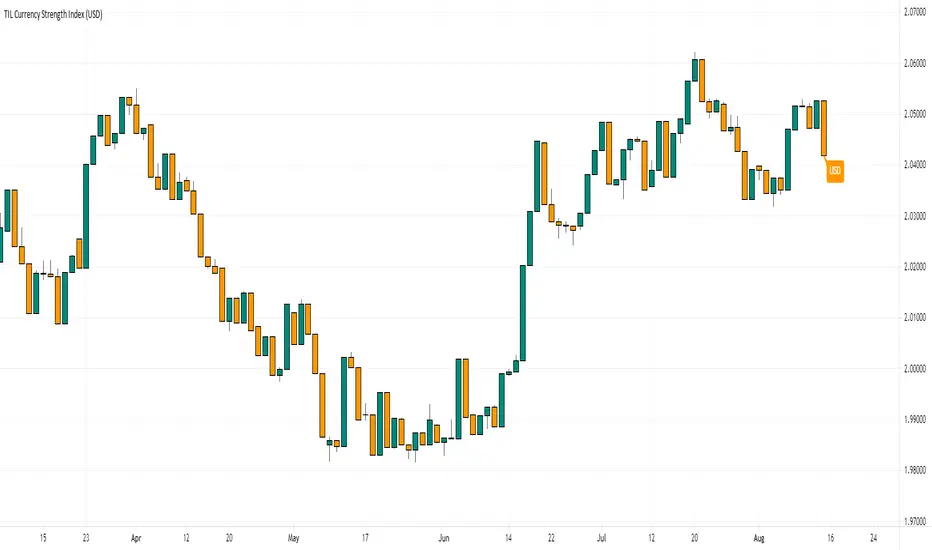
TIL Currency Strength IndexTrading Indicator Lab’s Currency Strength Index for TradingView is a “multitool” of currency indices. It can calculate the strength index of major currencies namely:
- US Dollar (USD)
- Euro (EUR)
- British Pound (GBP)
- Swiss Franc (CHF)
- Japanese Yen (JPY)
- Canadian Dollar (CAD)
- Australian Dollar (AUD)
- New Zealand Dollar (NZD)
Instead of using traditional formulas for index such as the Dow Jones FXCM Dollar Index, the Currency Strength Index indicator uses a close formula that factors in all the 8 currencies to calculate a whole and accurate representation of each currency’s strength.
Inputs
- Currency – allows the user to select one of 8 currencies to calculate and display its strength index. Choices are USD, EUR, GBP, CHF, JPY, CAD, AUD, and NZD.
- Bullish Candle Color – sets the color of bullish candlesticks in the index
- Bearish Candle Color – sets the color of the bearish candlesticks in the index
Currencyindex
Best Currency Strength Indicator By Mahfuz AzimBest Currency Strength Indicator is a visual guide that demonstrates which currencies are currently strong, and which ones are weak.
FX Currency strength indicators include multiple calculation to choose from
1. Relative Strength Index ( RSI )
2. True Strength Index (TSI)
3. Absolute Strength Index (ASI)
4. Linear Regression Slope ( LRS )
5. Rate of Change ( ROC ) and
6. Z-Score

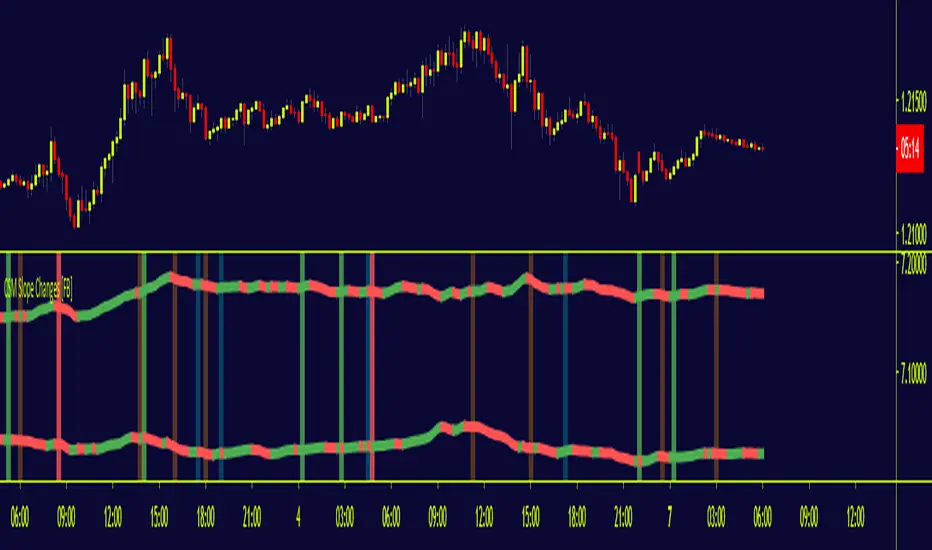
CSM Slope Changes [FB]The script highlighted in this chart is what I call the slope changes of the CSM trigger lines,. The trigger lines refer to a special non-lagging moving average derived off currency indices that will act as the potential signal to enter into positions if the rest of conditions as part of the CSM strategy agree. The script acts as an inflection point when an imbalance of flows in currency indices are expected based on the slope of the CSM trigger lines.
When the signal occurs, an area will be colored in green (long) or red (short), depending on the trade direction, of the quality of the signal is sudden in nature. If the slope change doesn't not happy in synchronicity but there is a delay of 1 candle in either index, the color of the signal will be in blue (long) or orange (short).
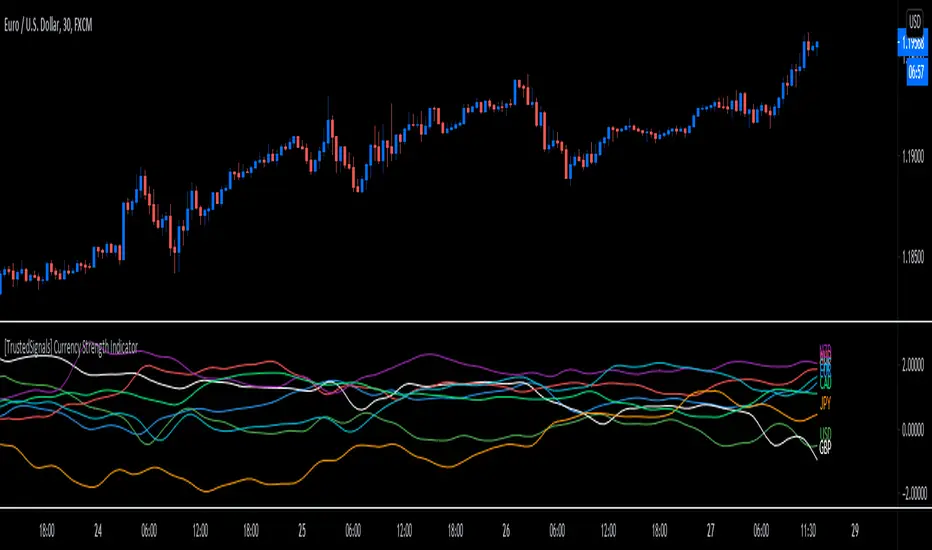
[TrustedSignals] Currency Strength IndicatorOur own branded currency strength meter gives you a quick visual guide to which currencies are currently strong, and which ones are weak.
The meter measures the strength of all forex cross pairs and applies calculations on them to determine the overall strength for each individual currency.
It is useful as a quick guide to which currencies you might want to trade, and which might be worth staying away from. For instance, if a certain currency is very strong, and another suddenly turns weaker, you may find a trading opportunity
The indicator has an extra option the user can activate, to show only the 2 indexes correlated to the displayed pair on the chart. For example, if the EURUSD pair is displayed on the chart, the indicator will only show the EUR index and the USD index.
It is recommended to use a lookback length of over 90 for Timeframes higher than 60min, and under 60 for lower intraday timeframes
Use the link below to obtain access to this indicator
FX Currency Strength IndicatorFX Currency strength indicator is a visual guide that demonstrates which currencies are currently strong, and which ones are weak.
FX Currency strength indicators include multiple calculation to choose from
1. Relative Strength Index (RSI)
2. True Strength Index (TSI)
3. Absolute Strength Index (ASI)
4. Linear Regression Slope (LRS)
5. Rate of Change (ROC)
6. Z-Score
Three display modes
1. Lines
2. Columns
3. Areas

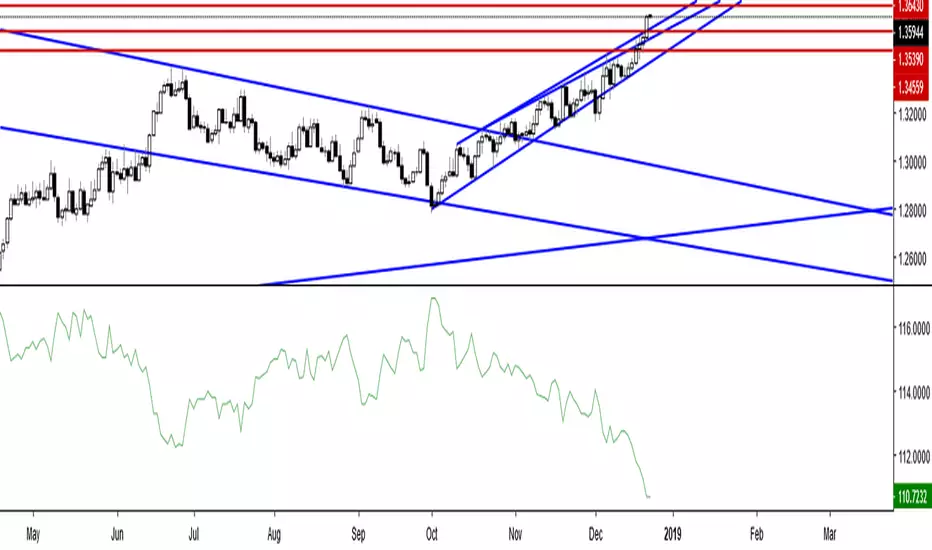
[HCSI] Hiubris Currency Strength IndicatorHow to Use
Depending on the timeframe that you trade, it’s highly recommendable that you constantly monitor the turns of the slopes, that’s the best way to spot the currency shift of flows.
- For instance, if you are trading off the hourly chart, look to enter at key decision points, aligning technicals to exploit the opportunities of the strongest currencies vs the weakest .
If we were to take the chart below as a reference, judging by the slopes of the Daily trends, one would think that looking for buy-side opportunities in the GBP and USD against the NZD and EUR would be the best combination of currencies to stay on the right side of the market flows.
- If you are an intraday trader using the 5m chart to trade, what you then want to do is to constantly monitor the granular trend in the currency index off the 5m timeframe to identify in almost real time the potential changes in currency flows. Prior to that, you should have defined what are the best currencies to pair with one another, as shown above.
* We recommend using a Lookback Length of 90 for higher timeframes (1H+) and 60 for intraday timeframes

TTPro CurrencyImpulse V12TTPro CurrencyImpulse V12 is a currency strength indicator with multiTimeFrame capabilities and variable periods (non repainting). Currently includes but not limited to AUD USD EUR CHF JPY NZD CAD GBP.

Canadian Dollar Currency IndexCanadian Dollar Currency Index updates in real time and doesn't close like tradingview.com's currency indexes. Based off of the Bank of Canada's CEER methodology and tracks it quite closely, although not perfectly. It seems to be higher than the Bank of Canada's index by 2 points. This could be due to using different data for the currencies and as I am not proficient in PineScript, I don't think I was able to replicate the formula exactly...? Regardless ,it works well and is more than close enough to suit one's purpose of tracking the Canadian dollar against a basket of currencies that are weighted according to the Bank of Canada's total weights (The total weight of a country j in year t is a weighted average of the their import, export and third-market competition weights). For more information on the actual Bank of Canada's index: www.bankofcanada.ca