Pi Cycle Indicators Comparison IndicatorThere are now 3 Pi Cycle Indicators that I am aware of; the original, improved**, and bottom.
This indicator attempts to provide all three indicators in a dingle, easy to view script.
I coded this script to displace the moving averages above and below the price bars for easy viewing. This was accomplished by placing a scaling factor (/# or *#) at the end of the ta.sma or ta.ema functions.
A vertical arrow, purposely posing as a short vertical line, marks the crossing of the long and short MAs for each indicator. These are color coded to match their respective indicators and the long and short MAs are similarly color coded for easy differentiation.
The red colored MAs and arrows above the price line are the Improved Pi-Cycle Top Indicator.
The green colored MAs and arrows below the price line are the Original Pi-Cycle Top Indicator.
The blue colored MAs and arrows below the green lines and price line are the Pi-Cycle Bottom Indicator.
One last feature of the chart is the use of the location function to enable easy comparison of the crossings of each indicator to the indicator itself and to the price. This can be accomplished simply by moving the chart up and down.
**{I should note that while researching this I found that BitcoinMamo turns out to have beat me to the punch on the Improved Indicator Long.Short and Multiplier numbers. He should therefor get the credit for that}
Cycle-bottom

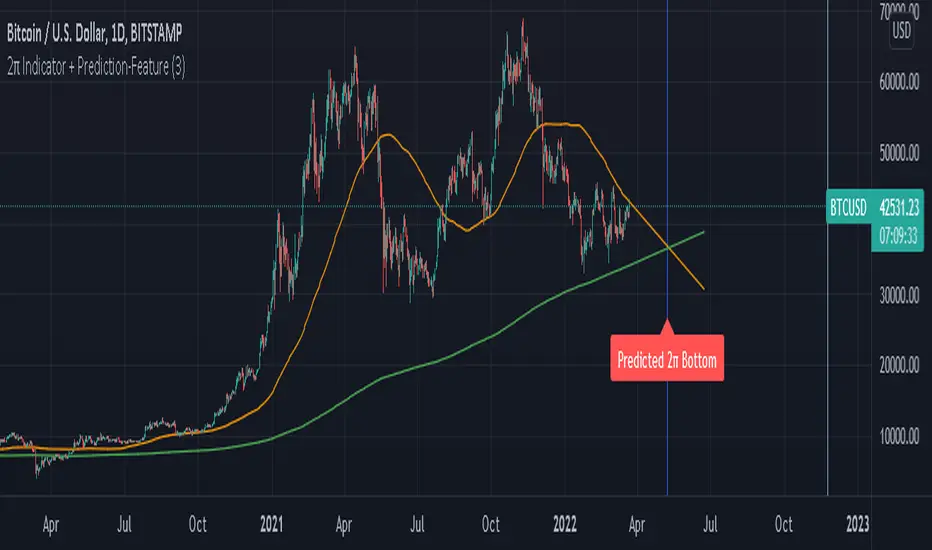
2π Indicator including Prediction-FeaturePI Cycle indicator is very good on finding potential tops.
PI cycle uses the 350MA/111MA which equals around 3,14
Using the 700MA its very obvious that we can spot potential Bottoms.
We are also using the 111MA, so 700MA/111MA equals to 6,30 which is ~ 2π.
I also built in a Prediction feature so we could speculate on a potential Bottom in the future.
Obviously the prediction might change over time if price is more volatily it changes the outcome.
Use Daily chart for best results.