DK Fractals (Strategy)Convert to strategy. Introduce the first 2 trading models (Still heavily in development) The reversal and continuation models. More to come.
If you still want to use as an indicator, just disable the two trading models.
週期
Moon Phases Long/Short StrategyThis is an experiment of Moon Phases, likely buy when full moon and sell when new moon with few changes, like it would buy a day ahead or sometimes sell a day post these events, with Stop loss and take profits, 50% profitable so sounds good to me
Long only good for bitcoin gold, both modes(L+S) better for stocks and alt coins

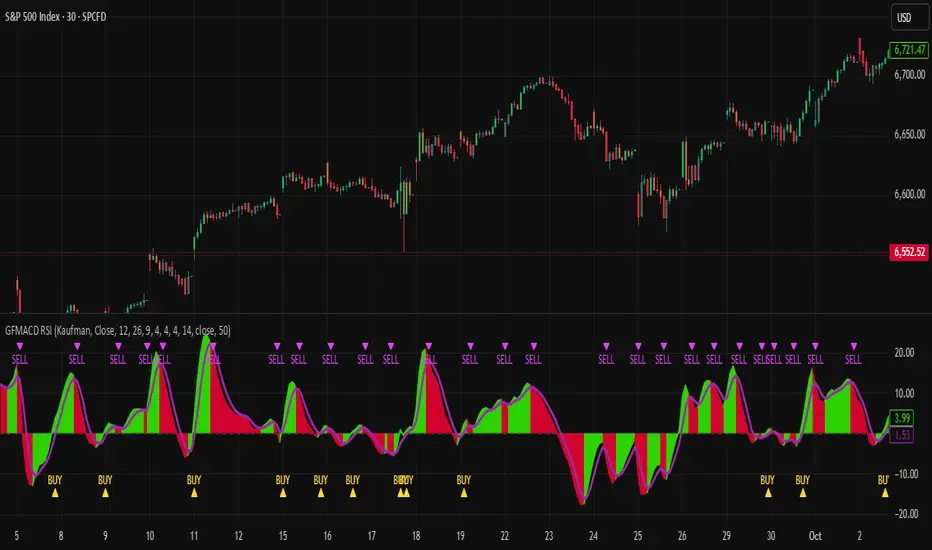
MAUL RSI Gaussian Filter MACD Gaussian Filter MACD — Strategy (with RSI Gate)
A momentum-first, chop-aware strategy built on a Gaussian-smoothed MACD with an optional RSI threshold filter. It looks for clean transitions in trend and ignores half-hearted wiggles around the zero line. You choose how signals are confirmed and whether shorts are allowed—no clutter, just deliberate entries and exits.
What it does (at a glance)
Confirms momentum using a smoothed MACD and a selectable signal mode.
Optional RSI gate to avoid low-quality breakouts.
Flexible source options (incl. Heikin-Ashi families) to match your charting style.
Long-only by default; shorts are an option.
Built-in alerts for entries/exits.
How to use
Add to chart and select your preferred signal mode.
Toggle the RSI gate and set your threshold to filter weak setups.
Forward-test across symbols/timeframes; then walk it into live with conservative sizing.
Notes
The parameters and internals are intentionally locked to protect IP and avoid over-fitting by casual copycats.
Works best on liquid symbols with consistent session structure.
Risk
Backtests are not a promise. Markets are noisy, slippage is real, and capital at risk should be sized accordingly. Use with sound risk management and a clear exit plan.
4hr / BTCBTCUSDT.P / 4hr
趨勢線交易策略
設定可以如我圖表
也可以自己找合適的
測試請用最大虧損的三倍金額下去打
圖以含手續費(0.06%)
可以用小金額去打
最大淨利與最大虧損績效比 1:10
平均獲利/虧損盈虧比 2.135
長期放保證獲利
沒獲利或獲利較小的那年通常是大事件
如2022
有問題私訊 謝謝
BTCUSDT.P / 4hr
Trendline Trading Strategy
You can set it up the same way as shown on my chart,
or find your own suitable setup.
For testing, please use three times the maximum loss as your trading capital.
The chart should include fees (0.06%).
You can trade with a small amount.
Performance:
Maximum profit to maximum loss ratio: 1:10
Average profit/loss ratio: 2.135
Guaranteed profit in the long term
Years with no profit or smaller profit are usually caused by major events,
such as 2022.
If you have any questions, please DM me. Thank you.

SHALOM TRADING HUB – Bollinger Band SystemSHALOM TRADING HUB – Bollinger Band System (Strategy)
All-in-one BB system with both Breakout and Mean-Reversion modes.
Automatic ENTRY / EXIT / STOP-LOSS, optional Mid-Band Exit, ATR or % risk, and built-in alerts. Backtest-ready.
What it does
Bollinger Bands: Basis = SMA(length); Upper/Lower = ±(mult × StDev).
Signals
Breakout mode
LONG → price crosses above Upper
SHORT → price crosses below Lower
Mean-Reversion mode
LONG → price re-enters above Lower
SHORT → price re-enters below Upper
Risk / Exits
ATR mode: SL = ATR × Mult, TP = SL × Risk:Reward
% mode: SL = %Stop, TP = %Take Profit
Optional Mid-Band (Basis) cross exit.
Visuals: BB lines + active Entry / SL / TP overlays + last-bar price labels.
Alerts: Breakout / Mean-Reversion signals and TP/SL hits.
Inputs (Settings)
Source, Length, Multiplier – BB calculation.
Signal Mode – Breakout or Mean Reversion.
Use ATR Stop/Target? – On = ATR; Off = %.
ATR Length, ATR Mult (SL), Risk:Reward (TP)
% Stop, % Take Profit (when ATR is Off)
Also exit on Mid-Band cross? – On/Off.
Alerts only on bar close? – Filters to confirmed bars.
Entry / Exit / Stop
Entry: Auto when the chosen signal condition triggers.
Stop-Loss: Placed from ATR or % settings.
Take-Profit: Set by R:R or % settings.
Mid-Band Exit (optional):
LONG → exit if close < Basis
SHORT → exit if close > Basis
Alerts (How-to)
Add the strategy to the chart → click Alerts (⚠️).
Condition: “SHALOM BB System” → choose:
BB Breakout LONG / SHORT
BB Mean-Reversion LONG / SHORT
Long TP Hit / Long SL Hit / Short TP Hit / Short SL Hit
Choose Once per bar or Once per bar close.
Backtest Tips
Match timeframe to your instrument.
Tune ATR/Mult, R:R, % to volatility.
Session filter (e.g., 09:20–15:20 IST) can be added easily in code.
Default pyramiding = 0; raise if you want multiple entries.

Bitcoin Halving Strategy
A systematic, data-driven trading strategy based on Bitcoin's 4-year halving cycles. This strategy capitalizes on historical price patterns that emerge around halving events, providing clear entry and exit signals for both accumulation and profit-taking phases.
🎯 Strategy Overview
This automated trading system identifies optimal buy and sell zones based on the predictable Bitcoin halving cycle that occurs approximately every 4 years. By analyzing historical data from all previous halvings (2012, 2016, 2020, 2024), the strategy pinpoints high-probability trading opportunities.
📊 Key Features
Automated Signal Generation: Buy signals at halving events and DCA zones, sell signals at profit-taking peaks
Multi-Phase Analysis: Tracks Accumulation, Profit Taking, Bear Market, and DCA phases
Visual Dashboard: Real-time performance metrics, phase countdown, and position tracking
Backtesting Enabled: Comprehensive historical performance analysis with configurable parameters
Risk Management: Built-in position sizing, slippage control, and optional short trading
⚙️ Strategy Logic
Buy Signals:
At halving event (Week 0)
DCA zone entry (Week 135 post-halving)
Sell Signals:
Profit-taking zone (Week 80 post-halving)
Optional short position entry for advanced traders
📈 Performance Highlights
Captures major bull run profits while avoiding prolonged bear markets
Clear visual indicators for all phases and transitions
Customizable timing parameters for personalized risk tolerance
Professional dashboard with live P&L, win rate, and drawdown metrics
🛠️ Customization Options
Adjustable phase timing (profit start/end, DCA timing)
Position sizing control
Enable/disable short trading
Visual customization (colors, labels, zones)
Table positioning and transparency
⚠️ Risk Disclosure
Past performance does not guarantee future results. This strategy is based on historical halving cycle patterns and should be used as part of a comprehensive trading plan. Always conduct your own research and consider your risk tolerance before trading.
💡 Ideal For
Long-term Bitcoin investors seeking systematic entry/exit points
Swing traders capitalizing on multi-month trends
Portfolio managers implementing cycle-based allocation strategies

Trend Catcher and Mean ReversionPlease DM if you want to use this strategy.
it took long time to make this code profitable using 3 parameters only!
it allow you to:
1- Pyramid as you see fit.
2- allow option to use trend catching strategy ( while keeping mean reversion strategy)
3- Time filter to limit trading and exit at your preferred time.
4- it works for long, short or both positions.
5- has trailing tp as an option as well while keeping initial sl as hard stop
6- tp multiple (of stop loss) is optional
ongoing working for alerts and automation. More on that for subscribers only.
i will charge the minimum fee to utilize this code as we don't need your money but we need people to support our vision.

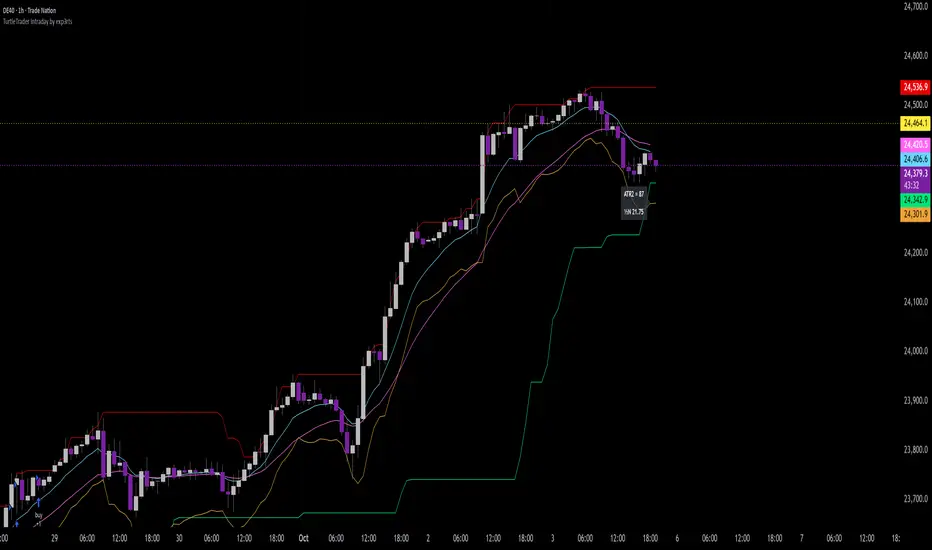
TurtleTrader Intraday Extended by exp3rts🐢 TurtleTrader Intraday Extended by exp3rts
A modern intraday adaptation of the classic Turtle Trading strategy, optimized for short-term breakout trading with built-in risk management, pyramiding, and optional trend filters.
This strategy captures strong directional moves by entering breakouts from price channels, using ATR-based stop losses and controlled position scaling.
🔑 Key Features:
📈 Channel Breakout Entries: Buy/sell on breakout of highest highs or lowest lows
🛑 Dynamic ATR Stop Loss: Automatically calculated from market volatility
🔁 Pyramiding: Adds up to 4 positions as price moves in your favor
🔄 Directional Mode: Choose Long-only or Short-only mode
🧠 Skip After Win Option: Avoid overtrading by skipping the next entry after a profitable trade
📊 Optional EMA Display: Plot up to 3 EMAs for trend filtering or visual confirmation
📉 On-Chart ATR Label: Displays real-time ATR metrics (including ½N size used in classic Turtle rules)
⚙️ Strategy Inputs:
Entry/Exit channel length
ATR multiplier and period
Entry delay (bar offset)
Optional trade filter after profitable trades
Show/hide EMAs and ATR label
🧪 Best For:
Intraday breakout traders (works well on 5m–1h timeframes)
Traders who prefer mechanical rules and structured risk
Anyone testing volatility-based entries and exits
Inspired by the original Turtle Trading system — redesigned for modern markets with more intraday flexibility and visual enhancements.
TPFX - Unified Strategy v8.1 (COT + Valuation + S/D + Seasonal)
TPFX - Unified Strategy v8.1: A 5-in-1 Confluence Model
The TPFX Unified Strategy is a comprehensive trading model that integrates five distinct market analysis modules into a single indicator. Its primary function is to generate high-confluence entry and exit signals by requiring validation across multiple layers of market analysis. This approach aims to minimize noise and focus trading activity on moments of strong directional agreement.
Core Analytical Modules:
1. COT Index (Commitment of Traders): Quantifies the relative extreme positioning of major market participants (Commercials, Large Speculators) over a user-defined lookback period to identify overextended sentiment.
2. COT Momentum: Utilizes Commercial net positioning to detect momentum shifts, based on either a new high/low logic or a Moving Average crossover.
3. Valuation Trigger: Compares the relative performance of the current symbol against a reference asset (e.g., DXY) to determine periods of comparative overvaluation or undervaluation.
4. Supply and Demand (S/D) Zones: Automatically identifies and plots institutional S/D zones based on specific candle patterns. These zones provide precise entry, stop-loss, and dynamic take-profit targets upon activation and retest.
5. Seasonal Filter: Applies a calendar-based constraint to limit trade entry to historically favorable or unfavorable periods for the specific asset.
Key Strategy Features:
* Modular Control: All five modules can be independently enabled or disabled via input settings, allowing the user to customize the required confluence level for signal generation.
* Flexible Exit Management: The strategy supports four primary exit methodologies:
* Fixed TP/SL: Standard point or percentage-based risk management.
* Dynamic (S/D Zones): Uses the S/D zone boundaries for stop-loss and either a fixed R:R ratio or the nearest opposite zone for take-profit.
* Opposite Signal: Closes a position when a full, confirmed signal in the opposite direction is generated.
* Mean Reversion: Closes the position when the COT Index or Valuation Line reverts to a defined mean level.
* Risk Parameters: Includes configurable order size, trade direction filtering (Long, Short, Both), and adjustable parameters for S/D zone detection logic.
v8.1 Update: This version features a syntax correction within the Supply/Demand Zones calculation block to ensure reliable zone detection and trigger logic.
This tool is designed for systematic traders seeking to align their decisions with fundamental flows and order book imbalances.
(Note: Full functionality relies on access to the Commitment of Traders data feed, which may require a subscription.)

高频策略优化版-空头Open Condition Reversal: Change the condition of the TEMA fast line above the slow line to the condition of the fast line below the slow line RSI condition from " buy above the threshold " to " short below the threshold ", and adjust the default threshold from 30 to 70 (more suitable for shorting overbought area) moving average direction judgment from up to down stop-loss direction adjustment: Short stop-loss Settings above the entry price (entry price * (1 + i _ sl) ) Short stop-loss set below the entry price (entry price * (1-tp) Tracking stop-loss level adjusted to below the entry price MACD logic adjustment: Preferred use of the bearish pattern as a short signal bullish pattern for closing risk management: Maintained a dynamic stop-loss mechanism, adjusted to protect the market from the bottom of the visual stop-loss strategy: The visual marking of the ACD energy column is convenient for monitoring signals to be fully tested before use, especially for adjusting RSI thresholds and stop-loss parameters to suit the characteristics of specific trading varieties.

Kootch Moon Phase Strategy🌙 Moon Phases Equity Strategy
This strategy explores the relationship between lunar cycles and equity price action.
It is based on a simple idea: markets may respond differently around New Moons and Full Moons.
🛠 How it works
• New Moon → Long Entry
The strategy enters a long position at the first bar after a New Moon event.
• Full Moon → Exit
The strategy closes the long position at the first bar after the following Full Moon.
• Optional Filters
• 200-day Moving Average (on by default): only take longs in bullish regimes.
• ATR-based Stops & Targets: risk management can be added with configurable multiples of ATR.
• Minimum Gap: ensures a cooldown period between trades to avoid clustering.
• Position Sizing: by default, trades risk a configurable % of equity (set to 35%).
📊 Notes
• This script is designed for equities (stocks, ETFs).
• It is a long-only system by default. If you enable “Always Flip,” the script will alternate long/short each lunar phase, but that is more experimental.
• Results can vary widely depending on the underlying asset. Trending stocks (e.g., AMZN, AAPL, SPY) tend to perform better with the long-only mode.
• Risk/Reward tracking in R-multiples is included for more consistent performance evaluation.
⚠️ Disclaimer
This strategy is for educational and research purposes only. It does not guarantee profitability and should not be used as financial advice. Past performance does not indicate future results. Always backtest on your preferred instruments and use sound risk management.

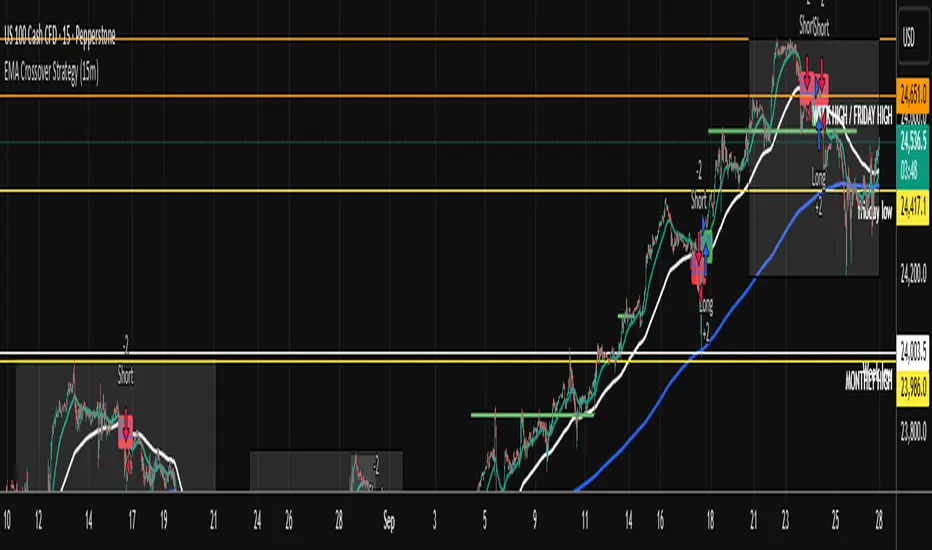
EMA Crossover Strategy (15m)50 and 200 ema crossing when leaving anchor. when 50 and 200 crosses will give you direction of where market is going. wait for a pull back and take trade. sl on highest or lowest point of apex tp open . when you see multiple equal ( low or High) get put of trade.

MTF Regime + Breakout-Pullback by HarshMTF BTC regime filter + trend filter, Donchian breakout after a pullback, ATR‑based stop, 2 profit targets, trailing runner, and pyramiding into 3 tranches.

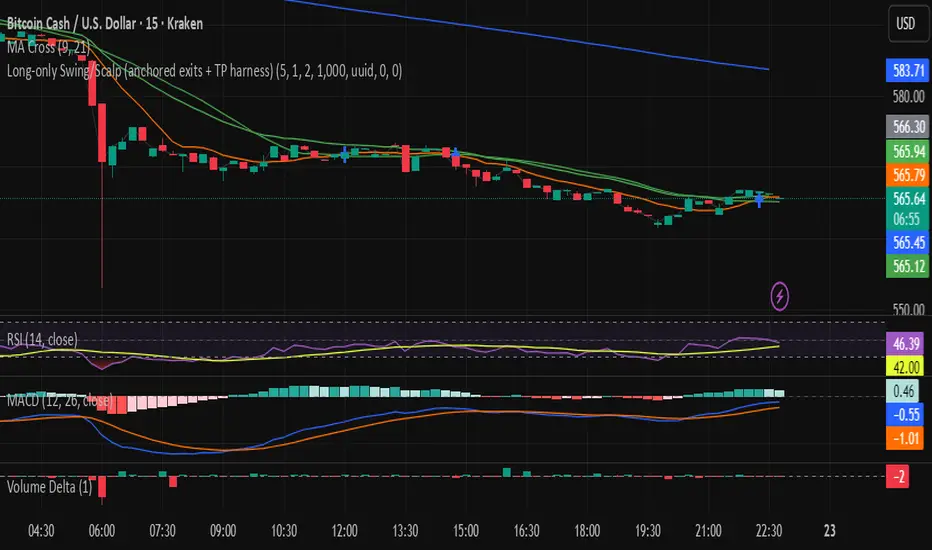
Long-only Swing/Scalp (anchored exits + TP harness) Traders PostThis is the Traders Post friendly drag and drop version of the swing/ scalp strategy for the algo traders out there. Let me know your thoughts, constructive criticism is always welcome.
Composite PR Signal (Trend↔Revert + ADX gate)Core Components
1. Dynamic Inputs
Max/PR windows (maxLen, prWin) – define historical lookbacks for oscillators and percentile ranks.
Smoothing (smooth) – applies an EMA filter to stabilize composite scores.
Threshold (th) – governs entry sensitivity.
Holding period (hBars) – maximum bars allowed in a trade.
Execution options – allow shorting, fast approximations for PR and CCI.
2. Custom Utility Functions
The script implements optimized versions of common TA operations:
Rolling sums, delays, and moving averages (EMA, RMA, SMA).
Lazy rolling extrema (efficient highest/lowest lookups).
Stateful arrays for tracking oscillator values across bars.
Fast approximations for percentile ranks and indicators.
3. Indicators Used
The system calculates a broad set of oscillators, including:
Trend/Momentum: ROC, TRIX, TSI, MACD histogram, OBV ROC, AO, CMF, BOP, UO, ADX.
Reversion/Oscillators: RSI, Stochastic K/D, MFI, Williams %R, CCI, CMO.
Each is converted into a percentile rank (PR) to normalize values between 0–100.
4. Composite Scoring
Two composite signals are built:
Trend Score – averages normalized outputs of momentum indicators.
Reversion Score – averages normalized outputs of oscillators prone to mean reversion.
ADX Gate – when ADX PR is high, the strategy favors trend score; when low, it favors reversion score.
Final score is smoothed and compared against entry thresholds.
5. Trade Logic
Entry:
Long: When composite score crosses above +th.
Short: When composite score crosses below -th (if enabled).
Exit:
Opposite crossover signal.
Or trade duration exceeds hBars.
6. Risk/Execution Parameters
Initial capital: 100,000
Commission: 0.01% per trade
Fixed order size: 100 units
No pyramiding
Intended Use
This script is designed for:
Swing trading across multiple assets (equities, forex, crypto).
Adapting to market regimes — capturing breakouts during strong trends, but fading moves when markets are choppy.
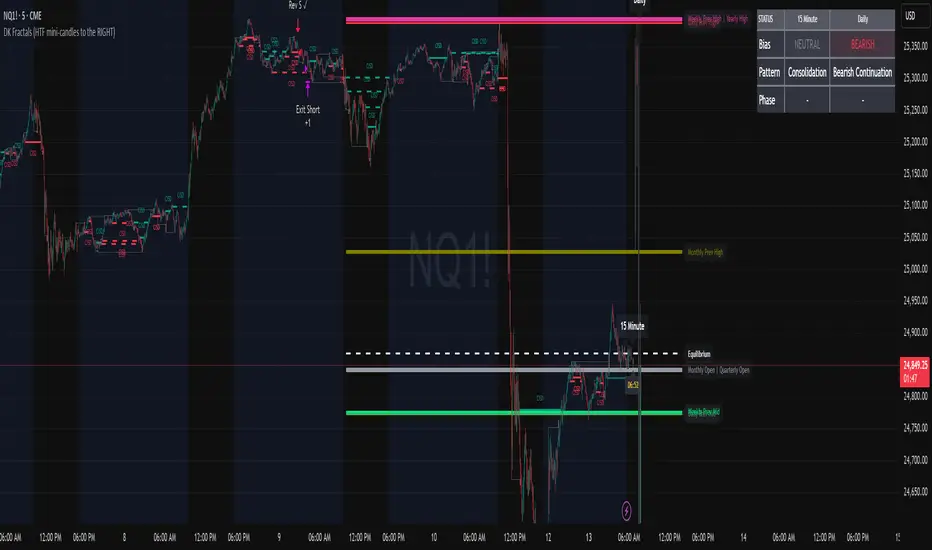
CoinGpt NQ策略# CoinGpt NQ 策略(MACD·多因子·可金字塔)
## 概述
**CoinGpt NQ策略**是一套面向 **纳指期货 NQ(建议:`CME_MINI:NQ1!`)30 分钟** 的可运行交易策略。
核心以 **MACD 趋势动量** 为骨架,叠加 **EMA 趋势过滤**、**可选金字塔加仓**、**三种出场模式(固定 TP/SL、追踪、追踪+TP)** 与 **风控上限**,提供三套一键预设(Balanced / Trend / Scalper),满足不同市场状态与风险偏好。
> 适配:期货/连续合约;仅做多(本脚本版本)。
> 时间框架:**30m**(可在“仅在 30m 生效”开关控制)。
---
## 进场逻辑
* **信号触发**:`MACD 上穿 Signal`(并要求直方图连续上升 2 根)。
* **趋势过滤**:价格位于 `EMA(p_emaLen)` 上方,且 `MACD>0 & Signal>0`(可关闭)。
* **时间框架限制**:默认仅在 30m 有效(可关闭)。
## 出场逻辑
* **固定 TP/SL**:按百分比计算限价止盈与止损。
* **追踪止盈**:默认以 **ATR 偏移** 跟踪;
* **追踪 + TP**:在拖尾的同时设置上沿 TP。
* **反向保护**:`MACD 下穿 Signal` 时市价平仓。
> 出场模式在输入项 **「出场模式」** 选择:
> `Auto(by preset) / Fixed TP/SL / Trailing / Trailing + TP`
---
## 金字塔加仓(可选)
* 仅在已有多单且不利回撤达到阈值时触发;
* 最多 `p_maxAdds` 层;每层在 **上次加仓价** 基础上按 `p_addStep%` 回撤触发;
* 目的:**拉低均价、提高持仓性价比**;采用小步长、有限层数控制回撤风险。
---
## 风险管理
* **当日最大亏损**:`strategy.risk.max_intraday_loss(p_maxDailyDD, %权益)`
* **单笔头寸上限**:`strategy.risk.max_position_size(p_posCapPct)`
* **订单量**(策略属性):默认 **90% 权益**。
* 实盘更建议:Balanced≈**40%**、Trend≈**35%**、Scalper≈**30%**(在“策略属性 → 订单大小”中调整)。
---
## 三套预设(参数一键生效)
| 预设 | MACD(fast/slow/signal) | 趋势EMA | 金字塔 | 加仓步长 | 固定TP/SL(%) | 追踪(ATR倍数) | 单笔上限 | 当日亏损 |
| ---------------- | ---------------------- | ----- | --- | ----- | ----------------- | --------- | ---- | ---- |
| **Balanced(默认)** | 8 / 21 / 5 | 233 | 2 层 | 0.12% | TP 0.22 / SL 0.15 | 1.2× | 50% | 1.5% |
| **Trend** | 10 / 24 / 7 | 200 | 3 层 | 0.10% | TP 0.25 / SL 0.18 | 1.6× | 45% | 1.2% |
| **Scalper** | 6 / 19 / 4 | 100 | 关闭 | —— | TP 0.18 / SL 0.12 | 1.3× | 35% | 1.0% |
> 说明:
>
> * Balanced:均衡型,适合多数时期;
> * Trend:顺势拉伸,持仓更久、盈亏比更高;
> * Scalper:快进快出、高胜率、不过度叠仓。
---
## 使用建议
1. **品种/周期**:`CME_MINI:NQ1!`(或当季主力合约),**30m**。
2. **手续费**:本策略默认 **1 USD/合约**(在“策略属性”可按实盘成本调整)。
3. **成交精度**:建议在“策略属性 → 高级设置”勾选 **Bar Magnifier**,提升限价/拖尾成交模拟精度。
4. **仓位**:策略默认 90% 仅为展示;回测与实盘更建议 **30%\~40% 权益**。
5. **风险**:金字塔仅做轻量、有限层数;若市场极端震荡,适当降低单笔上限与当日亏损阈值。
---
## 输入项(TradingView 右侧面板)
* **参数预设**:`Balanced / Trend / Scalper`
* **仅在 30m 周期生效**:开/关
* **出场模式**:`Auto(by preset) / Fixed TP/SL / Trailing / Trailing + TP`
> 其余细节参数由预设自动注入,无需手动繁杂调整,**开箱即用**。
---
## 注意事项
* 本脚本为研究与教育用途,不构成投资建议。期货与杠杆交易风险高,请在可承受范围内使用。
* 预设适配历史统计特征,未来表现不保证;建议结合自身风控与账户规模,先小仓/纸面验证。
* 仅做多版本;若需要双向(多空)或加入 RTH(美股盘中)/HTF(更高周期确认)等扩展,请在评论区留言。
---
**作者注**:
* 本策略在 Pine v6 编写,避免了常见的 v6 语法踩坑(如 `strategy.risk.max_position_size()` 仅 1 参、`plot` 标题需常量、追踪需成对参数 `trail_price + trail_offset` 等)。
* 欢迎在评论区反馈你的回测截图(区间、手续费、订单量),我会根据数据给出更贴合你的参数档。
# CoinGpt NQ Strategy (MACD · Multi-Factor · Optional Pyramiding)
## Overview
**CoinGpt NQ Strategy** is a ready-to-trade system for **Nasdaq-100 futures (NQ; recommended: `CME_MINI:NQ1!`) on the 30-minute timeframe**.
It uses **MACD momentum** as the backbone, adds an **EMA trend filter**, optional **pyramiding**, and **three exit modes** (Fixed TP/SL, Trailing, Trailing+TP) with built-in risk caps. Three one-click presets—**Balanced / Trend / Scalper**—cover different regimes and risk appetites.
> Instruments: futures / continuous contract
> Direction: **Long-only** (this script version)
> Timeframe: **30m** (toggleable)
---
## Entry
* **Trigger:** `MACD` line crossing **above** `Signal`.
* **Trend filter (optional):** price above `EMA(p_emaLen)` and `MACD > 0 & Signal > 0`.
* **Timeframe guard:** by default, signals are valid on **30m** only.
## Exit
* **Fixed TP/SL:** percentage-based limit and stop.
* **Trailing:** ATR-based trailing offset (or percent).
* **Trailing + TP:** trailing stop **and** a take-profit cap.
* **Protective flip:** when `MACD` crosses **below** `Signal`, close the long.
> Choose exit mode in **Inputs → “Exit Mode”**:
> `Auto(by preset) / Fixed TP/SL / Trailing / Trailing + TP`.
---
## Pyramiding (optional)
* Adds only **against adverse pullbacks** from the last add price.
* Up to `p_maxAdds` layers; each layer triggers at `p_addStep%` pullback from the **previous add**.
* Goal: **improve average price** with **small steps & limited layers** to keep drawdowns controlled.
---
## Risk Management
* **Daily loss cap:** `strategy.risk.max_intraday_loss(p_maxDailyDD, % of equity)`.
* **Per-trade size cap:** `strategy.risk.max_position_size(p_posCapPct)`.
* **Order size (strategy properties):** default **90% of equity** (for display).
* Practical suggestion: Balanced ≈ **40%**, Trend ≈ **35%**, Scalper ≈ **30%** (set in Strategy Properties → Order size).
---
## Presets (one-click)
| Preset | MACD (fast/slow/signal) | Trend EMA | Pyramiding | Add Step | Fixed TP/SL (%) | Trailing (ATR) | Pos Cap | Daily DD |
| ---------------------- | ----------------------- | --------- | ---------- | -------- | ------------------------- | -------------- | ------- | -------- |
| **Balanced (default)** | 8 / 21 / 5 | 233 | 2 layers | 0.12% | TP **0.22** / SL **0.15** | **1.2×** | **50%** | **1.5%** |
| **Trend** | 10 / 24 / 7 | 200 | 3 layers | 0.10% | TP **0.25** / SL **0.18** | **1.6×** | **45%** | **1.2%** |
| **Scalper** | 6 / 19 / 4 | 100 | Off | — | TP **0.18** / SL **0.12** | **1.3×** | **35%** | **1.0%** |
> **Balanced:** all-weather, stable.
> **Trend:** holds longer and targets higher R multiples.
> **Scalper:** quick in/out, higher hit-rate, no stacking.
---
## Usage Tips
1. **Symbol/TF:** `CME_MINI:NQ1!`, **30m**.
2. **Fees:** default **\$1 per contract** (adjust to your broker in Strategy Properties).
3. **Execution realism:** enable **Bar Magnifier** (Strategy Properties → Advanced) for more accurate limit/trailing fills.
4. **Sizing:** the script defaults to 90% only to showcase behavior—use **30–40%** in realistic tests.
5. **Pyramiding:** keep layers small & capped. In choppy regimes, reduce `p_posCapPct` and `p_maxDailyDD`.
---
## Inputs (right-panel)
* **Param Preset:** `Balanced / Trend / Scalper`
* **30m-only:** on/off
* **Exit Mode:** `Auto(by preset) / Fixed TP/SL / Trailing / Trailing + TP`
> All other parameters are pre-wired by the chosen preset for **plug-and-play** operation.
---
## Notes & Disclaimer
* Educational use only—**not** financial advice. Futures and leverage carry substantial risk.
* Presets reflect historical characteristics; **future performance is not guaranteed**. Start small or paper trade first.
* This version is **long-only**; if you need a two-sided (long & short) variant or extras (RTH/HTF filters), leave a comment.
---
**Author Notes**
* Written in **Pine v6** with common pitfalls avoided (e.g., `strategy.risk.max_position_size()` takes **one** arg, `plot` titles are **const strings**, trailing requires `trail_price + trail_offset`).
* Share your backtest screenshots (period, fees, order size) and I can suggest **tighter, data-driven knobs** for your setup.

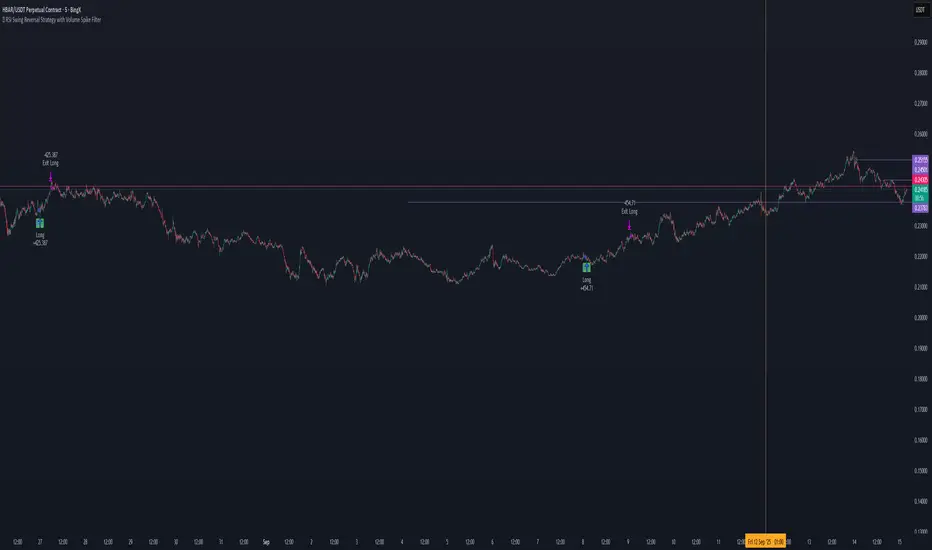
📊 RSI Swing Reversal Strategy with Volume Spike FilterHi , i did test that on Hbar time frame 5min. please let me know if i did miss something .85% win rate. please get back test.
What Will This Strategy Do?
Use RSI cross over/under its MA + Swing High/Low + optional Trend Filter.
Enter long on bullish signals.
Enter short on bearish signals.
Exit on opposite signals or optional take-profit/stop-loss.
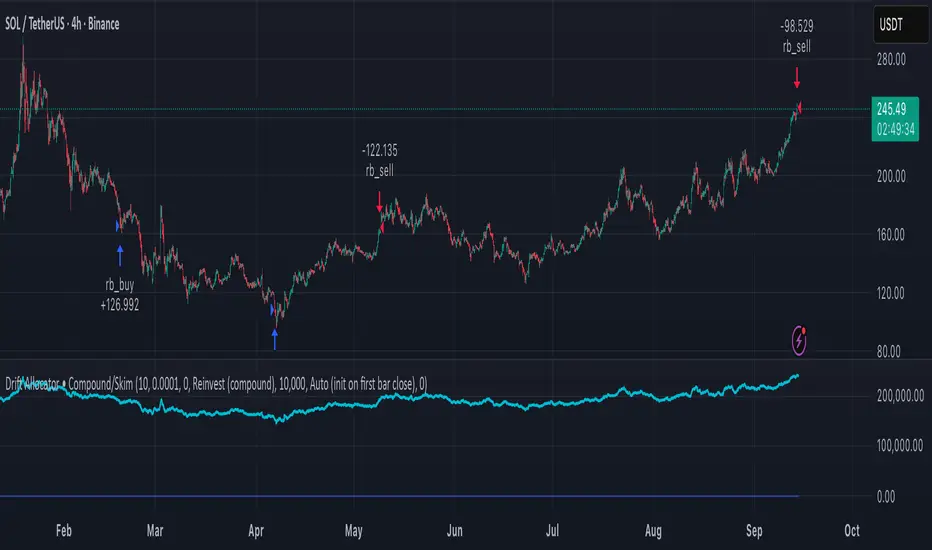
Delta Drift Allocator - StrategySummary
Bar-close, drift-based allocation alerts that keep exposure centered around a user-set base with full compounding by default. One alert per bar close. Non-repainting. Invite-Only.
Description
Delta Drift Allocator monitors how far current exposure drifts from a reference profile. When drift exceeds your threshold, it issues a single bar-close instruction (BUY/SELL with quantity) to nudge exposure back toward center. The emphasis is path discipline—rules that react to swings without predicting direction—plus a simple one-alert workflow.
A start-sync input lets you align the script with your actual initial fill so subsequent sizes match your account. Profit handling supports Reinvest (compound) or Skim to base (bookkeep excess).
How to use (overview)
Add to chart (recommended timeframe: 4h).
Set Inputs: drift threshold, min notional, start method (Auto or Manual sync at your bar-close time + filled units).
Create one alert: This strategy → Any alert() function call, Once per bar close. Leave Message empty.
Execute externally: place BUY/SELL for exactly the shown qty (manual or your own webhook executor outside TradingView).
Note: A detailled manual is provided after purchase.
Why traders choose it
Bar-close discipline (no intra-bar churn, non-repainting)
Drift-responsive adjustments that can harvest parts of oscillations
Full compounding by default; optional “skim to base” bookkeeping
Start-sync to match real fills; minimal panel plots you can hide
Access (Invite-Only)
To request access, send me a PM on TradingView. You’ll receive detailled information about the process.
Note: Requests for older strategies are no longer processed—please refer to this release only.
Compliance
Signals only; the script does not place orders or read balances. Backtests are approximations and are not indicative of future results. Markets involve risk, including possible loss. Extended one-way advances can lag all-in exposure; starting right after strong rallies may show initial drawdowns.
Killzones SMT + IFVG detectorKillzones SMT + IFVG Detector
Summary
This strategy implements a specific intraday workflow inspired by ICT-style concepts.
It combines:
Killzone session levels (recording untouched highs/lows)
SMT divergence between NQ and ES (exclusive sweep logic)
IFVG confirmation (3-bar imbalance + width filter + inversion guard)
and an optional smart exit engine
The components are not simply mashed together: they interact in sequence.
A setup only confirms if all conditions line up (time window → untouched level sweep → divergence → valid IFVG → confirmation candle → risk filter).
Workflow
Killzones & session levels
Tracks highs/lows inside default killzones (19:00–23:00, 01:00–04:00, 08:30–10:00, 11:00–12:00, 12:30–15:00, chart timezone).
Stores untouched levels forward; sweeps trigger candidate signals.
SMT divergence (exclusive sweep)
Bullish SMT : one index sweeps its low while the other remains above its session low.
Bearish SMT : one index sweeps its high while the other remains below its session high.
Detection supports “Sweep (Cross)” or “Exact Tick.”
Session IDs are tracked so once a side has fired, later re-touches can’t re-trigger .
IFVG confirmation
Locks the first valid 3-bar IFVG after SMT.
Confirmation requires a candle close beyond the IFVG boundary in the direction of the close.
IFVGs must meet a minimum width filter (default 1.0 point).
Inversion guard: ignores IFVGs already inverted before SMT.
Optional “re-lock” keeps tracking the latest IFVG until confirmation/expiry.
Smart exit engine
Initial stop from opposite wick (+ buffer).
Fixed TP (default 40 points).
Dynamic stop escalation at progress thresholds (BE → 50% → 80% of target).
Safety gates
Weekend lockout (Fri 16:40 → Sun 18:00).
Same-bar sweep of high & low cancels setups.
Max initial stop filter skips oversized setups.
Optional cooldown bars.
Alerts
SMT Bullish/Bearish : divergence detected this bar.
Confirm Long/Short : IFVG confirmation triggered.
Default Strategy Properties (used in screenshots/backtests)
Initial capital: $25,000
Order size: 1 contract
Commission: $1.25 per contract per side
Slippage: 2 ticks
Backtest window: Jun 16, 2025 – Sep 14, 2025
These settings are intentionally conservative. If you change them, your results will differ.
How to use
Apply on an NQ or ES futures chart (1–5 min).
Choose your killzones and detection mode.
Select confirmation symbol (NQ, ES, or “Sweeper”).
Enable/disable IFVG re-lock.
Review signals and use alerts for automation if desired.
Limitations
Strict filters reduce trade count; extend backtest window for more samples.
Works best on NQ/ES; not validated elsewhere.
Past performance is not indicative of future results.
This is an educational tool ; not financial advice.

Small-Cap — Sell Every Spike (Rendon1) Small-Cap — Sell Every Spike v6 — Strict, No Look-Ahead
Educational use only. This is not financial advice or a signal service.
This strategy targets low/ mid-float runners (≤ ~20M) that make parabolic spikes. It shorts qualified spikes and scales out into flushes. Logic is deliberately simple and transparent to avoid curve-fit.
What the strategy does
Detects a parabolic up move using:
Fast ROC over N bars
Big range vs ATR
Volume spike vs SMA
Fresh higher high (no stale spikes)
Enters short at bar close when conditions are met (no same-bar fills).
Manages exits with ATR targets and optional % covers.
Tracks float rotation intraday (manual float input) and blocks trades above a hard limit.
Draws daily spike-high resistance from confirmed daily bars (no repaint / no look-ahead).
Timeframes & market
Designed for 1–5 minute charts.
Intended for US small-caps; turn Premarket on.
Works intraday; avoid illiquid tickers or names with constant halts.
Entry, Exit, Risk (short side)
Entry: parabolic spike (ROC + Range≥ATR×K + Vol≥SMA×K, new HH).
Optional confirmations (OFF by default to “sell every spike”): upper-wick and VWAP cross-down.
Stop: ATR stop above entry (default 1.2× ATR).
Targets: TP1 = 1.0× ATR, TP2 = 2.0× ATR + optional 10/20/30% covers.
Safety: skip trades if RVOL is low or Float Rotation exceeds your limit (default warn 5×, hard 7×).
Inputs (Balanced defaults)
Price band: $2–$10
Float Shares: set per ticker (from Finviz).
RVOL(50) ≥ 1.5×
ROC(5) ≥ 1.0%, Range ≥ 1.6× ATR, Vol ≥ 1.8× SMA
Cooldown: 10 bars; Max trades/day: 6
Optional: Require wick (≥35%) and/or Require VWAP cross-down.
Presets suggestion:
• Balanced (defaults above)
• Safer: wick+VWAP ON, Range≥1.8×, trades/day 3–4
• Micro-float (<5M): ROC 1.4–1.8%, Range≥1.9–2.2×, Vol≥2.2×, RVOL≥2.0, wick 40–50%
No look-ahead / repaint notes
Daily spike-highs use request.security(..., lookahead_off) and shifted → only closed daily bars.
Orders arm next bar after entry; entries execute at bar close.
VWAP/ATR/ROC/Vol/RVOL are computed on the chart timeframe (no HTF peeking).
How to use
Build a watchlist: Float <20M, RelVol >2, Today +20% (Finviz).
Open 1–5m chart, enter Float Shares for the ticker.
Start with Balanced, flip to Safer on halty/SSR names or repeated VWAP reclaims.
Scale out into flushes; respect the stop and rotation guard.
Limitations & risk
Backtests on small-caps can be optimistic due to slippage, spreads, halts, SSR, and limited premarket data. Always use conservative sizing. Low-float stocks can squeeze violently.
Alerts
Parabolic UP (candidate short)
SHORT Armed (conditions met; entry at bar close)

Astro Trading Strategy by LansTitle:
Astro Trading Strategy + Planetary Dashboard + Future Forecast
Description:
This strategy combines astrology-inspired market timing with automated trade entries. It uses planetary cycles, moon phases, and zodiac transitions to generate Buy and Caution signals, helping traders align with key cosmic events.
🪐 Key Features
Planetary Dashboard – Displays current Zodiac sign, Moon phase, and planetary conditions in real-time.
Moon-Phase Trading – Generates Buy signals on New Moons and Caution signals on Full Moons (configurable).
Mercury Retrograde Filter – Optionally avoids trading during Mercury Retrograde periods.
Planetary Aspect Filter – Trades only when favorable Venus conjunctions align and Saturn squares are avoided.
Future Forecasting – Calculates and displays the next upcoming Buy and Caution days directly on the chart.
Fully Configurable – Enable/disable dashboard, aspect filters, and moon-phase logic to fit your trading style.
🎯 How It Works
Buy Signals appear during supportive cosmic alignments (e.g., Venus conjunct Sun + New Moon).
Caution Signals appear near Full Moons, Saturn squares, or Mercury retrogrades.
Automated Entries – When enabled, strategy takes trades based on signal conditions for backtesting.
⚠ Disclaimer
This is an experimental astro-financial strategy intended for educational purposes. Past planetary patterns do not guarantee future performance. Always combine with sound risk management and technical confirmation before trading live markets.
---
#astrotrading #planetarycycles #moonphases #strategy #astrology #swingtrading #backtest

Hilly 3.0 Advanced Crypto Scalping Strategy - 1 & 5 Min ChartsHow to Use
Copy the Code: Copy the script above.
Paste in TradingView: Open TradingView, go to the Pine Editor (bottom of the chart), paste the code, and click “Add to Chart.”
Check for Errors: Verify no errors appear in the Pine Editor console. The script uses Pine Script v5 (@version=5).
Select Timeframe:
1-Minute Chart: Use defaults (emaFastLen=7, emaSlowLen=14, rsiLen=10, rsiOverbought=80, rsiOversold=20, slPerc=0.5, tpPerc=1.0, useCandlePatterns=false, patternLookback=10).
5-Minute Chart: Adjust to emaFastLen=9, emaSlowLen=21, rsiLen=14, rsiOverbought=75, rsiOversold=25, slPerc=0.8, tpPerc=1.5, useCandlePatterns=true, patternLookback=10.
Apply to Chart: Use a liquid crypto pair (e.g., BTC/USDT, ETH/USDT on Binance or Coinbase).
Verify Signals:
Green “BUY” or “EMA BUY” labels and triangle-up arrows below candles for bullish signals (EMA crossovers, bullish engulfing, hammer, doji, morning star, three white soldiers, double bottom).
Red “SELL” or “EMA SELL” labels and triangle-down arrows above candles for bearish signals (EMA crossovers, bearish engulfing, shooting star, doji, evening star, three black crows, double top).
Green/red background highlights for signal candles.
Backtest: Use TradingView’s Strategy Tester to evaluate performance over 1–3 months, checking Net Profit, Win Rate, and Drawdown.
Demo Test: Run on a demo account to confirm signal visibility and performance before trading with real funds.
