MPS v3.2 – MicroStructure Pulse Scalper📌 MPS v3.2 – MicroStructure Pulse Scalper
Description:
MPS v3.2 is an advanced scalping strategy tailored for precision entries on low timeframes. Built around microstructure theory and volatility behavior, it integrates a fusion of institutional-grade filters for trade validation, including:
• VWAP Z-Score Deviation – mean-reversion logic from anchored value
• Volume Spike Detection – identifies aggressive orderflow surges
• Volatility Expansion – signals breakouts using dynamic ATR range
• Liquidity Sweeps (Stop-Hunts) – detects market maker traps
• Bullish/Bearish Pin Bar Confirmation – filters false sweeps
• Signal Clustering Memory – boosts signal reliability via AI-style memory
• Trend, Session, and Risk Filters – optional layers for alignment
• Visual Enhancements – gradient candles, entry zone heatmap, and stats panel
Key Features:
Risk/Reward-based exit OR VWAP take profit
Trailing stop functionality
Adaptive “Aggressive Mode” for early entries
Clean, minimal dashboard with live performance stats
Built for 1m–5m scalping, optimized for BTC/ETH and other liquid pairs
Daytrading

PRO Investing - Apex Engine FREE VERSION🧠 The Apex Engine: True Self-Tuning Intelligence
The biggest flaw in most indicators is that they rely on fixed settings. The Apex Engine solves this with two layers of adaptation:
Fully Auto-Adjustable Parameters: The engine first analyzes the volatility of the asset on your chart to derive its own optimal "Fast," "Mid," and "Slow" momentum lengths. You never have to guess settings again—it tunes itself for any instrument and timeframe.
Performance-Based Selection: It then uses statistical correlation to constantly measure which of its auto-tuned parameters is most in-sync with recent price action. It deploys the "winning" engine to generate signals, ensuring you're always using the most relevant analysis.
🎨 An All-in-One, Unified View
We've engineered this script to deliver maximum information with minimum clutter, all within a single indicator.
High-Confluence Buy/Sell Signals (▲/▼): Clear triangles appear directly on your chart. These are not simple crossovers; a signal is only plotted if it aligns with the dominant trend (above/below the 200MA) and the market is not choppy (ADX > 20).
Compact Oscillator Display: A "lite" version of the oscillator is displayed in a compact panel at the bottom of your price chart, showing the active Velocity line and its signal.
Transparent Dashboard: A small table in the corner shows you the engine's "brain" at work, displaying the real-time correlation scores and highlighting the active parameter.
Smart Background Coloring: The entire chart background changes color to give you immediate context:
🟩 Green: Bullish trend, favorable conditions for buys.
🟥 Red: Bearish trend, favorable conditions for sells.
⬛ Gray: Caution zone. Market is choppy or counter-trend.
This tool is designed to be the ultimate all-in-one solution for traders who value automation, clarity, and adaptive analysis.
If you find this indicator powerful, please leave a Boost 👍 and Follow our Profile for more professional-grade tools.
Disclaimer: All indicators are for analytical and educational purposes only. Trading involves significant risk. Always use your own judgment and risk management.

Optimus Prime X SignalsOptimus Prime X Signals - TradingView Indicator Description
Overview
The Optimus Prime X Signals is a sophisticated, customizable technical analysis indicator designed for the TradingView platform. It combines three widely used technical indicators—Average True Range (ATR), Exponential Moving Average (EMA), and Relative Strength Index (RSI)—to generate actionable buy and sell signals. By integrating these indicators, the script provides traders with a versatile tool to identify potential entry and exit points in various market conditions. The indicator is displayed as an overlay on the price chart, with clear visual cues for signals, including labeled markers and candlestick color changes.
This indicator is suitable for traders of all experience levels, offering flexible configuration options to tailor signal generation to specific trading strategies and timeframes. It also includes built-in alert conditions, enabling seamless integration with TradingView’s alert system for real-time notifications.
Features
1. Multi-Indicator Signal Generation
The indicator combines signals from ATR-based support/resistance levels, EMA price deviations, and RSI overbought/oversold conditions. Traders can enable or disable each indicator’s contribution to the final signal, allowing for a highly customizable approach.
2. Visual Feedback
* Buy and Sell Labels: Green "Buy" labels appear below the price bar, and red "Sell" labels appear above the price bar when signals are triggered.
* Candlestick Coloring: Candlesticks turn white when a buy or sell signal is generated, providing an immediate visual cue.
* Overlay Design: The indicator integrates directly with the price chart, ensuring a clutter-free and intuitive user experience.
3. Flexible Configuration
Each indicator component (ATR, EMA, RSI) has its own configuration group in the settings panel, allowing traders to:
* Adjust periods, multipliers, and thresholds.
* Specify custom timeframes for each indicator.
* Enable or disable individual indicators for signal generation.
4. Alert Integration
The script includes two alert conditions:
* Buy Signal: Triggered when all enabled conditions (ATR, EMA, RSI) align for a bullish signal.
* Sell Signal: Triggered when all enabled conditions align for a bearish signal.
These alerts can be configured within TradingView to notify traders via email, SMS, or other supported methods.
Configuration Options
Support/Resistance Configuration (ATR)
* Use (ATR) Support/Resistance for Signals: Enable or disable ATR-based signals (default: enabled).
* ATR Period: Set the lookback period for calculating the ATR (default: 5).
* ATR Multiplier: Define the multiplier applied to the ATR value to calculate support and resistance levels (default: 0.5).
* ATR Timeframe: Specify the timeframe for ATR calculations (default: Daily, "D").
The ATR is used to establish dynamic support (price below the last close minus ATR * multiplier) and resistance (price above the last close plus ATR * multiplier) levels. A buy signal is generated when the price falls below the support level, and a sell signal is generated when the price rises above the resistance level.
EMA Configuration
* Use EMA for Signals: Enable or disable EMA-based signals (default: enabled).
* EMA Period: Set the lookback period for the EMA calculation (default: 50).
* EMA (%) Distance: Define the percentage distance from the EMA to create upper and lower bands (default: 0.5%).
* EMA Timeframe: Specify the timeframe for EMA calculations (default: chart timeframe).
The EMA component generates a buy signal when the price falls below the lower EMA band (EMA * (1 - distance/100)) and a sell signal when the price rises above the upper EMA band (EMA * (1 + distance/100)).
RSI Configuration
* Use RSI for Signals: Enable or disable RSI-based signals (default: enabled).
* RSI Period: Set the lookback period for RSI calculation (default: 14).
* RSI Overbought Level: Define the RSI level for overbought conditions (default: 70).
* RSI Oversold Level: Define the RSI level for oversold conditions (default: 30).
* RSI Timeframe: Specify the timeframe for RSI calculations (default: chart timeframe).
The RSI component triggers a buy signal when the RSI falls below the oversold level and a sell signal when it rises above the overbought level.
How It Works
Signal Logic
The indicator generates buy and sell signals based on the combined conditions of the enabled indicators:
* Buy Signal: Triggered when all enabled conditions are met (e.g., price below ATR support, price below EMA lower band, and RSI below oversold level).
* Sell Signal: Triggered when all enabled conditions are met (e.g., price above ATR resistance, price above EMA upper band, and RSI above overbought level).
If any indicator is disabled, its condition is ignored in the signal calculation, allowing traders to focus on specific indicators or combinations.
Visual and Alert Output
* When a signal is triggered, a label ("Buy" or "Sell") is plotted on the chart, and the corresponding candlestick is colored white.
* Alerts are available for integration with TradingView’s notification system, ensuring traders can act promptly on signals.
Usage Instructions
1. Add to Chart: Add the "Optimus Prime X Signals" indicator to your TradingView chart.
2. Configure Settings: Access the indicator’s settings to customize ATR, EMA, and RSI parameters, including periods, multipliers, thresholds, and timeframes.
3. Enable Alerts: Set up alerts for buy and sell signals through TradingView’s alert system for real-time notifications.
4. Analyze Signals: Monitor the chart for labeled signals and candlestick color changes to identify potential trading opportunities.
Notes for Traders
* Customization: Adjust the settings to align with your trading style, market, and timeframe. For example, increase the ATR multiplier for wider support/resistance zones or adjust the RSI levels for more or less frequent signals.
* Timeframe Flexibility: Use different timeframes for ATR, EMA, and RSI to capture multi-timeframe trends and improve signal accuracy.
* Risk Management: Always combine this indicator with proper risk management strategies, as no indicator guarantees profitable trades.
* Backtesting: Test the indicator on historical data to evaluate its performance in your chosen market and timeframe.
Limitations
* The indicator may generate false signals in choppy or sideways markets, as it relies on trend and momentum-based conditions.
* Signals are based on historical data and may lag in fast-moving markets.
* The maximum number of labels displayed is set to 500 to comply with TradingView’s limitations.
Conclusion
The Optimus Prime X Signals indicator is a powerful and user-friendly tool for traders seeking to combine ATR, EMA, and RSI signals into a cohesive trading strategy. Its customizable settings, clear visual feedback, and alert integration make it suitable for both novice and experienced traders. By providing flexibility in configuration and timeframe selection, it empowers users to adapt the indicator to various markets and trading styles.
For support or feedback, please contact the script author through TradingView’s messaging system.

Super MTF Clouds (4x3 Pairs)Overview:
This script is based on Ripster's MTF clouds, which transcends the standard moving average cloud indicator by offering a powerful and deeply customizable Multi-Timeframe (MTF) analysis. Instead of being limited to the moving averages of your current charts from the current timeframe, this tool allows you to project and visualize the trend and key support/resistance zones from up to 4 different timeframes simultaneously. User can input up to 6 different EMA values which will form 3 pairs of EMA clouds, for each of the timeframes.
The primary purpose is to provide traders with immediate confluence. By observing how price interacts with moving average clouds from higher timeframes (e.g., Hourly, Daily, Weekly), you can make more informed decisions on your active trading timeframe (e.g., 10 Minute). It's designed as a complete MTF Cloud toolkit, allowing you to display all necessary MTFs in a single script to build a comprehensive view of the market structure without having to flick to different timeframe to look for cloud positions.
Key features:
Four Independent Multi-Timeframe Slots: Each slot can be assigned any timeframe available on TradingView (e.g., D, W, M, 4H).
Three MA Pairs Per Timeframe: For each timeframe, configure up to three separate MA clouds (e.g., a 9/12 EMA pair, a 20/50 EMA pair, and a 100/200 SMA pair).
Complete Customisation: For every single moving average (24 in total), you can independently control:
MA Type: Choose between EMA or SMA.
Length: Any period you require.
Line Color: Full colour selection.
Line Thickness: Adjust the visual weight of each line.
Cloud Control: For every pair (12 in total), you can set the fill colour and transparency.
How To Use This Script:
This tool is best used for confirmation and context. Here are some practical strategies that one can adopt:
Trend Confluence: Before taking a trade based on a signal on your current timeframe, glance at the higher timeframe clouds. If you see a buy signal on the 15-minute chart and the price is currently trading above a thick, bullish Daily cloud, the probability of that trade succeeding is significantly higher. Conversely, shorting into strong HTF support is a low-probability trade.
Dynamic Support & Resistance: The edges of the higher timeframe clouds often act as powerful, dynamic levels of support and resistance. A pullback to the 4-Hour 50 EMA on your 15-minute chart can be a prime area to look for entries in the direction of the larger trend.
Gauging Market Regimes: Use the toggles in the settings to quickly switch between different views. You can have a "risk-on" view with short-term clouds and a "macro" view with weekly and monthly clouds. This helps you adapt your trading style to the current market conditions.
Key Settings:
1. Global Setting
Source For All MAs: This determines the price data point used for every single moving average calculation.
Default: hl2 (an average of the High and Low of each bar). This gives a smooth midpoint price.
Options: You can change this to Close (the most common method), Open, High, Low, or ohlc4 (an average of the open, high, low, and close), among others.
Recommendation: For most standard trend analysis, the default hl2 is the common choice.
2. The Timeframe Group Structure
The rest of the settings are organized into four identical, collapsible groups: "Timeframe 1 Settings" through "Timeframe 4 Settings". Each group acts as a self-contained control panel for one multi-timeframe view.
Within each timeframe group, you have two master controls:
Enable Timeframe: This is the main power switch for the entire group. Uncheck this box to instantly hide all three clouds and lines associated with this timeframe. This is perfect for quickly decluttering your chart or focusing on a different set of analyses.
Timeframe: This dropdown menu is the heart of the MTF feature. Here, you select the higher timeframe you want to analyse (e.g., 1D for Daily, 1W for Weekly, 4H for 4-Hour). All calculations for the three pairs within this group will be based on the timeframe you select here.
3. Pair-Specific Controls
Inside each timeframe group, there are three sections for "Pair 1", "Pair 2", and "Pair 3". These control each individual moving average cloud.
Enable Pair: Just like the master switch for the timeframe, this checkbox turns a single cloud and its two MA lines on or off.
For each pair, the settings are further broken down:
Moving Average Lines (A and B): These two rows control the two moving averages that form the cloud. 'A' is typically used for the shorter-period MA and 'B' for the longer-period one.
Type (A/B): A dropdown menu to select either EMA (Exponential Moving Average) or SMA (Simple Moving Average). EMAs react more quickly to recent price changes, while SMAs are smoother and react more slowly.
Length (A/B): The lookback period for the moving average (e.g., 21, 50, 200).
Color (A/B): Sets the specific colour of the MA line itself on your chart.
Cloud Fill Settings
Fill Color: This controls the colour of the shaded area (the "cloud") between the two moving average lines. For a consistent look, you can set this to the same colour as your shorter MA line.
Transparency: Controls how see-through the cloud is, on a scale of 0 to 100. 0 is a solid, opaque colour, while 100 is completely invisible. The default of 85 provides a light, "cloud-like" appearance that doesn't obscure the price action.
----------------------------------------------------------------------
If anything is not clear please let me know!

SAFE Leverage Pro x50Safe Leverage Pro x50 — Safe leverage based on timeframes
Description:
Safe Leverage Pro x50 is an indicator designed to help traders choose prudent and realistic leverage, tailored to the timeframe being traded and the asset chosen.
Based on rigorous statistical research, this indicator provides a visual recommendation of the maximum typical leverage by timeframe and automatically suggests a more conservative value (by default, half) for trading with greater peace of mind and risk control.
* The goal is not for the indicator to make decisions for you, but rather to support your pre-defined entry strategies, allowing you to clearly understand how much leverage you can use without compromising your account against normal price fluctuations.
*The indicator does not calculate based on real-time volatility or ATR, but rather relies on statistical historical patterns obtained by analyzing price behavior after entry, differentiating between average movements in long and short entries by timeframe.
Important: Before following the recommendations of this indicator, check the maximum leverage your broker or exchange allows for the asset you are trading, as it can vary significantly between platforms.
* Philosophy behind the indicator:
This project arises as a response to the simplistic discourse that condemns leverage without distinguishing nuances.
Leverage is not intrinsically bad. What is dangerous is leveraging without method, without awareness, and without risk management.
Safe Leverage Pro x50 is designed to change that narrative:
** It's not about whether or not to use leverage, but when, how much, and how to use it intelligently.

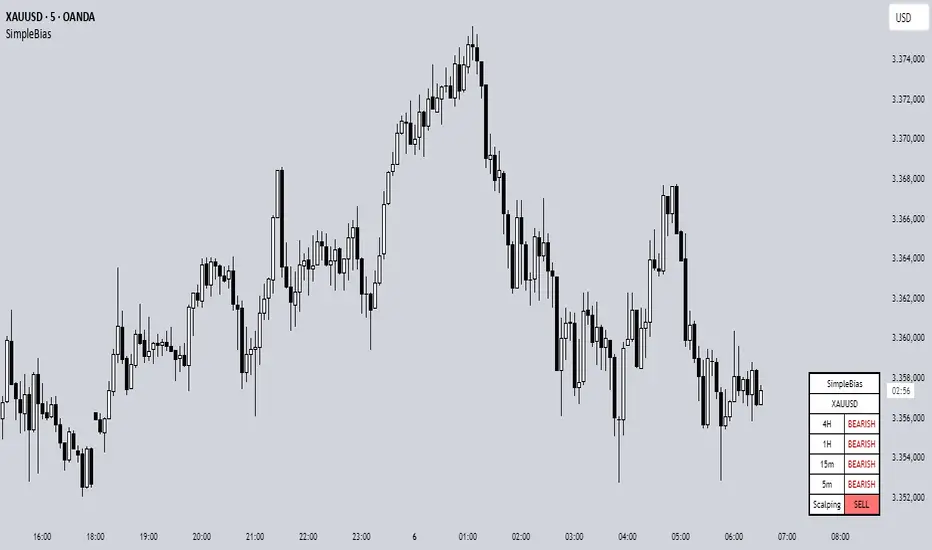
SimpleBiasSimpleBias - Multi-Timeframe Bias Analysis Indicator
Overview
SimpleBias is a comprehensive multi-timeframe bias analysis indicator designed to help traders make informed trading decisions by displaying market bias across multiple timeframes in a clean, organized table format.
Key Features
Multi-Timeframe Analysis
8 Timeframes Supported : 1M, 1W, 1D, 4H, 1H, 15m, 5m, 1m
Adaptive Display : Shows only relevant timeframes based on current chart timeframe
Real-time Bias Detection : Compares current open price with previous period's open price
Signal Generation
Day Trading Mode : Ideal for 15-minute timeframe analysis
Scalping Mode : Optimized for 5-minute timeframe trading
Signal OFF : Pure bias analysis without trade signals
Customization Options
Theme Support : Light mode and dark mode with automatic color adaptation
Position Control : Table can be positioned at top-right, middle-right, or bottom-right
Size Options : Tiny, small, or normal text size
Color Customization : Full control over bias colors, signal colors, and interface elements
Transparency : Optional transparent background for cleaner chart appearance
How It Works
Bias Calculation
The indicator determines market bias by comparing the current timeframe's open price with the previous period's open price:
BULLISH : Current open > Previous open
BEARISH : Current open < Previous open
NEUTRAL : Current open = Previous open
Adaptive Timeframe Display
The indicator intelligently shows only relevant timeframes based on your current chart:
On 1M chart: Shows 1M bias only
On 1W chart: Shows 1M, 1W bias
On 1D chart: Shows 1M, 1W, 1D bias
And so on...
Signal Logic
Day Trading : Compares current price with 4H open price
Scalping : Compares current price with 1H open price
Usage Instructions
Add to Chart : Apply the indicator to any timeframe chart
Configure Settings :
- Choose table position and text size
- Select signal mode (OFF/Day Trade/Scalping)
- Customize colors and theme
Interpret Results :
- Green/Blue text = Bullish bias
- Red text = Bearish bias
- Gray text = Neutral bias
Customization Guide
Theme Settings
Light Mode : Traditional white background with dark text
Dark Mode : Dark background with light text, optimized for dark charts
Transparent Background : Clean overlay without background color
Color Schemes
Bias Colors : Separate customization for bullish, bearish, and neutral bias
Signal Colors : Distinct colors for buy, sell, and neutral signals
Interface : Control table background and border colors
Best Practices
For Day Trading
Use 15-minute or 1-hour charts
Enable "Day Trade" signal mode
Focus on 4H and higher timeframe bias alignment
For Scalping
Use 5-minute charts
Enable "Scalping" signal mode
Watch for 1H and 4H bias alignment
For Swing Trading
Use 4H or daily charts
Keep signal mode OFF
Focus on weekly and monthly bias alignment
Important Notes
This indicator is for educational and analysis purposes only
Not financial advice - always do your own research
Past performance does not guarantee future results
Risk management is essential in all trading activities
Technical Specifications
Pine Script Version : v6
Overlay : True (displays on price chart)
Performance : Optimized with cached security requests
Compatibility : Works on all TradingView timeframes and instruments
---
SimpleBias - Indikator Analisis Bias Multi-Timeframe
Gambaran Umum
SimpleBias adalah indikator analisis bias multi-timeframe yang komprehensif, dirancang untuk membantu trader membuat keputusan trading yang tepat dengan menampilkan bias pasar di berbagai timeframe dalam format tabel yang bersih dan terorganisir.
Fitur Utama
Analisis Multi-Timeframe
8 Timeframe Didukung : 1M, 1W, 1D, 4H, 1H, 15m, 5m, 1m
Tampilan Adaptif : Hanya menampilkan timeframe yang relevan berdasarkan timeframe chart saat ini
Deteksi Bias Real-time : Membandingkan harga open saat ini dengan harga open periode sebelumnya
Mode Sinyal Trading
Mode Day Trading : Ideal untuk analisis timeframe 15 menit
Mode Scalping : Dioptimalkan untuk trading timeframe 5 menit
Mode OFF : Analisis bias murni tanpa sinyal trading
Opsi Kustomisasi
Dukungan Theme : Mode terang dan gelap dengan adaptasi warna otomatis
Kontrol Posisi : Tabel dapat diposisikan di kanan-atas, kanan-tengah, atau kanan-bawah
Opsi Ukuran : Ukuran teks kecil, sedang, atau normal
Kustomisasi Warna : Kontrol penuh atas warna bias, warna sinyal, dan elemen interface
Transparansi : Background transparan opsional untuk chart yang lebih bersih
Cara Kerja
Perhitungan Bias
Indikator menentukan bias pasar dengan membandingkan harga open timeframe saat ini dengan harga open periode sebelumnya:
BULLISH : Open saat ini > Open sebelumnya
BEARISH : Open saat ini < Open sebelumnya
NEUTRAL : Open saat ini = Open sebelumnya
Petunjuk Penggunaan
Tambahkan ke Chart : Terapkan indikator ke chart timeframe apapun
Konfigurasi Settings :
- Pilih posisi tabel dan ukuran teks
- Pilih mode sinyal (OFF/Day Trade/Scalping)
- Sesuaikan warna dan theme
Interpretasi Hasil :
- Teks hijau/biru = Bias bullish
- Teks merah = Bias bearish
- Teks abu-abu = Bias neutral
Best Practices
Untuk Day Trading
Gunakan chart 15 menit atau 1 jam
Aktifkan mode sinyal "Day Trade"
Fokus pada alignment bias timeframe 4H ke atas
Untuk Scalping
Gunakan chart 5 menit
Aktifkan mode sinyal "Scalping"
Perhatikan alignment bias 1H dan 4H
Catatan Penting
Indikator ini hanya untuk tujuan edukasi dan analisis
Bukan nasihat keuangan - selalu lakukan riset sendiri
Performa masa lalu tidak menjamin hasil masa depan
Manajemen risiko sangat penting dalam semua aktivitas trading
SimpleBias membantu trader mempertahankan kesadaran terhadap bias pasar di berbagai timeframe, mendukung timing dan pengambilan keputusan yang lebih baik dalam strategi trading mereka.
Cumulative Intraday Volume with Long/Short LabelsThis indicator calculates a running total of volume for each trading day, then shows on the price chart when that total crosses levels you choose. Every day at 6:00 PM Eastern Time, the total goes back to zero so it always reflects only the current day’s activity. From that moment on, each time a new candle appears the indicator looks at whether the candle closed higher than it opened or lower. If it closed higher, the candle’s volume is added to the running total; if it closed lower, the same volume amount is subtracted. As a result, the total becomes positive when buyers have dominated so far today and negative when sellers have dominated.
Because futures markets close at 6 PM ET, the running total resets exactly then, mirroring the way most intraday traders think in terms of a single session. Throughout the day, you will see this running total move up or down according to whether more volume is happening on green or red candles. Once the total goes above a number you specify (for example, one hundred thousand contracts), the indicator will place a small “Long” label at that candle on the main price chart to let you know buying pressure has reached that level. Similarly, once the total goes below a negative number you choose (for example, minus one hundred thousand), a “Short” label will appear at that candle to signal that selling pressure has reached your chosen threshold. You can set these threshold numbers to whatever makes sense for your trading style or the market you follow.
Because raw volume alone never turns negative, this design uses candle direction as a sign. Green candles (where the close is higher than the open) add volume, and red candles (where the close is lower than the open) subtract volume. Summing those signed volume values tells you in a single number whether buying or selling has been stronger so far today. That number resets every evening, so it does not carry over any buying or selling from previous sessions.
Once you have this indicator on your chart, you simply watch the “summed volume” line as it moves throughout the day. If it climbs past your long threshold, you know buyers are firmly in control and a long entry might make sense. If it falls past your short threshold, you know sellers are firmly in control and a short entry might make sense. In quieter markets or times of low volume, you might use a smaller threshold so that even modest buying or selling pressure will trigger a label. During very active periods, a larger threshold will prevent too many signals when volume spikes frequently.
This approach is straightforward but can be surprisingly powerful. It does not rely on complex formulas or hidden statistical measures. Instead, it simply adds and subtracts daily volume based on candle color, then alerts you when that total reaches levels you care about. Over several years of historical testing, this formula has shown an ability to highlight moments when intraday sentiment shifts decisively from buyers to sellers or vice versa. Because the indicator resets every day at 6 PM, it always reflects only today’s sentiment and remains easy to interpret without carrying over past data. You can use it on any intraday timeframe, but it works especially well on five-minute or fifteen-minute charts for futures contracts.
If you want a clear gauge of whether buyers or sellers are dominating in real time, and you prefer a rule-based method rather than a complex model, this indicator gives you exactly that. It shows net buying or selling pressure at a glance, resets each session like most intraday traders do, and marks the moments when that pressure crosses the levels you decide are important. By combining a daily reset with signed volume, you get a single number that tells you precisely what the crowd is doing at any given moment, without any of the guesswork or hidden calculations that more complicated indicators often carry.

Momentum Fusion v1Momentum Fusion v1
Overview
Momentum Fusion v1 (MFusion) is a multi-oscillator indicator that combines several components to analyze market momentum and trend strength. It incorporates modified versions of classic indicators such as PVI (Positive Volume Index), NVI (Negative Volume Index), MFI (Money Flow Index), RSI, Stochastic, and Bollinger Bands Oscillator. The indicator displays a histogram that changes color based on momentum strength and includes "FUSION🔥" signal labels when extreme values are reached.
Indicator Settings
Parameters:
EMA Length – Smoothing period for the moving average (default: 255).
Smoothing Period – Internal calculation smoothing parameter (default: 15).
BB Multiplier – Standard deviation multiplier for Bollinger Bands (default: 2.0).
Show verde / marron / media lines – Toggles the display of auxiliary lines.
Show FUSION🔥 label – Enables/disables signal labels.
Indicator Components
1. PVI (Positive Volume Index)
Formula:
pvi := volume > volume ? nz(pvi ) + (close - close ) / close * sval : nz(pvi )
Description:
PVI increases when volume rises compared to the previous bar and accounts for price percentage change. The stronger the price movement with increasing volume, the higher the PVI value.
2. NVI (Negative Volume Index)
Formula:
nvi := volume < volume ? nz(nvi ) + (close - close ) / close * sval : nz(nvi )
Description:
NVI tracks price movements during declining volume. If the price rises on low volume, it may indicate a "stealth" trend.
3. Money Flow Index (MFI)
Formula:
100 - 100 / (1 + up / dn)
Description:
An oscillator measuring money flow strength. Values above 80 suggest overbought conditions, while values below 20 indicate oversold conditions.
4. Stochastic Oscillator
Formula:
k = 100 * (close - lowest(low, length)) / (highest(high, length) - lowest(low, length))
Description:
A classic stochastic oscillator showing price position relative to the selected period's range.
5. Bollinger Bands Oscillator
Formula:
(tprice - BB midline) / (upper BB - lower BB) * 100
Description:
Indicates the price position relative to Bollinger Bands in percentage terms.
Key Lines & Histogram
1. Verde (Green Line)
Calculation:
verde = marron + oscp (normalized PVI)
Interpretation:
Higher values indicate stronger bullish momentum. A FUSION🔥 signal appears when the value reaches 750+.
2. Marron (Brown Line)
Calculation:
marron = (RSI + MFI + Bollinger Osc + Stochastic / 3) / 2
Interpretation:
A composite oscillator combining multiple indicators. Higher values suggest overbought conditions.
3. Media (Red Line)
Calculation:
media = EMA of marron with smoothing period
Interpretation:
Acts as a signal line for trend confirmation.
4. Histogram
Calculation:
histo = verde - marron
Colors:
Bright green (>100) – Strong bullish momentum.
Light green (>0) – Moderate bullish momentum.
Orange (<0) – Bearish momentum.
Red (<-100) – Strong bearish momentum.
Signals & Alerts
1. FUSION🔥 (Strong Momentum)
Condition:
verde >= 750
Visualization:
A "FUSION🔥" label appears below the chart.
Alert:
Can be set to trigger notifications when the condition is met.
2. Background Aura
Condition:
verde > 850
Visualization:
The chart background turns teal, indicating extreme momentum.
Usage Recommendations
FUSION🔥 Signal – Can be used as a long entry point when confirmed by other indicators.
Histogram:
1. Green bars – Potential long entry.
2. Red/orange bars – Potential short entry.
3. Media & Marron Crossover – Can serve as an additional trend filter.
4. Suitable for a 5-15 minute time frame
Conclusion
Momentum Fusion v1 is a powerful tool for momentum analysis, combining multiple indicators into a unified system. It is suitable for:
Trend traders (catching strong movements).
Scalpers (identifying short-term impulses).
Swing traders (filtering entry points).
The indicator features customizable settings and visual signals, making it adaptable to various trading styles.

MACD + RSI + EMA + BB + ATR Day Trading StrategyEntry Conditions and Signals
The strategy implements a multi-layered filtering approach to entry conditions, requiring alignment across technical indicators, timeframes, and market conditions .
Long Entry Requirements
Trend Filter: Fast EMA (9) must be above Slow EMA (21), price must be above Fast EMA, and higher timeframe must confirm uptrend
MACD Signal: MACD line crosses above signal line, indicating increasing bullish momentum
RSI Condition: RSI below 70 (not overbought) but above 40 (showing momentum)
Volume & Volatility: Current volume exceeds 1.2x 20-period average and ATR shows sufficient market movement
Time Filter: Trading occurs during optimal hours (9:30-11:30 AM ET) when market volatility is typically highest
Exit Strategies
The strategy employs multiple exit mechanisms to adapt to changing market conditions and protect profits :
Stop Loss Management
Initial Stop: Placed at 2.0x ATR from entry price, adapting to current market volatility
Trailing Stop: 1.5x ATR trailing stop that moves up (for longs) or down (for shorts) as price moves favorably
Time-Based Exits: All positions closed by end of trading day (4:00 PM ET) to avoid overnight risk
Best Practices for Implementation
Settings
Chart Setup: 5-minute timeframe for execution with 15-minute chart for trend confirmation
Session Times: Focus on 9:30-11:30 AM ET trading for highest volatility and opportunity

Open-Based Percentage Levelsv2
This is an updated version of my original script.
Changes:
I took off the displacement levels since there served no purpose on this script.
I also fixed it to where the percentage level lines are visible continually throughout the entire trading day. Old version had these lines disappearing.
I also updated the name to better reflect its purpose.
Now only works on 30 min and below as the higher time frames are meaningless. The older version allow higher time frames and the code is open source to adjust as desired

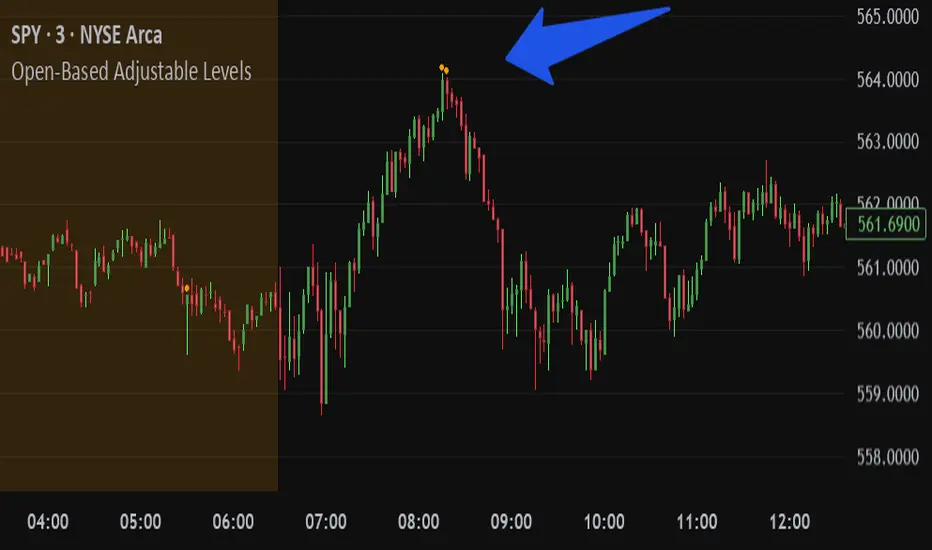
Open-Based Adjustable LevelsThis indicator gives signals for levels where the buy or sell volume is above adjustable levels (ex, volume at 100,000). And these levels will only signal after the price has gone above/below a certain 'adjustable' percentage of the stocks opening price.
Example: Signal sell when the price action is 0.7% above market opening price and when sell volume is above 120,000
or
Signal buy when buy volume is above 80,000 and the price is 0.5% below market opening price.
Great for day trading and detecting potential swings in the market. Above image is on a 3min chart.
Doesn't work as well on daily time frames or above.
Should be combined with other indicators like buy/sell channels, for the best confirmations
Multi VWAPsMulti VWAPs Inspired by Biran Shannon and his book:
"MAXIMUM TRADING GAINS WITH ANCHORED VWAP . The Perfect Combination of Price, Time & Volume."
(ISBN 9798986868004)
A comprehensive VWAP (Volume Weighted Average Price) indicator that combines multiple timeframes and sessions in one view. Perfect for day trading and swing trading across different markets.
Features:
• Multiple VWAP Timeframes:
- Daily VWAP
- Weekly VWAP
- Monthly VWAP
- Quarterly VWAP
- Yearly VWAP
• Session-specific VWAPs:
- London Session (3:00 AM - 11:30 AM NY time)
- New York Session (9:30 AM - 4:00 PM NY time)
• Additional Indicators:
- Midnight Price Line (Previous day's closing price)
- 5-Day Moving Average
- 50-Day Moving Average
• Customization Options:
- Toggle individual VWAPs and indicators
- Customize colors for each component
- Adjustable label positioning
- MA smoothing settings
- Option to show/hide previous day's midnight price
• Smart Features:
- Auto-adjusting calculations based on timeframe
- Clear session boundaries
- Optimized for all chart timeframes
- Clean label system
Perfect for:
• Day traders tracking multiple timeframe momentum
• Swing traders using longer-term VWAPs
• Session traders focusing on London/NY hours
• Multi-timeframe analysis
• Price action trading with VWAP support/resistance
This indicator combines essential trading tools in one clean interface, helping you make informed decisions without cluttering your chart.
Intraday Fibs RetracementFibonacci (Fibs) levels are often used by traders as a way to find support and resistance, based on the Fibonacci sequence. These levels are widely used in technical analysis to identify potential reversal points in the price of an asset.
Fibs retracement draws lines at these Fibs level between a significant high and low point on a price chart.
What it shows:
This indicator will automatically draw Fibs Retracement Levels on your chart without any manual work.
It is designed to be used for day trading, especially in scenarios where a ticker gaps up/down large compared to the prior day close. (i.e. scenario where the difference of day's open and prior day close is large)
The drawing will happen on each trading day the moment trading hours open, and will NOT draw during pre-market and post-market.
User can see the line of each Fibs level, labelled with the Fib percentage and price value for the corresponding levels.
User will specify a start and end point of Fibs and based on the choice the indicator will automatically compute the other user defined Fibs levels and display on the chart.
How to use it:
The Fib levels drawn can be a potential support and resistance zone. Therefore in scenario where you already have a position and are approaching one of these levels it could be a point to close out some or all the position as you are approaching a resistance. On the other hand when price do approach these levels you could enter a position for a reversal trade. These are few ways to use the indicator but there are other ways that can be used, which can be found out by researching "Fibonacci (Fibs) Retracement".
In the example on the chart you can see a price bounce from the 0.7886 Fibs level on this particular day, where the price gapped up and was coming down after market hours opened.
Key settings:
1. Fibs Retracement Start and end Point: User selects where the Fibs levels should be drawn.
Available Options are:
Start Points:
Market Open
Market Open High (Dependent on the time frame you are on)
Pre-market High
Day's High
End Points:
Previous Day Close
Previous Day Low
Previous Day High
Pre-market Low (Current Day)
Day's Low
2. Custom Fib Levels: User can manually enter the Fib levels they want to see. (Max 9)
Default values are: 0,0.236,0.382,0.5,0.618,0.786,1,1.618,2.618.
3. Display settings: User can specify the line colour, thickness and style.
4. Label Setting: User can choose to turn on/off the labels for the each Fibs Level. Label will show the fib percentage and the corresponding price. User can also choose the location of the labels, defined by an offset from the current candle.
----------------------------------------------------------------------
If anything is not clear please let me know!

SwingTrade VWAP Strategy[TiamatCrypto]V1.1This Pine Script® code creates a trading strategy called "SwingTrade VWAP Strategy V1.1." This strategy incorporates various trading tools, such as VWAP (Volume Weighted Average Price), ADX (Average Directional Index), and volume signals. Below is an explanation of the components and logic within the script:
### Overview of Features
- **VWAP:** A volume-weighted moving average that assesses price trends relative to the VWAP level.
- **ADX:** A trend strength indicator that helps confirm the strength of bullish or bearish trends.
- **Volume Analysis:** Leverages volume data to gauge momentum and identify volume-weighted buy/sell conditions.
- **Dynamic Entry/Exit Signals:** Combines the above indicators to produce actionable buy/sell or exit signals.
- **Customizable Inputs:** Inputs for tuning parameters like VWAP period, ADX thresholds, and volume sensitivity.
---
### **Code Breakdown**
#### **Input Parameters**
The script begins by defining several user-configurable variables under groups. These include indicators' on/off switches (`showVWAP`, `enableADX`, `enableVolume`) and input parameters for VWAP, ADX thresholds, and volume sensitivity:
- **VWAP Period and Threshold:** Controls sensitivity for VWAP signal generation.
- **ADX Settings:** Allows users to configure the ADX period and strength threshold.
- **Volume Ratio:** Detects bullish/bearish conditions based on relative volume patterns.
---
#### **VWAP Calculation**
The script calculates VWAP using the formula:
\
Where `P` is the typical price (`(high + low + close)/3`) and `V` is the volume.
- It resets cumulative values (`sumPV` and `sumV`) at the start of each day.
- Delta percentage (`deltaPercent`) is calculated as the percentage difference between the close price and the VWAP.
---
#### **Indicators and Signals**
1. **VWAP Trend Signals:**
- Identifies bullish/bearish conditions based on price movement (`aboveVWAP`, `belowVWAP`) and whether the price is crossing the VWAP level (`crossingUp`, `crossingDown`).
- Also detects rising/falling delta changes based on the VWAP threshold.
2. **ADX Calculation:**
- Calculates the directional movement (`PlusDM`, `MinusDM`) and smoothed values for `PlusDI`, `MinusDI`, and `ADX`.
- Confirms strong bullish/bearish trends when ADX crosses the defined threshold.
3. **Volume-Based Signals:**
- Evaluates the ratio of bullish volume (when `close > VWAP`) to bearish volume (when `close < VWAP`) over a specified lookback period.
---
#### **Trade Signals**
The buy and sell signals are determined by combining conditions from the VWAP, ADX, and volume signals:
- **Buy Signal:** Triggered when price upward crossover VWAP, delta rises above the threshold, ADX indicates a strong bullish trend, and volume confirms bullish momentum.
- **Sell Signal:** Triggered under inverse conditions.
- Additionally, exit conditions (`exitLong` and `exitShort`) are based on VWAP crossovers combined with the reversal of delta values.
---
#### **Plotting and Display**
The strategy plots VWAP on the chart and adds signal markers for:
- **Buy/Long Entry:** Green triangle below bars.
- **Sell/Short Entry:** Red triangle above bars.
- **Exit Signals:** Lime or orange "X" shapes for exits from long/short positions.
- Additionally, optional text labels are displayed to indicate the type of signal.
---
#### **Trading Logic**
The script's trading logic executes as follows:
- **Entries:**
- Executes long trades when the `buySignal` condition is true.
- Executes short trades when the `sellSignal` condition is true.
- **Exits:**
- Closes long positions upon `exitLong` conditions.
- Closes short positions upon `exitShort` conditions.
- The strategy calculates profits and visualizes the trade entry, exit, and running profit within the chart.
---
#### **Alerts**
Alerts are set up to notify traders via custom signals for buy and sell trades.
---
### **Use Case**
This script is suitable for day traders, swing traders, or algorithmic traders who rely on confluence signals from VWAP, ADX, and volume momentum. Its modular structure (e.g., the ability to enable/disable specific indicators) makes it highly customizable for various trading styles and financial instruments.
#### **Customizability**
- Adjust VWAP, ADX, and volume sensitivity levels to fit unique market conditions or asset classes.
- Turn off specific criteria to focus only on VWAP or ADX signals if desired.
#### **Caution**
As with all trading strategies, this script should be used for backtesting and analysis before live implementation. It's essential to validate its performance on historical data while considering factors like slippage and transaction costs.

AL Brooks - Price Action Multi-Signal Suite📘 Price Action Multi-Signal Suite📘
This indicator is a complete visual toolset for traders who use price action principles inspired by Al Brooks-style analysis.
It combines multiple nuanced signals — like first/second entries, breakout failures, trend bias, higher-timeframe context, and dynamic trend channels — into one elegant, customizable interface.
It is built with clarity, flexibility, and actionable precision in mind.
🧠 Core Concepts Behind the Tool
1. Trend Bias with EMA (20 by default)
The indicator calculates a standard EMA (default: 20) to establish trend direction bias.
When price is above EMA, we consider the market to be in a bull trend, and vice versa.
The EMA line changes color dynamically — green (bull), red (bear), gray (neutral).
🟢 Example:
If price is forming higher highs and staying above EMA with strong bull bars, the bias is bullish. In this phase, you're looking for High 1 and High 2 (H1/H2) setups.
2. First and Second Entries (H1/H2 and L1/L2)
High 1 (H1): First pullback in a bull trend after a minor new high.
High 2 (H2): A second attempt to push up after a failed H1.
Low 1 (L1) and Low 2 (L2): Mirror the above logic for bear trends.
📈 Example Trade – H2 Long:
Price breaks out above EMA.
Pulls back and forms an H1, but it fails to break out.
Second push (H2) forms a higher low, then closes strong above previous bar → BUY entry.
📉 Example Trade – L2 Short:
Market is below EMA.
A rally creates L1, fails.
L2 forms and closes below the previous bar low with a bear body → SELL entry.
3. Second Entry Logic (Simplified Swing Count)
This adds context to H2/L2 by ensuring at least two swings occurred in the same direction.
Reduces false signals in choppy markets.
Painted as colored circles (aqua = long, fuchsia = short).
4. Breakout Failure Detection
Detects false breakouts using 10-bar highs/lows:
Failed High Breakout: Price breaks a 10-bar high but closes back inside → potential reversal short.
Failed Low Breakout: Price breaks a 10-bar low but closes back inside → potential long.
🚨 Example:
Price breaks above a recent high but closes below it with a strong bear bar → look for reversal or fade setups.
5. Inside / Outside Bars
Helps recognize compression (inside bars) or volatility expansions (outside bars).
Inside bars often precede breakouts.
Outside bars may signal traps or indecision.
Use these in combination with entry logic. An H2 after an inside bar can signal a strong, clean breakout.
6. Higher Timeframe (HTF) Context
Pulls EMA and trend bias from a higher timeframe (default: 1hr).
Background color indicates HTF bias (adjustable opacity).
Green = HTF uptrend.
Red = HTF downtrend.
🧭 Usage: Trade in the direction of the HTF bias when possible. An H2 with HTF bias bullish adds confluence.
7. Trend Channels (Automatic, Visual)
Dynamically draws trend channel lines based on pivot highs/lows.
These act as support/resistance, visual guides for traps or continuation.
Trendline breakouts or touches often align with H2/L2 setups.
📏 Example:
Price touches lower channel and forms a second entry long (L2) with a strong bull bar → high-quality reversal trade.
⚙️ Customization Options
Toggle each signal component (entries, bias, bars, failures, channels).
Adjust EMA length, HTF resolution, background opacity.
Keep your chart clean and focused on the signals that matter to you.
📊 Trade Example Summary
H2 with HTF Bullish
Trade Setup: Strong bull bar after a failed H1, above EMA
Expected Move: Trend continuation upward
L2 with Channel Hit
Trade Setup: Pullback hits lower trend channel, forms L2
Expected Move: Reversal or scalp down
Failed High Breakout
Trade Setup: Price breaks above a 10-bar high, but reverses and closes inside
Expected Move: Quick fade or reversal short
Inside Bar + H2
Trade Setup: Price compresses into an inside bar, followed by a breakout with H2
Expected Move: Momentum breakout trade
Outside Bar + L2
Trade Setup: Price breaks strongly in one direction (outside bar), second push fails upward, forms L2
Expected Move: Short on weakness
Please note, this is an educational idea and representation of whatever I understood of it.
Historical performances may not be replicable in present/future.
Trade at your own responsibility.
Regards! ^^

Candlestick Pattern Indicator – Doji, Harami, More [algo_aakash]This Candlestick Pattern Indicator is designed to help traders identify key price action patterns like Bullish Engulfing, Bearish Engulfing, Doji, Hammer, Morning Star, Evening Star, and many more directly on your TradingView chart. With customizable options to display both bullish and bearish patterns , this indicator provides real-time visual markers and labels, helping you make informed trading decisions.
Key features of the indicator include:
Detects popular candlestick patterns such as Bullish Engulfing, Bearish Engulfing, Hammer, Morning Star, Tweezer Tops, and more.
Customizable settings for displaying pattern shapes, labels, and opacity, tailored to your trading preferences.
Option to plot signals only after a candle closes, ensuring accuracy.
Alerts for immediate notification of detected patterns.
Visual markers on the chart, including arrows and labels, for quick recognition of potential trade setups.
This indicator is ideal for traders who rely on candlestick patterns for technical analysis and want an automated tool to highlight these setups for easier decision-making.
Whether you're a beginner or an experienced trader, this tool will help you spot important patterns in real-time without cluttering your chart.

Intraday LevelsWhat it shows:
This indicator is useful for day trading, where it will track and display you important price levels which includes:
Premarket Low (PML)
Premarket High (PMH)
Previous Day Low (PDL)
Previous Day High (PDH)
Previous Day Close (PDC)
After Hours Low (AHL)
After Hours High (AHH)
Day Low (DL)
Day High (DH)
The price level lines and labels will automatically adjust itself as the price moves, eliminating the need of manually having to adjusting these levels.
How to use it:
At these levels it can act as important support resistance points during the day and can often serve as a important pivot point for any ticker. You can expect price rejection or bounce when the price approaches these levels.
Key settings:
For each of the levels, user can adjust in the settings menu:
Line Colour
Line Thickness
Line Style
Label Text
Price Labelling on Label
Label Location (Offset from current bar)
Ability to turn on/off the price level and label
Display levels for either all days or on the day

Hourly Volatility Explorer📊 Hourly Volatility Explorer: Master The Market's Pulse
Unlock the hidden rhythms of price action with this sophisticated volatility analysis tool. The Hourly Volatility Explorer reveals the most potent trading hours across multiple time zones, giving you a strategic edge in timing your trades.
🌟 Key Features:
⏰ Multi-Timezone Analysis
• GMT (UTC+0)
• EST (UTC-5) - New York
• BST (UTC+1) - London
• JST (UTC+9) - Tokyo
• AEST (UTC+10) - Sydney
Perfect for tracking major market sessions and their overlaps!
📈 Dynamic Visualization
• Color-gradient hourly bars for instant pattern recognition
• Real-time volatility comparison
• Interactive data table with comprehensive statistics
• Automatic highlighting of peak volatility periods
🎯 Strategic Applications:
Day Trading:
• Identify optimal trading windows
• Avoid low-liquidity periods
• Capitalize on session overlaps
• Fine-tune entry/exit timing
Risk Management:
• Set appropriate stop losses based on hourly volatility
• Adjust position sizes for different market hours
• Optimize risk-reward ratios
• Plan around high-impact hours
Global Market Analysis:
• Track volatility across all major sessions
• Spot institutional trading patterns
• Identify quiet vs. active periods
• Monitor 24/7 market dynamics
💡 Perfect For:
• Forex traders navigating global sessions
• Crypto traders in 24/7 markets
• Day traders optimizing execution times
• Algorithmic traders fine-tuning strategies
• Risk managers calibrating exposure
📊 Advanced Features:
• Rolling 3-month analysis for reliable patterns
• Precise pip movement calculations
• Sample size tracking for statistical validity
• Real-time current hour comparison
• Color-coded visual system for instant insights
⚡ Pro Trading Tips:
• Use during major session overlaps for maximum opportunity
• Compare patterns across different instruments
• Combine with volume analysis for deeper insights
• Track seasonal variations in hourly patterns
• Build trading schedules around peak hours
🎓 Educational Value:
• Understand market microstructure
• Learn global market dynamics
• Master timezone relationships
• Develop timing intuition
🛠️ Customization:
• Adjustable lookback period
• Flexible pip multiplier
• Multiple timezone options
• Visual preference settings
Whether you're scalping the 1-minute chart or managing longer-term positions, the Hourly Volatility Explorer provides the precise timing intelligence needed for today's global markets.
Transform your trading schedule from guesswork to science. Know exactly when markets move, why they move, and how to position yourself for maximum opportunity.
#TechnicalAnalysis #Trading #Volatility #MarketTiming #DayTrading #Forex #Crypto #TradingView #PineScript #MarketAnalysis #TradingStrategy #RiskManagement #GlobalMarkets #FinancialMarkets #TradingTools #MarketStructure #PriceAction #Scalping #SwingTrading #AlgoTrading

Daily Movement AnalysisDaily Volatility Explorer: 7-Day Market Pulse Indicator
Unlock the hidden rhythms of market movements with this powerful analytical tool designed for both traditional and crypto traders. This indicator meticulously tracks and analyzes price volatility patterns across all seven days of the week, giving you a strategic edge in planning your trades.
🎯 Key Features:
• Dynamic 3-month rolling analysis of daily price movements
• Real-time volatility comparison across all trading days
• Clear visual representation through color-coded bar charts
• Detailed statistical table with exact pip movements
• Sample size tracking for statistical reliability
• Works seamlessly on both traditional and crypto markets
💡 Why Traders Need This:
1. Optimal Trade Timing
- Identify the most volatile trading days for maximum opportunity
- Discover the quietest days to avoid choppy markets
- Perfect for swing traders and day traders alike
2. Risk Management Enhancement
- Set smarter stop-losses based on typical daily ranges
- Adjust position sizes according to daily volatility patterns
- Avoid overtrading during historically low-volatility periods
3. Strategic Planning
- Plan your trading week around peak volatility days
- Optimize entry and exit points based on historical movements
- Better time management by focusing on the most active days
4. Market Psychology Insights
- Understand weekly market rhythm and institutional patterns
- Identify how weekend gaps affect crypto markets
- Spot changes in market behavior across different days
🔍 Perfect For:
• Forex traders tracking major currency pairs
• Crypto traders navigating 24/7 markets
• Gold and commodity traders
• Day traders optimizing their trading schedule
• Swing traders planning optimal entry/exit days
📊 Data-Driven Decisions:
The indicator maintains a rolling 3-month window of data, providing fresh, relevant insights while filtering out outdated patterns. Each day's analysis is based on actual market movements, giving you reliable, actionable intelligence for your trading decisions.
⚡ Pro Tip: Use this indicator alongside your existing strategy to enhance your trading plan and improve your timing. The color-coded visual system makes it easy to spot patterns at a glance, while the detailed statistics table provides the hard numbers you need for precise planning.
Remember: Markets evolve, and this indicator helps you stay on top of changing patterns in real-time. Whether you're trading traditional markets or crypto, understanding daily volatility patterns is crucial for consistent trading success.

Orion Daily Bias v1What It Does
The Daily Bias Indicator identifies the daily market bias (bullish or bearish) using principles inspired by institutional trading activity. It analyses daily price action to detect imbalances caused by large market participants, providing a clear directional bias for the upcoming trading day.
Key Features
Daily Bias Signals:
Displays "Daily Bias: Bullish" (green) or "Daily Bias: Bearish" (red) in the top-right corner of your chart.
Colors daily candles to reflect the current bias (toggle on/off).
Non-Repainting:
Signals finalize only at market close and never change retroactively.
Intraday Flexibility:
Use the daily bias to align intraday strategies (e.g., 15-minute entries) with the broader trend.
Custom Alerts:
Receive alerts only when the bias changes (e.g., bullish to bearish). Alerts trigger at market close, preparing you for the next trading day.
How It Works
Market Close Analysis:
At the end of each trading day, the indicator evaluates price action and institutional-level inefficiencies to determine the next day’s bias.
Visual Guidance:
Daily candles are coloured green (bullish) or red (bearish) to reflect the confirmed bias.
A label in the top-right corner updates automatically across all timeframes.
Actionable Alerts:
Set alerts to notify you only when the bias shifts, helping you stay focused on high-probability setups.
Why Traders Use It
Simplify Decision-Making: Start each day with a clear bias, avoiding trades against institutional momentum.
Adaptable to Strategies: Works with scalping, swing trading, or position building.
Rule-Based Signals: Objective criteria finalize at market close.
Settings & Parameters
Candle Colouring: Enable/disable daily candle highlights.
Daily bias label: Turn the daily bias label on and off
Alerts: Setting an alert with this indicator will only alert you if a bias changes from bullish to bearish or vice versa.
How to Use It
Add the indicator to your chart (works on any timeframe).
Check the top-right label for the daily bias.
Set alerts to track bias changes effortlessly.
Combine with your preferred intraday strategy for entries/exits.
Important Notes
No Repainting: Signals lock in at daily close and never change.
Confirmation Tool: Pair with additional analysis (e.g., support/resistance, volume).
Time Agnostic: The daily bias applies to all intraday timeframes (1H, 15M, etc.).
Disclaimer
This tool is for educational purposes only. It is not financial advice, and past performance does not guarantee future results. Always test strategies in a risk-controlled environment.

Destroyer LifeDestroyer Life Strategy - High-Frequency Long & Short Trading
Overview:
The Destroyer Life strategy is an advanced cryptocurrency trading algorithm designed for high-frequency execution on the 15-second timeframe. It combines CRT (Candle Range Trend) and Turtle Soup trading logic with multi-timeframe analysis to optimize entries and exits for both long and short trades. This strategy is specifically optimized for high-volatility crypto pairs, such as SOL/USD on MEXC, ensuring precise execution with minimal drawdown.
Key Features:
15-Second Timeframe Execution: Optimized for ultra-short-term trading.
Long & Short Strategy: Simultaneously identifies profitable buy and sell opportunities.
CRT & Turtle Soup Logic: Leverages price action patterns for enhanced trade accuracy.
Higher Timeframe Analysis (HTF): Incorporates liquidity zones, fair value gaps (FVG), and breaker blocks for context-aware trading.
Dynamic Position Sizing: Uses an adjustable leverage multiplier for risk-controlled trade sizing.
Commission Optimization: Ensures profitability even with trading fees.
Strict Risk Management: Implements exit conditions based on liquidity structure and trend reversals.
Strategy Performance (Backtested on SOL/USD - MEXC):
Overall Profitability: ~80% win rate in backtesting.
Net Profit: $3,151.12 (6.30% ROI).
Gross Profit: $3,795.68 (7.59%).
Gross Loss: $644.56 (1.29%).
Long Trades Profit: $1,459.05 (2.92%).
Short Trades Profit: $1,692.07 (3.38%).
Commission Paid: $924.82.
Minimum Trade Holding Period: 1-minute cooldown between trades.
Trading Logic:
Entry Conditions:
Long Trades: Triggered when the price enters a liquidity void and aligns with higher timeframe bullish bias.
Short Trades: Triggered when price approaches a resistance level with bearish higher timeframe confluence.
CRT & Turtle Soup Patterns: Identifies reversals by analyzing breakout and fake-out structures.
Exit Conditions:
Long Positions Close: Upon price exceeding a 3.88% profit threshold or reversing below an HTF structure.
Short Positions Close: Upon reaching a similar 3.88% threshold or showing strong bullish signals.
Dynamic Position Sizing:
Uses a leverage-based calculation that adapts trade size based on volatility.
Liquidity Awareness:
Tracks Mitigation Blocks (MB), Fair Value Gaps (FVG), Buy/Sell-Side Liquidity (BSL/SSL) to determine optimal execution.
Best Use Cases:
Scalpers & High-Frequency Traders: Those looking for rapid trade execution with short holding periods.
Crypto Traders Focused on Low Timeframes: Optimized for 15-second price action.
Traders Utilizing Liquidity Concepts: Built to exploit liquidity traps and inefficiencies.
Risks & Considerations:
High-Frequency Execution Requires Low Latency: Ensure your broker or exchange supports fast order execution.
Backtested Results May Vary: Real-time performance depends on market conditions.
Commission & Fees Impact Profits: Consider exchanges with low fees to maximize strategy efficiency.
Final Thoughts:
The Destroyer Life Strategy is designed for serious traders looking to take advantage of high-volatility markets with a structured, liquidity-based approach. By combining price action, liquidity concepts, and adaptive risk management, it provides a solid framework for executing high-probability trades on crypto markets.
🚀 Ready to take your trading to the next level? Try Destroyer Life today and dominate the markets!

Ultimator's bottom finder 2.0This indicator is intended to find local bottoms on certain stocks like GME and SPY.
It is only designed to be effective on a few select stocks and will be useless on others.
The bottom finder attempts to find bottoms by using a unique algorithm I developed, which creates a baseline for what the stock "should" look like vs. what it actually looks like.
Since the algorithm was created to mimic GME price action, it will not work as intended on stocks that trade vastly differently. On stocks other than GME (and SPY) you need to test it for yourself to see if it has any functionality.
Large deviations in the actual price vs baseline price create a spike on the indicator with the magnitude of the spike being the guesstimated deviation. This is intended to show options and swap hedging, which coincidentally tend to coincide with local bottoms on the chart. The indicator creates a highlight when it believes it has found a local bottom. It also changes the color of the line based on the magnitude of the spike.
I added a second line, which performs a similar mechanic, so there are two separate baselines running concurrently. The deviation between the two is shown as a shaded area between the lines.
The indicator doesn't (yet) include after hours functionality, and simply zeroes out at close and before open. Because of this, only short timeframes and long timeframes result in any meaningful data.
Optimized for 1 min and 1 day timeframes.
Alerts are set for when the line turns red and when the indicator highlights. These can be toggled in the alerts menu.

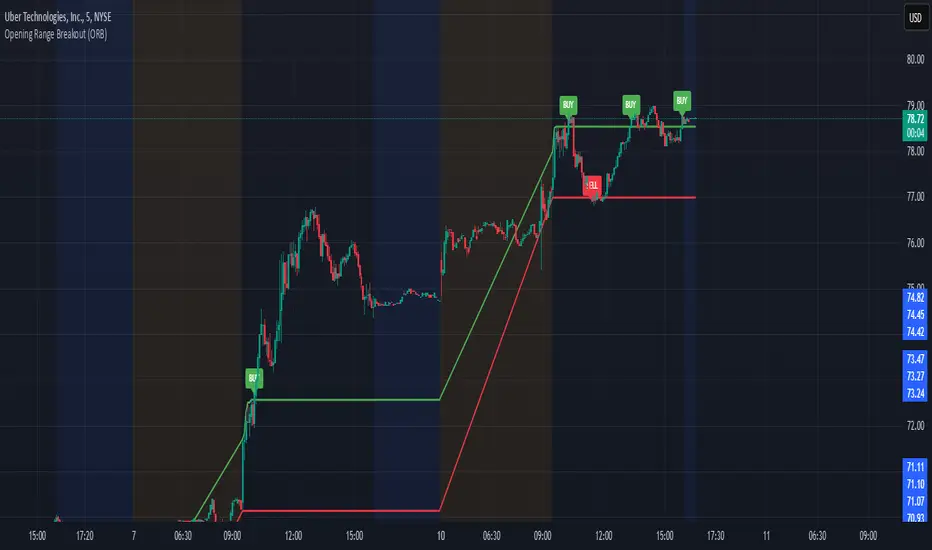
Opening Range Breakout (ORB)This is an Opening Range Break indicator. Best if used on a 5 minute chart. It plots the opening 30 minutes high and low of a ticker. (meaning mostly for stocks, options, etfs) and then it alerts a buy signal upon break of opening high and a sell signal upon break of opening low. This is a day trading type of indicator and there is a new opening range everyday.