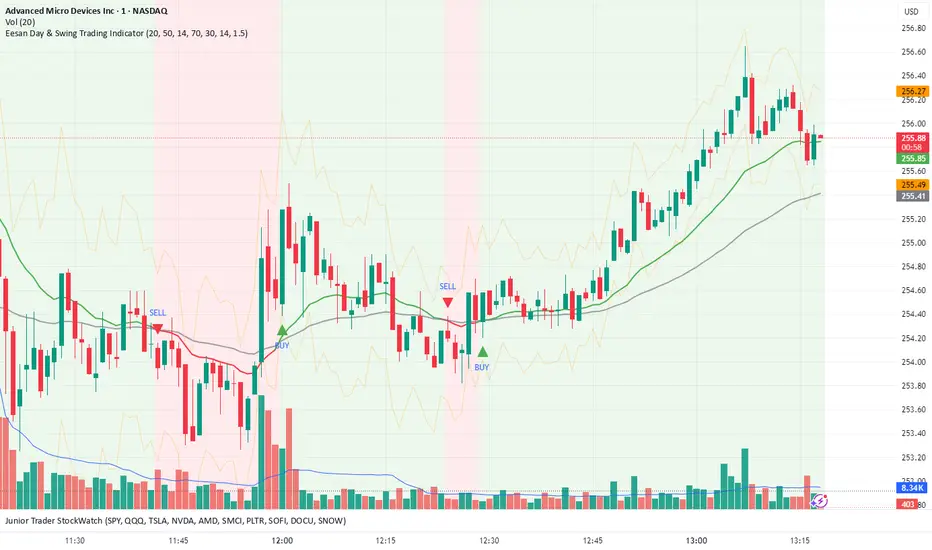
High of Day Low of Day hourly timings: Statistics. Time of day %High of Day (HoD) & Low of Day (LoD) hourly timings: Statistics. Time of day % likelihood for high and low.
//Purpose:
To collect stats on the hourly occurrences of HoD and LoD in an asset, to see which times of day price is more likely to form its highest and lowest prices.
//How it works:
Each day, HoD and LoD are calculated and placed in hourly 'buckets' from 0-23. Frequencies and Percentages are then calculated and printed/tabulated based on the full asset history available.
//User Inputs:
-Timezone (default is New York); important to make sure this matches your chart's timezone
-Day start time: (default is Tradingview's standard). Toggle Custom input box to input your own custom day start time.
-Show/hide day-start vertical lines; show/hide previous day's 'HoD hour' label (default toggled on). To be used as visual aid for setting up & verifying timezone settings are correct and table is populating correctly).
-Use historical start date (default toggled off): Use this along with bar-replay to backtest specific periods in price (i.e. consolidated vs trending, dull vs volatile).
-Standard formatting options (text color/size, table position, etc).
-Option to show ONLY on hourly chart (default toggled off): since this indicator is of most use by far on the hourly chart (most history, max precision).
// Notes & Tips:
-Make sure Timezone settings match (input setting & chart timezone).
-Play around with custom input day start time. Choose a 'dead' time (overnight) so as to ensure stats are their most meaningful (if you set a day start time when price is likely to be volatile or trending, you may get a biased / misleadingly high readout for the start-of-day/ end-of-day hour, due to price's tendency for continuation through that time.
-If you find a time of day with significantly higher % and it falls either side of your day start time. Try adjusting day start time to 'isolate' this reading and thereby filter out potential 'continuation bias' from the stats.
-Custom input start hour may not match to your chart at first, but this is not a concern: simply increment/decrement your input until you get the desired start time line on the chart; assuming your timezone settings for chart and indicator are matching, all will then work properly as designed.
-Use the the lines and labels along with bar-replay to verify HoD/LoD hours are printing correctly and table is populating correctly.
-Hour 'buckets' represent the start of said hour. i.e. hour 14 would be populated if HoD or LoD formed between 14:00 and 15:00.
-Combined % is simply the average of HoD % and LoD %. So it is the % likelihood of 'extreme of day' occurring in that hour.
-Best results from using this on Hourly charts (sub-hourly => less history; above hourly => less precision).
-Note that lower tier Tradingview subscriptions will get less data history. Premium acounts get 20k bars history => circa 900 days history on hourly chart for ES1!
-Works nicely on Btc/Usd too: any 24hr assets this will give meaningful data (whereas some commodities, such as Lean Hogs which only trade 5hrs in a day, will yield less meaningful data).
Example usage on S&P (ES1! 1hr chart): manual day start time of 11pm; New York timezone; Visual aid lines and labels toggled on. HoD LoD hour timings with 920 days history:
Daytrading
Pro ScalperOverview
The Pro Scalper indicator is a powerful day trading tool designed specifically for the 30-minute timeframe, catering to stock and cryptocurrency markets. It provides traders with buy and sell signals, dynamic overbought/oversold zones, and reversal signal indicators. By combining a Kalman-adapted Supertrend calculation for buy and sell signals, and VWMA bands to determine overbought/oversold zones, this indicator aims to assist traders in identifying potential trading opportunities for scalping and day trading strategies using trend-following and mean-reverting methods. This combination of Kalman Filtering with an adapted Supertrend seeks to mitigate false signals, filter out market noise, and aims to provide traders with more reliable buy and sell indications.
Features
Buy and Sell Signals: Pro Scalper generates buy and sell signals based on a Kalman-adapted Supertrend calculation. These signals help traders identify potential entry and exit points in the market.
Dynamic Overbought/Oversold Zones: The indicator dynamically calculates overbought and oversold zones using VWMA bands. These zones provide valuable insights into potential price exhaustion levels, aiding traders in managing risk and identifying potential reversals.
Reversal Signals (R Labels): The indicator includes "R" labels that indicate potential reversal signals. These signals are based on the overbought/oversold zones calculated with VWMA bands. The appearance of an "R" label suggests a possible price reversal, offering traders an additional tool for decision-making.
Calculations
This indicator stands out as a unique tool due to unique Kalman filtering and altered Supertrend calculation, as well as its combination of specific features. This indicator combines the following calculations to provide its features:
Kalman Filter: The indicator employs a Kalman Filter to adapt the Supertrend calculation. This calculation was based on mathematical equations derived from Rudolf E. Kalman. This Kalman Filter helps smooth out price data, reducing noise and removing outliers from data.
Supertrend Calculation: This particular supertrend possesses alterations to price series data and ATR calculations in an aim to improve signal accuracy. Additionally, the calculation uses Kalman-filtering within the calculation to provide a powerful framework to handle uncertainties, noise, and changing conditions.
VWMA Bands: VWMA (Volume-Weighted Moving Average) bands are calculated using the highest high and lowest low values with specified multipliers. These bands are used to determine the dynamic overbought and oversold zones, giving traders insights into potential price exhaustion levels. These are included with the aim to adapt to changing market conditions and price data. This adaptability allows the zones to accurately reflect the current price volatility and trend.
Utility
This tool provides traders with valuable information for scalping and day trading strategies in the 30-minute timeframe. It helps traders by:
Generating buy and sell signals, indicating potential entry and exit points.
Calculating dynamic overbought/oversold zones, enabling traders to identify potential price exhaustion levels.
Displaying "R" labels to highlight potential reversal signals.
Offering optional alerts for reversal signals, buy/sell signals, allowing traders to stay updated even when they're not actively monitoring the charts.
Remember, past performance does not guarantee future performance. Traders should utilize this indicator as part of a comprehensive trading strategy and exercise their own judgment when making trading decisions.
DJ Soori Trading StrategyThe strategy combines three indicators: Exponential Moving Average (EMA), Weighted Moving Average (WMA), and Average Directional Index (ADX).
The EMA and WMA are used to track the average price over different time periods.
The ADX measures the strength of a trend in the market.
The strategy generates buy signals when the EMA is higher than the WMA and the ADX is above a certain threshold. It suggests a potential uptrend.
It generates sell signals when the EMA is lower than the WMA and the ADX is above the threshold. It suggests a potential downtrend.
The strategy also considers whether the ADX is rising or falling to indicate the strength of the trend.
The EMA, WMA, and ADX values are plotted on the chart.
Buy and sell signals are shown as labels on the chart, indicating "Buy (Strong)" or "Buy (Weak)" for buy signals, and "Sell (Strong)" or "Sell (Weak)" for sell signals.
AWD TRADE MANAGER (ATM) by ManhDNAWD TRADE MANAGER (ATM) is a position management tool including with some advanced features and entry suggestions. It helps you to do most of position calculations and position management, reduce time spent for charting by alerts.
There are 3 main things to describe about the manager:
(1) The original function of the manager is to help traders to manage their trades with automatic calculations of all factors of their trades with some of input values. For example, it will calculate the trade volume when you enter the bet size, entry and stop loss price. It calculates take profit price when you enter entry, stop loss prices and the risk/reward ratio, …
(2) Another function is the system of alerts. After set up a trade, create an alert and the manager will do the rest. It will send you an alert when the limit order got filled, got stopped out, take profit level hit, or even it reached a key level or an opposite/spike move just occurred…
(3) Entry suggestions: Suggest entries with price action strategies. Details bellow.
Features in details:
(1) Automatic calculations:
- Auto calculate trade volume based on entry, stop loss prices and the money users willing to lose when the trade is failed. Auto detect some type of assets and volume will be calculated in USD (for cryptocurrencies) or in lot (for forex).
- Auto calculate take profit price based on entry, stop loss prices and expected rr ratio.
-Auto suggest take profit price based on pivot points.
- Auto suggest stop loss price based on pivot points.
- You can enter several exit points with percentages and the manager will calculate the averaged risk reward ratio you earned after the last exit price reached.
- Quick entry price pick to reduce typing requirement.
- Quick trade set up: 2 checkboxes and 1 number entering to set up a trade.
(2) Alert system
After setting up a trade and creating an alert of the manager, it will follow the market and your order. It will send you alerts for all the events that you should follow up your position. These alerts can be sent to your pc, your phone and your smart watch, so even you are a full-time day trader, you will save your time for charting or managing your positions. Here’s the list of alerts:
- Sending alert when suggesting an entry with details calculated from preset inputs so you can just pick that info to enter the position including trading volume, entry, stop loss, take profit prices, timeframe, estimated risk-reward ratio …
- Sending alert when a limit order got filled and auto switch to position-managing-mode.
- Sending alert when a limit order in still staying unfilled but should be canceled (because of price reaching a key level or is running too far, …)
- Sending alert when the position got stopped out or TP hit.
- Sending alert when the running position reached a key level and need to be watched out.
- Sending alert when a spike move or opposite move just occurred.
- Sending alert when a position is taking too long to run.
- You can also set 3 levels of price with messages then ATM will send you alerts when price reaches those levels.
- When price runs, ATM might suggest you to move stop loss to levels based on pivot points by sending you alerts.
- Alert when a BOS occurred.
- Options to turn on/off each kind of alert.
(3) Entry suggestions.
The script included price action entry suggestions.
The 1st strategy is getting in a position when a candle pattern occurred and confirmed by MA20.
The 2nd strategy is detecting double top/bottom and a candle pattern confirm break out after that.
The 3rd strategy is a pullback strategy, in a trending market, a candle pattern occurs and confirms the pullback ends, it will suggest an entry.
All those strategies I am using by myself for a long period of time but to make sure they are good for your trading style, do your own research and backtest before use. Keep in mind to manage risk and be responsible to your capital.
User side modifications:
- Those price action strategies have some major arguments that users can tune themselves to make it meet their style or their needs like choosing method to suggest entries, refine entry quality by changing the confirmation methods,…
- Most of appearance factors can be changed by users.
- one-click to toggle between full features and simple mode.
TradingView Chart demo pictures:
Author's bio:
I have been a full-time day trader for 7 years. I like coding with Pinescript and I also developed some helpful indicators that provide unique aspects to approach markets and the most favorite one from that is Relative Volume Index (RVI) that will be introduced in near future.
Disclaimer:
This tool has been tested and been using for my own trading career for a long period of time but practicing to use it yourself to understand it and use it correctly is needed. All of the features have been carefully tested before publishing but make sure to double-check all the info you get from it before getting into a trade to avoid losing money by a sudden mistake or even a bug. Keep in mind you will need to take all the responsibility with your capital or any potential loss while using this tool.
If you get anything wrong while using it, please leave some comments bellow, all of your ideas or suggestions will be taken seriously.
Thank you in advance!
(It is not possible to explain all the settings or features within the description, If you have questions, please leave comment, I will answer to help you to get familiar with the tool.)
Effortless ContinuationIntroduction:
The Effortless Continuation Indicator is a technical analysis tool designed for traders to identify potential buy and sell signals in the market. This indicator combines three popular technical indicators - Moving Average Convergence Divergence (MACD), Triple Exponential Moving Average (TEMA), and Double Exponential Moving Average (DEMA) - to generate buy and sell signals. It is suitable for use on any time frame, from intraday trading to swing trading and longer-term investing.
Indicator Components:
The indicator comprises of three main components: MACD, TEMA, and DEMA.
Moving Average Convergence Divergence (MACD):
The MACD is a momentum indicator that measures the difference between two moving averages of the price of an asset. It is calculated by subtracting the 26-period Exponential Moving Average (EMA) from the 12-period EMA. The MACD line is used to identify changes in momentum, trends, and potential buy and sell signals.
Triple Exponential Moving Average (TEMA):
The TEMA is a type of Moving Average that takes multiple EMA values and applies a triple smoothing to them. This allows the TEMA to react more quickly to changes in price trends than traditional moving averages. The TEMA line is used as an additional confirmation for potential buy and sell signals.
Double Exponential Moving Average (DEMA):
The DEMA is similar to the TEMA but applies double smoothing to the EMA values. It is used as a signal line to confirm buy and sell signals generated by the MACD and TEMA.
Signal Generation:
The Effortless Continuation Indicator generates buy and sell signals based on the crossover and crossunder of the MACD and DEMA lines, as well as the price being above or below the TEMA line. Long signals are generated when the MACD crosses above the DEMA and the price is above the TEMA. Short signals are generated when the MACD crosses below the DEMA and the price is below the TEMA.
Chop Sensitivity:
The indicator has a user-adjustable "Chop Sensitivity" setting, which allows traders to adjust the ATR sensitivity for long and short signals. ATR is a volatility indicator that measures the average range of price movements over a given period of time. The default value is set to 0.5 ATR, which means that long and short signals will not be generated if the price is within 0.5 ATR of the TEMA.
Alerts:
The Effortless Continuation Indicator has built-in alerts for both long and short signals. It also includes a single alert that will trigger for both long and short signals. This allows traders to stay informed of potential trading opportunities even when they are not actively monitoring the markets.
Conclusion:
The Effortless Continuation Indicator is a powerful technical analysis tool that can help traders identify potential buy and sell signals in the market. It is easy to use and can be customized to suit individual trading styles and preferences. It is important to note that this indicator does not predict the market, but rather provides potential signals that should be confirmed with additional technical and fundamental analysis. With its advanced signal generation and alert features, the Effortless Continuation Indicator can be a valuable addition to any trader's toolbox.
Typical Sweeps: Pivot high/low boxes. Grade sweeps, Handles/PipsTool to show typical pip-grade/ handle-grade sweep distance above pivot highs and pivot lows
-In consolidation/ranging periods (i.e. most of the time); Highs/Lows may by swept by fairly consistent distances in typical stop raids.
-Idea is from ICT teaching on typical Pip-grade sweeps in FX (10,20,30pips). Designed to work on FX, Indices, Commodities, Bitcoin.
-Above chart shows S&P; sweeping below and then above by 5 handles.
///inputs///
~choose sweep distance handles ($) or pips: will auto-calculate depending on the asset: FX= pips; Indices/stocks/commodities = handles ($)
--(2,5,10,20,30,50,100, 500, 1000)
~choose pivot lookback: larger number for more significant swing highs/lows
~choose number of historical boxes to display
~toggle on/off Pivot high boxes and Pivot low boxes independently
~extend boxes fully to the right (default is not extend)
~toggle on/off text
~text & box formatting options
Bitcoin, hourly chart; Pivot lookback = 15; $100 sweep boxes:
Eur/Usd; 15m chart; Pivot lookback = 30; 10pip sweep boxes; Boxes extended fully to the right:
Jerry J8 30-123 Spy Dashboard ProPlease watch the J8 Scalping Tutorial Video below for a walkthrough on how these indicators work.
This script is used in conjunction with Jerry J8 30-123 SPY Scalping PRO” Indicator(which creates the buy and sell orders as a strategy). The Dashboard shows the 4 main criteria statuses from the strategy. I find the dashboard makes scalping the SPY much easier.
This study project is designed for scalping options that expire daily with bull put and bear call credit spreads on a 3 minute chart. The name 30_123 is a reference to 4 main criteria being met to give a green light for a potential trade. The criteria:
* 30 = 30 minute trend
* 1 = 3 minute trend
* 2 = Moving average criteria
* 3 = RSI criteria
4 = Secondary trend. Bonus if in sync but not a requirement.
* The strategy also utilizes momentum as a criteria but this is not shown on the dashboard.
This indicator is designed to trade options that expire daily including the SPY, IWM, QQQ, and NDX. However, it can be used with multiple symbols on a 3 minute chart.
When the 30_123 conditions are all green with all criteria are met a bull signal is created.
When the 30_123 conditions are all red with all criteria are met a bear signal is created.
This study is the dashboard that is designed to show how the main J8 strategy indicator is working and it shows which criteria have been met. Additionally there are multiple user INPUTS that you can adjust for the 4 main criteria plus inputs to help you with your credit spread criteria.
For example, if the SPY is at 400 we could have an order to sell a BULL PUT CREDIT SPREAD and I would likely sell the 398p and buy the 397p; The 398p delta would be approximately -.2. The spread position profits with any close over 398 and/or can be closed early with a bullish price move. IMPORTANT: If the SPY closed the day at $399 on the chart it would look like a loss based on the buy and sell orders but the spread would be a full profit since the close was above 398.
---- IRON CONDOR
For the SPY ticker only an iron condor label is generated when the SPY is trading sideways and meets specified criteria. When the criteria is met the Iron Condor label appears and it provides a recommendation for what option to buy and sell. The iron condor recommendations can be adjusted with user inputs.
This Indicator dashboard shows the criteria labels and colors the criteria as green if bullish and red if bearish. When the criteria are not met the dashboard shows “NO CLEAR SIGNAL”. There is also a label that shows whether you are looking for bullish or bearish positions based on the 30 minute trend.
The chart shown on the indicator is the RSI and for this indicator an RSI over 50 is bullish and under 50 is bearish. The line color shows the RSI trend. RSI OB (overbought) and OS (oversold) areas are shaded. The RSI can remain in an OB or OS state for a prolonged period and while some people use OB and OS as a reversal signal I use it as a strong trend indication and recognize it will not last forever. You can SET the OB and OS levels with inputs.
---- USER INPUTS
Paint Bars: Turns on/off the candle coloring. Default is OFF.
Iron Condor Settings: Defaults are what I use and can be used as a guide.
Criteria: Trend, moving averages, and RSI settings can all be adjusted.
---- SETUP & HINTS
Add "Jerry J8 30-123 SPY Scalping PRO” indicator to show bull and bear signals
Add "Jerry J8 MACD Optimal Entry Zone” indicator to show best MACD range for entry
I also like to add "Jerry Momentum Dream" indicator to see the momentum
With this indicator we’re looking for the 30, 1, 2, and 3 criteria to be met which increases our likelihood of success. IMPORTANT. Never automatically enter a position without reviewing the other indicators and drawing your own conclusions. You want to choose the entries that are the most appealing to you that take into account volume, time of day, and risk/reward. Positions should be closed based on your risk/reward goals.
Indicators are not a magic pill and should be used to support trading decisions, not to make them for you. Past performance is not a guarantee of future returns. The results of individual stocks/indexes with any strategy do not constitute proof they will repeat in the future.
DISCLAIMER: The information contained in our scripts/indicators/ideas does not constitute financial advice or a solicitation to buy or sell any securities of any type. Trading and investing in the stock market and cryptocurrencies involves substantial risk of loss and is not suitable for every investor. I’m NOT a financial adviser. All trading strategies are used at your own risk.
Please Use the AUTHOR’s INSTRUCTIONS link below for more information.
NOTE: The PERFORMANCE SUMMARY below does not accurately reflect the trading strategy because the entry orders generated in the strategy are based on the stock price and our actual order is a credit spread that is profitable even if the price moves against us a little bit. What could show as a loss in the strategy could be a profit in the credit spread.
BE - Pr_DayLowHigh_BreakoutScreener AlgoHerewith presenting the Screener based indicator which supports Algo trade on the NSE stocks. The idea behind this indicator is when the Current day stock breaks out of Yesterday's high or Low with promising volumes (Using MA's and POC of Volume Profile) along with formation of candle Pattern. Initiates the Trade entries.
Note: Indicator is designed to take an entry even before the candle is closed as soon as the entry level is crossed and it shall exit the trade as soon as the SL is hit even before candle is close.
How to Work with this Indicator.
You can map up to 15 Scripts in this indicator. However you may decide if you wish to load all 15 are few of them. if you wish to load only 10, below settings should help you ignore the rest 10 symbols from screening it for setups
Updating Symbol Script.
This is an important part is used for Algo trades. Read the tooltip for better understanding of the format. Acceptable format is Broker Name followed with : and space with Symbol mapping Name followed with / and Instrument token provided by broker if no token alloted for the script then you may keep 0 against symbol name followed with / and Qty in terms of absolute value or in terms of percentage.
Trade and Scan Settings
Symbol List Mapping
For Improvements in Results - Use Events and keep a track of it / use Nudges etc.
kaptanFantastik[Take Profit and Stop Loss Finder]Hello all,
It's ATR based active take profit & stop loss finder.
You can set multipliers for taking profit and stop losing and you can change the price source for the calculation. Also, you can change the ATR level.
Defaults are my best settings. 2.2x for taking profit and 1.5x for stop losing. Open price is the source. Also, I think 5 ATR is the best for day and swing trade.
Levels are determined according to the open prices (This is because we can enter the position after our other indicators give the signal following the close price. Yet, you can change it). Since it's active and based on my calculation with ATR values, percentages for the taking profits and stop losing may change. Because of this, you need to note the take profit and stop lose prices after your entry price level is determined by the other indicators for the best success rates.
It can be used in any time frame with the other indicators to determine the best entry points. For example, 3 EMA levels with 5,8 and 13 is good option for the entry. You can enter the position when 5 crosses up 8 and both are above the 13. You can also use custom more advanced buy/sell indicators with this one for entry points.
It can be used with any asset from cryptocurrency to the stocks, from forex to gold etc.
Hint: You can set your levels lower than the take profit prices to maximize the success rate.
Note: Market should be open for the positions.
Example trade on the 5-minute timeline.
The below chart has both my custom indicator and the 3 EMAs mentioned above.
Trade 1: Entry price: 19191, Take Profit: 19276. Profit 0.44%
Trade 2: Entry price: 19189, Take Profit: 193009. Profit 0.625%
Türkçe bilen kullanıcılar için açıklama
Herkese merhabalar,
ATR tabanlı aktif kar al ve zararı durdur bulucu.
Kar almak ve zararı kesmek için çarpanlar belirleyebilir ve hesaplama için fiyat kaynağı değiştirebilirsiniz. Ayrıca, ATR seviyesini de değiştirebilirsiniz.
Varsayılanlar benim en iyi ayarlarım. Kar almak için 2,2 kat ve zararı durdurmak için 1,5 kat. Açılış, fiyat kaynağıdır. Ayrıca, 5 ATR'nin günlük ve kısa vade (swing trade) için en iyisi olduğunu düşünüyorum.
Seviyeler açılış fiyatına göre belirlenir (Çünkü diğer göstergelerimiz kapanış fiyatının ardından sinyal verdikten sonra pozisyona girebiliyoruz. Yine de bunu değiştirebilirsiniz). Aktif olduğu için ve ATR değerleri ile yaptığım hesaplamaya göre kar alma ve zarar kes yüzdeleri değişebilir. Bu nedenle, en iyi başarı oranları için; giriş fiyat seviyeniz diğer göstergeler tarafından belirlendikten sonra kar al ve zararı durdur fiyatlarını not etmeniz gerekir.
En iyi giriş noktalarını belirlemek için diğer göstergelerle herhangi bir zaman diliminde kullanılabilir. Örneğin, 5,8 ve 13 ile 3 EMA seviyesi giriş için iyi bir seçenektir. 5, 8'i geçtiğinde ve her ikisi de 13'ün üzerinde olduğunda pozisyona girebilirsiniz. Giriş noktaları için bununla birlikte daha gelişmiş özel al/sat göstergelerini de kullanabilirsiniz.
Kripto paradan hisse senetlerine, forexten altına vb. her türlü varlıkla kullanılabilir.
İpucu: Başarı oranını en üst düzeye çıkarmak için seviyelerinizi kar alma fiyatlarından daha düşük ayarlayabilirsiniz.
Not: Pozisyonlar için piyasa açık olmalıdır.
5 dakikalık zaman çizilgesinde örnek işlem.
Yukarıdaki örnek grafikte hem özel indikatörüm hem de yukrıda belirtilen 3 EMA var.
İşlem 1: Giriş fiyatı: 19191, Kazanç Al: 19276. Kar %0.44
İşlem 2: Giriş fiyatı: 19189, Kazanç Al: 193009. Kar %0.625
VWAP PredatorUsing VWAP as a start point, the VWAP Predator uses proprietary Fibonacci bands to help determine signal criteria. Most traders use VWAP in a simple way to determine whether an instrument is in a bearish or bullish state, but that doesn't help choosing the correct time to go long or short.
The xBat VWAP Predator uses behavioural analysis with volume, price action with open and close proximities to the Fibonacci bands/zones (Fib Zones). The following describes how the xBrat VWAP Predator is different to any standard use of Volume Weighted Average Price and uses xBrat Proprietary Behavioural logic to determine high probability long and Short signals. All of this heavy lifting and logic is done behind the scenes, keeping traders charts clean.
Long Trading Signals - Candle Coloured in Blue - There are many states with the logic to produce these signals, which are briefly described below:
1. The only standard criteria here - The price action must be above the VWAP Line
2. The Price must open below the boundary of one Fib Zone and close into the next Fib Zone
3. That Same Candle has to be an Accumulation Candle (more volume than the preceding candle and More Buyers) - This is determined with our proprietary logic coding
4. The Same signal candle also has to be higher than average volume. Again, our proprietary xBrat Logic just doesn't look back over a set number of bars, it looks at times of day and day of week, plus more to determine a true valuation of higher, lower or equal to average volume.
5. Only when these states are met, plus two more ema proximity logic, Does the xBrat VWAP predator give a Long Signal.
6. Trade Management is either set targets or indeed a simple ema cross which we provide as a ribbon on the chart to help traders. These ema's are different to entry logic. When the Ribbon turns from green to red, the trader should consider exiting the trade
Short Trading Signals - Candle Coloured in Pink - There are many states with the logic to produce these signals, which are briefly described below:
1. The only standard criteria here - The price action must be below the VWAP Line
2. The Price must open above the boundary of one Fib Zone and close into the next Fib Zone
3. That Same Candle has to be a Distribution Candle (more volume than the preceding candle and More Sellers) - This is determined with our proprietary logic coding
4. The Same signal candle also has to be higher than average volume. Again, our proprietary xBrat Logic just doesn't look back over a set number of bars, it looks at times of day and day of week, plus more to determine a true valuation of higher, lower or equal to average volume.
5. Only when these states are met, plus two more ema proximity logic, Does the xBrat VWAP predator give a Short Signal.
6. Trade Management is either set targets or indeed a simple ema cross which we provide as a ribbon on the chart to help traders. These ema's are different to entry logic. When the Ribbon turns from red to green, the trader should consider exiting the trade.
VWAP Predator is a day trading and scalping signals trading indicator.
Helicopter!Review
This indicator automatically calculates the best trade entry based on volume and real-time volatility. After the algorithm analyzes the current characteristics of the market, an entry signal is placed on the chart. As a result, the trader can be sure that the signal is based on data analysis. One of the key elements is reverse transactions. A long or short position can be stopped either at a profit or at a small loss without compromising the potential profit.
!Risks
The market is unstable, and it is impossible to know what the future holds for it. The only way to manage risk. You can limit the loss by setting a stop loss of 1% from the entry point. Take profit is recommended to set with a ratio of 1:1, 1:2,1:3, with partial fixation of 40%, 30%, 30%!
!Trading recommendations
Trades are opened when a green arrow appears, selling when a yellow arrow appears. Be sure to wait for the candle to close and the signal to appear (the signal may flash when the candle is formed). Recommended timeframes: 1min, 3min, 15min. The indicator is designed for scalp trades and intradays!
!Technical part
The indicator is based on the EMA 20 and EMA 200 moving averages. It is also based on the open and close of past days, weeks, months.
RSI are used.
RSI is a classic oscillator built on the basis of calculating the relative rate of change in asset prices over a given period.
Additional tools: volume and volatility.
NO REPAINT!
-------------------------------------------------------
Denial of responsibility
The information contained in my Scripts/Indicators/Ideas/Algorithms/Systems does not constitute financial advice or an offer to buy or sell any securities of any kind. I do not accept liability for any loss or damage, including but not limited to any loss of profits that may arise directly or indirectly from the use of or reliance on such information.
TMO ScalperTMO - (T)rue (M)omentum (O)scillator) MTF Scalper Version
TMO Scalper is a special custom version of the popular TMO Oscillator. Scalper version was designed specifically for the lower time frames (1-5min intraday scalps). This version prints in the signals directly on top of the oscillator only when the higher aggregations are aligned with the current aggregation (the big wheels must be spinning in order for a small wheel to spin). The scalper consist of three MTF TMO oscillators. First one is the one that plot signals (should be the fastest aggregation), second serves as a short term trend gauge (good rule of thumb is to us 2-5x of the chart time frame or the first aggregation). The third one (optional) is shaded in the background & should only serve as a trend gauge for the day (usually higher time frames 30min+).
Time Frames Preffered by Traders:
1. 1m / 5m / 30m - This one is perfect for catching the fastest moves. However, during choppy days the 1min can produce more false signals..
2. 2m / 10m / 30m - Healthy middle, the 2min aggregation nicely smooths out the 1min mess. Short term gauge is turning slowly (10min for a signal to confirm).
3. 3m / 30m / 60m - This TF is awesome for day traders that prefer to take it slow. Obviously, this combination will produce far less signals during the day.
Hope it helps.
[co.n.g.] ADR 5/10/14/20Average Daily Range (ADR) over 5/10/14/20 Days
What it is
One of the oldest measurements of price volatility that is being used in technical and statistical trading is the range of a specific period of past days to estimate probability of chances, risk and price movements, as seen f.e. in
Molodovsky, N. (1967). Building a Stock Market Measure—A Case Study. Financial Analysts Journal, 23:3, 43-46 , DOI: 10.2469/faj.v23.n3.43.
Problem
After having tried all available community scripts I've encountered various indifferences, especially since Pine v5.
First, the anchor period changed, when I've switched between regular and extended trading hours.
- This meant, that the anchor switched between the official open of the day and the first bar of a new day beginnig at 00:00 UTC (or the corresponding timezone).
Second, thus in some scripts also changed the calculated average range, including or excluding pre market and after hours.
And therefor third, in many cases the distance between open and ADR high/low was indiffferent, putting one closer and the other further away.
Why is that?
After having tried seven different modes of calulation - from ta. to array, it appeared that especially since Pine v5 the calulation is lagging when calling
the request.security function and is thus rendering the calculations indifferent.
Especially the open is lagging and plotting delayed, about 15 minutes on a M1-chart or about 45 minutes on a M15 chart, which made id difficult to spot open (test) drives
- as f.e. described in Dalton, J. F., Jones, E. T., & Dalton, R. B. (1990). Mind over markets: power trading with market generated information. 1st edition . Probus. -
and estimating extremely strong or weak open moves.
While switching between regular and extended intraday charts, the open was either calculated on the open as request of "D" (open of the regular session)
and "1440" (which means full intraday since 00:00 UTC or the corresponding timezone), leading to undesired anchoring.
After having tried about five different anchoring periods and comparing the adr to @TradingView 's stock screener, there was no proper calulation or plotting possible,
if not partially hardcoded (being the least desired, elegant or flexible method).
Visualizing the problem
As described in the picture:
@sherwind 's ADR is plotting entirely wrong! I couldn't even figure out (even the source is available) whre the problem is rooted.
@treypeng 's ADR is anchored properly, but unfortunately the calculation is wrong.
Originality
As evident in the attached picture - and you are able to compare this to @TradingView 's stock screener - in this script as well the ADR is calculated PROPERLY
as well as the anchoring is set PROPERLY within the first tick of the session.
As matter of fact, you don't have to examine different timeframes, charts or sessions simoultaneously to see the correct levels and
you're able to ease observations and focus on your trading.
Innovation
There is no innovative approach, as described above, simply because this statistical approach is around since the 1960's.
Considering coding, neither is, but it is properly calculated and anchored.
What this script does
Anchoring at the first tick of the new New York session
Plotting the actual - not the past nor future - average day range (gray lines in picture)
Plotting the actual - not the past nor future - 75% average day range ( silver lines in picture)
Vizualising ADR breakouts by colouring the backround green (long breakout) or read (short breakout)
Selection methods
Keeping it simple stupid, as of now:
Abiliy to chose between 5/10/14/20 days
Additional
Theory says, that we are staying within the ADR of 75% every day.
_
Alas, there are some exceptions.
If price is breaking out of the ADR, we are likely to move in this direction for the rest of the day.
If price has broken out of the ADR on the previous day, ist highly unlikely to expect another ADR breakout day,
which doesn't mean that there might not appear a strong or weak second day.
Notes
Designed for intraday stock trading of the U.S. market.
Best (and easiest) chances are to be spotted in special conditions.
//Cheers,
//Constantine
NYSE Market Sentiment Oscillator - Intraday w/ alertsThe ULTIMATE market sentiment indicator that combines the sentiments from the MARKET INTERNALS : $ADD ( NYSE $ADV minus $DECL ), $VOLD ( NYSE $UVOL minus $DVOL ) and $TICK ( NYSE Cumulative tick ). Sentiment is based on calculating the crossovers of moving average pairs for each of the market internals. As a result, 3 corresponding signal lines are generated + 1 combined Market Sentiment Oscillator (aka MSO) signal line.
**Important** This indicator is only meant to be used for intraday 1min-5 min timeframe only *** It may not function at higher timeframes without updating some moving average periods.
WHAT IS IT SHOWING?
Each signal lines represents the trend of the 3 market internals (TICK, ADD, VOLD). If signal line is above zero, it is in a bullish trend; below zero, bearish. The oscillating frequency of these lines are dependent on the length of moving average pairs of your choosing. A combined MSO signal line shows the combined trends of those 3 market internals, hence it represents real time market sentiment of the NYSE.
FEATURES
There are 2 display modes for this indicator:
1) On a separate pane
- in this mode, the signal lines can be toggled to oscillate along the zero line
2) On the price chart
- in this mode, the signal lines can be toggled to oscillate along the OHLC line of the price chart
- comes with Nadaraya-Watson Envelope and ATR bands
BUY/SELL SIGNALS AND STRATEGIES
By default, this indicator comes with two day trading strategies and offers long and short signals with alerts. These strategies attempts to leverage on the oscillating nature of market price movement on major NYSE indices, such as SPY, SPX, QQQ, NAS, all of which have high correlation with the market internals. However, please note that these signals offers no guarantee to profitability, so use at your own risk.
BACKGROUND COLORS SIGNIFYING TRENDS
There are options to display the background colors in 2 colors and shades.
1) Short-term sentiment
- Bright green = ADD / VOLD / TICK all in up trend
- Dimmed green = ADD / VOLD in up trend, but not TICK
- Bright red = ADD / VOLD / TICK all in down trend
- Dimmed red = ADD / VOLD in down trend, but not TICK
2) Trend Convergence
- Green = ADD / VOLD / TICK all bullish
- Red = ADD / VOLD / TICK all bearish
3) MSO
- Green = MSO bullish ( MSO signal line > 0 )
- Red = MSO bearish ( MSO signal line < 0 )
MARKET INTERNALS REAL-TIME DATA TABLE
A data table can be toggled on / off that shows the real-time sentiment and values of the three market internals. It may be useful in making quick trading decisions. The table cells are colored according to their corresponding trends.
Ichi-Price WaveWelcome to the Ichi-Price Wave. This indicator is designed for day trading options contracts for any ticker, using a number of indicators — Ichimoku Cloud, Volume-Weighted Average Price, Stochastic Relative Strength Index, Exponential Moving Average (13/48) — and calculating how they interact with each other to provide entry and exit signals for both Calls and Puts on normal days. ****Read the Important Information section before opening any positions based on this indicator. (Also *NFA)
The general concept is that you, the trader, are a Surfer 🏄🏾 who rides the best waves in deep water until it gets dangerous.
Emoji storyline: The 🏄🏾 emoji (Call or Put, depending on the color of its Green or Red label, respectively) indicates an upcoming *potential* entry that, for a number of reasons, may be disregarded. (See: Important Information section below). And just as there are no certainties in the stock market itself, the tiered exit signals are ranked by low 🐬, medium 🦈 and high risk 🦑 tolerance. (In other words, it's relatively safe to surf with dolphins around, but there's the off chance they even strike trainers and become aggressive. It's more dangerous to swim with sharks. And on the unlikely, rare occasion you see a literal, giant, mythical, ship destroying Kraken 😬 ... you definitely need to get out of the water.
Surfing for as long as possible reaps the greatest rewards — but risk/reward are to be considered for entries and exits. Exiting every time you see a 🐬 (E1) should secure profits nearly 100% of the time, but they'll be very minimal. Whereas surfing til you reach a Kraken 🦑 (which will not even appear on most Price Wave cycles) would reap the most rewards. (NFA: I recommend considering sharks 🦈 as an exit point for the majority of positions, and perhaps only keeping a few runners open with the hopes of finding that shiny Kraken. (On the non-Emoji chart, the low, medium and high risk exits are named E1, E2 and E3, respectively. Got to the indicator's Settings > Inputs > then toggle EMOJIs ON/OFF)
Boring stuff: The entry 🏄🏾 signals are triggered by multiple conditions that must be all true. For Call entries, one of the necessary conditions is that the RSI's K must be maximum 10 (this can be changed in default). This, along with another condition where current price must be below the VWAP Lower Bound 1, serves as a great reference point showing the stock price is currently uncomfortable where it is and may likely soon snap back closer to the VWAP, perhaps even to the other side due to a pendulum effect.
Important information
Relying on those two factors for setting entry and exit points are great for normal days. (Normal, as in the ticker price bounces within a channel (e.g., ≤3% + or -) that's trending slightly bullish or bearish depending on greater market trend). But there are abnormal days where news catalysts (e.g., CPI data, CEO scandals, unexpected company data release, etc.) trigger FOMO and FUD, ultimately rendering the logic behind most indicators non applicable (e.g., RSI's "buy when oversold"). On the chart, this indicator accounts for this with two measures:
One, you should only "Surf" in the water. That is, there are two bands — Shallow and Deep Water. Any "Surf" emojis where price action is outside of the water should be ignored**. Two, there are additional EMOJIs that show you "Bearish trend" ⛈ and "Bullish trend ☀️. (Story time again: You obviously shouldn't surf in thunder and lightning. But also, surfing in the blistering sun with no clouds in the sky during a heatwave is also dangerous to your health.)
You can use these two measures to disregard the "surfers" suggesting you join them in opening a position in the suggested direction. And surfers followed by Cloud EMOJIs — 🌤️ (Put) or 🌧️ (Call) — can be used as "perfect entry" points. (The clouds represent weather being less extreme and better for surfing).
(**While these should mostly be ignored, these have not been muted because there is the possibility of a very strong turn around if you happen to catch the last one (which is not ideal for risk-averse traders). Use other indicators, such as the MACD and trend lines, to find potential bottoms (or tops) as price action plunges (or soars) due to abnormal news circumstances.)
Entry and exit buffers
At the beginning of each day, most indicators usually are not immediately calibrated correctly due to premarket trading and open market (at least to the degree that the day's sentiment can be best read from them due to the amount of volatility). What I recommend when using this indicator is disregarding signals during the first 15 minutes (or possibly 30 minutes) of market open to get the best results. And also, considering this indicator is meant for day trading (i.e., not holding positions overnight), disregarding ENTRY signals for the last 45 minutes of the trading day could give yourself enough buffer on the back end for exiting comfortably.
RSI entry
Preparing for an entry when you see a surfer is recommended, but actually opening the position when you see a 🌤️ (Put) or 🌧️ (Call) would yield best results and avoid misfires — particularly when those two cloud EMOJIs are signaled when the RSI is overbought and K is at least 95 (Puts), or oversold and K at maximum 5 (Calls). (Story time logic: The cloud eclipsing the Sun means it's cooling off and better for surfing. And the rain cloud no longer having lightning means the "bearish" storm is possibly soon over).
Delta and the Greeks
You should experiment yourself, but keep in mind that this is for capitalizing off of a day's minor price swings (≤3% + or -). Entering a same day expiry contract that's deep OTM is not going to work with this indicator (even if you enter at a surfer 🏄🏾 and exit at a Kraken 🦑) because the price wave from one end to the other won't be enough to compensate for the other Greeks working against you. Use another indicator (or insider knowledge ... Just kidding, that's illegal, don't do that) if you want to buy those kind of contracts.
I personally purchase contracts w/ minimum 80% Implied Volatility and somewhere between 20-40 Delta. Having a nice range for yourself with these factors, depending also on the size of your own portfolio and the risk tolerance you have, will determine how much you're able to capitalize off successful entry and exits.
Tips
• I set stop losses 5-10% depending on the ticker. (e.g., $TSLA's volatility may require SL closer to 10% whereas using it on $SPY, a 5% could suffice). This is in addition to ignoring entry signals that don't meet the aforementioned two requirements (i.e., it's risky to Surf in shallow water, and you shouldn't try to Surf at all outside of the water, ref. Band 2 and outside of Band 2). Remember, this is the stock market — not the casino. We rely on strategy and risk management — not hope.
• It's recommended you use time intervals ≤ 5 min. (I use 1 minute and 5 min)
• Liquidity . Using these signals on a ticker with low liquidity (particularly if you enter on the Ask side), can reduce your profits to 0% or even to a loss even if you have a perfect entry and exit. I always point to SPY as the optimal bid-ask spread, but keep that in mind.
What's with the name "Ichi-Price Wave"?
The "Ichi" gives credit to Japanese journalist Goichi Hosoda, whose indicator I used in conjunction with the 13/48 Exponential Moving Averages to create some of the exit signal conditions (e.g., E2🦈). That E2 condition is: Signal the first time the price intersects the Ichimoku conversion line *after* it has entered the VWAP UB/LB channel on one end and has exited on the opposite end). And it's named "Price Wave" because it's a literal price wave, which is where the fun surf narrative comes in. Also, "Price" doubles as me naming it after myself (in a less pretentious way). It's actually convenient that my last name is literally Price. Almost as if I was born for this. Nonetheless, this indicator is far more accurate in spotting directional changes than the free 13/48 cross, which oddly enough, influencers are charging for access. It's free, but the code is protected, for now at least.
Try it out on any ticker and look at how accurately it catches the tops and bottoms (keeping in mind to ignore misfires according to the two measures and also setting ~5-10% stop losses). And of course, use this in conjunction with other indicators. Ignoring all of my other emojis and simply setting surfer 🏄🏾 alerts could serve as additional confirmations for your personal strategy. Or you could simply enter at a surfer 🏄🏾 and exit when it reaches VWAP (or at least increase your Stop Loss to sell at break even if it doesn't reach). That strategy is the most conservative and would secure consistent gains). AND AGAIN, use your stop losses. Either it makes a move or it doesn't. Simply re-enter at a better point if necessary.
BE - Volume Scalping ProDear Traders,
Here with presenting the new Indicator (Strategy) for scalping which is primarily built based on the the Volume Analysis.
Idea behind this Indicator: I am sure every trader would agree that Volume is one of the Leading indicator along with Price, and hence thought to use the same for scalping the trades. There is a direct co-relation between the price and volume and thereby used this as a base for arriving at strength of the volume pumped in. Indicator is working on the Logic of "What is the ROC in price for the volume dumped in and does ROC quantify the same which is happened in the recent past of x candles." In order to be successful in scalping trade, Accuracy, Risk to reward and Money Management is very much crucial and hence thought so much on this to make it happen.
Note: Accuracy here being profitable in the trade and not hitting the bulls eye all the time.
What this indicator is providing:
Based on the volume, ROC & Candle Thresholds and using the inputs provided for RISK and Money Management options, Indicator continuously scans for trading opportunities and provides alerts for possible trades.
Alerts & Notifications:
There are basically 3 types of Alerts provided one with General Notification and Other with Dhan HQ notifications to support Algo Trades and AlgoJi for supporting Algo trades too.
Self Declaration:
I have been testing the performance in 30 seconds and 1 min chart and I haven't faced any issues yet. I strongly recommend users to use the same in timeframe less than 10 Min only.
Enjoy!
DISCLAIMER: No sharing, copying, reselling, modifying, or any other forms of use are authorized for our documents, script / strategy, and the information published with them. This informational planning script / strategy is strictly for individual use and educational purposes only. This is not financial or investment advice. Investments are always made at your own risk and are based on your personal judgement. I am not responsible for any losses you may incur. Please invest wisely.
Happy to receive suggestions and feedback in order to improve the performance of the indicator better.
Effortless ScalpingEffortless Scalping is an indicator that primarily is used for stock options trading.
Effortless Scalping is based off of momentum. Our script takes into account the price action, volume, and historical data points of a stock to give potential "buy" and "sell" areas.
Effortless Scalping is a protected script because its Buy and Sell signals are based off of custom coded confirmations. This is what makes our script unique. We also have custom coded CHOP Filters in the indicator.
Effortless Scalping has a custom EMA line that flows with the trend of the market. It also changes colors to indicate a bullish or bearish trend . It also will change into a yellow color if the CHOP of the market exceeds your allowance. This EMA line is the only "classic" element of our custom coded script.
You can easily use Effortless Scalping by applying it straight to your chart. You can customize several visual effects in the settings menu.
Effortless Scalping also has two types of signals--RISKY signals and normal signals. Risky signals have a higher risk, but also a higher reward.
Effortless Scalping also features take profit levels based off of ATR levels.
Effortless Scalping also has custom support and resistance lines to better help you analyze the movement of a stock. These levels are based off of pivot levels.
Effortless Scalping can not predict the future move of a stock. Our script uses historical data points to alert POTENTIAL entries. These historical data points by NO MEANS predict the future movement of the market.
Effortless Scalping was created to help me understand the movement of a stock and why it may be moving in that direction. I personally found success using this script. I am sharing it because I am hoping that others find success in this script as well. I also like to trade quite frequently, and several times a day, so I made an indicator that is both accurate and alerts frequently.
This indicator does NOT provide financial advice. It is intended for general use only.
Moving Average Directional IndexMADX is ADX-inspired indicator with moving averages that determines strength of a trend, as well as its direction. Indicator works following:
As the value of MADX increases, so does the strength of a trend
If MADX+ ( green line - bullish MADX ) crosses above MADX- ( red line - bearish MADX ) we consider trend as bullish and vice versa..
There will be situations where MADX- and MADX+ cross multiple times in a short period of time -> that will mean that market indecision is happening and big move will most likely happen after it.
For the calculation of MADX+ and MADX- we need Moving Averages or Exponential Moving Averages with three specific sources ( high, close, low ).
Now, the calculation of each MADX will differ
=> for MADX+: Moving Average (high) / Moving Average (close)
=> for MADX-: Moving Average (close) / Moving Average (low)
Length of Moving Average is editable.
Days and Session
This indicator optionally displays 2 informations:
- The Day of the week
- The New session's Candle
You can turn off/on the displayed information
Disclaimer: Scripts that I post publicly are experimental. They are not financial advices. Always backtest your ideas using your own methodologies.
Tradesense PremiumTradesense Premium
Tradesense Premium indicator offers a buy & sell signal that is based from our senior analyst who have more than 10years of experience in Forex, Stock and Crypto trading and made it possible by our pine script developers.
Our script can detect market volatility based on the price direction and the absolute value of exponential moving average are multiplied to specific numbers to get a different trading style such as Scalper, Swing Trader and Trend Follower. We also filtered out all the signals using a different known indicators such as RSI, ATR, and ADX, and the results will allow you to enter a trade before the big moves occur. We also included all the important indicator which appears in real-time to get a competitive advantage in any market environment.
If you are a trader for a long time you should know that there is no way to avoid risk in trading. Every single trade could, theoretically at least, end up a loser. That is why our script also provides automatic risk management system which can gives you the ability to know exactly where to take the profit and to stop.
Trading style preset options - Will allows you to get the signals the way you wanted depending on your trading style. Ex. Scalper, Swing Trader or a Trend follower.
Bar color - Our bar colors are based on the price actions which detects the weakness of the bar or if the bar is ranging.
Reversal Zone - This indicator would identify possible price reversal zones.
Support & Resistance - This indicator draw a line at the pivot point to show possible support and resistance area.
Target Profit indicator based on price actions - This indicator will gives you an option to reduce your position or go out of the trade before the reversal happens.
Target Profit / Stop Loss based on ATR - This indicator will gives you a simple but effective risk management system to protect your capital. The TP/SL is based from the ATR.
Alert System - We are giving you an options to customize your alerts.
Our mission is to provide systematic way to build your success.
Release notes: Tradesense Premium V1.1
✅Trading style preset options
✅Bar color
✅Reversal Zone
✅Support & Resistance
✅Target Profit indicator based on price actions
✅Target Profit / Stop Loss based on ATR
✅Alert System
❓Trading style
Currently we have 3 sets of preset options that the user can use.
Scalp - this preset is made for the trader that wants a quick in and out of the trade. The best timeframe to this is 1min to 5mins chart.
Swing - this preset is for the trader who can wait a little bit longer in a trade. The best timeframe to use is 15mins to 1hour chart.
Trend - this preset is made for the busy people that can hold a trade more than a day. The best timeframe to use is 4hours to 1day chart.
❓Bar color
This options will change the color of your bars to lessen the noise of your chart.
Green Color is a bullish indicator
Red Color is a bearish indicator
Orange Color will signify that the trend is weakening
Purple Color is a consolidation/ranging price action
❓Reversal Zone
From the name it self, once the price is already hit the Reversal Zone the price will more likely to reverse or will make a correction.
❓Support & Resistance
When this option is enabled, the support and resistance levels will show up.
❓Target Profit indicator based on price actions
When this option is enabled, you will see a "💰" which means it's time to take profit or reduce your positions.
❓Target Profit / Stop Loss based on ATR
Most of the trader uses ATR as a stop loss level. When this option is enabled, the indicator for Stop Loss and Take Profit will show up and the TP/SL levels can be changed by changing the ATR Multiplier (Default is 1.8).
❓Alert System
Function alert is added and the user can customize it the way they want it.
God Number Channel V1 (GNC V1)Channel, made of 5 MAs, which a made this way: High of N-period SMA - Low of N-period SMA + X-period SMA (check the code), where N and X are defined by your input.
Main purpose: helps you understand in what range price can move.
WARNING!
HAS TO BE USED WITH OTHER INDICATORS TO HAVE MORE ACCURATE ENTRIES!!!
If the price is above or below the channel, it means that the movement is very strong and you count it as a trend, but be careful then the price returns to the channel, as correction will follow very soon. Use fib correction tool to understand the approximate depth of correction, works pretty good.
Recommendation: consider using the Vortex Indicator( len 21 and 14 are fine; for trend) and "Vumanchu Divergencies + B"(for anything, but calibrate for accuracy, otherwise there will be too much false signals). If you want to see more options where the price might go, just add new MA and add/substract to/from its value avg1*(any of fibonacci correction levels, I personally use 1.618 and 2.618 and for me it is ok): plot(show_ma1 ? ma1+( [ [ ]]]*avg1) : na, color = ma1_color, title="MA №1")
Recommendations and feedback are welcome(!)
Take your wins
Current Trend [KPM] - Buy / SellYou can filter the trend with this indicator. Green Lines indicate a short-term up trend and Red lines indicate a short-term downtrend. and black lines indicate short-term consultation.
I'm not regarding anything with this indicator. All risk is yours
Thank you
Scalping Alice 3/5INTRO
Scalping Alice is a work in progress. I made it to help with my Scalping Long strategy as a helper for entrances.
This instance of the indicator is for 3min and 5min chart analysis only.
It still needs to further adopt and calibrate multi-frame data, but for the moment it takes from the Daily, the Hourly and the 15min.
It is meant to be used WITHOUT candles. This is because, one of the goals I'm trying to achieve is to compress data and leave out unwanted noise.
The 3min and 5min candles are very dynamic (specially in the crypto market), so I don't need to know the whole OHLC, but I do need a range.
COMPONENTS
Small Blob
The first component is the current time-frame Price Blob. The top line is the candle Highs and the bottom line is the candle Lows.
The Price Blob's Color changes according to a Double RSI which you can modify the values for.
The default is 13 for the Fast RSI and 34 for the Slow RSI.
When the Fast RSI is on top it turns Green. When the Slow RSI is on top it turns Red.
Big Blob
The Outer Blob is the same as the inner blob, but in the 15min time-frame. It changes color the exact same way, but with 15min values.
WMA Line
The closest line to the blob is the WMA line. You can change the default value, which is 21.
The color changes according to a complex modifier, that I will try to explain, but most likely fail.
It takes a sort of Tenkan (see Ichimoku Cloud if you don't know what a Tenkan is) value from the 15min chart and the Hourly chart.
It then compares the difference from these Tenkans and adds it to the 15min mid price.
And finally tries to find a fast Trend of the movement of the price for the last 3 candles.
The Tenkan value can be changed from it's default 3. Be wary, this changes the Tenkans for all the timeframes.
Blue Tenkan
The slower line is an Hourly Tenkan but with a value of 9.
Saturation Clouds
The last piece are the orange Saturation Clouds. These appear in bigger price movements and work weirdly.
They are differences between Hourly Tenkan and current frame Tenkan, along added to the mid point of the price and a little bit of Bollinger math.
Again, hard to explain, but they are very useful. Maybe one of the most useful parts of Alice.
BULL AND BEAR
Bullish :
- Green Small Blob
- Green Big Blob
- Green WMA
- Small Price Blob Above WMA
- Small Price Blob Above Blue Tenkan
- Small Price Blob Inside Upper Saturation Cloud
- Lower Saturation Cloud appears but DOES NOT touch Small Price Blob
Bearish
- Red Small Blob
- Red Big Blob
- Red WMA
- Small Price Blob Below WMA
- Small Price Blob Below Blue Tenkan
- Small Price Blob Inside Lower Saturation Cloud
- Upper Saturation Cloud appears but DOES NOT touch Small Price Blob
SMALL TIPS
Saturation Clouds
When the Saturation Clouds appear, it is an indication of strong price decision.
If it appears but it is far from the Small Blob then this indicates Price Reversal.
Most likely a nice moment to enter an opposite trend trade.
If the cloud appears touching the Small Blob and the Small Blob enters the cloud, this is Trend Confirmation.
The price is going to go strongly towards the Trend is is on.
Most likely a nice moment to enter an accompanying trend trade.
Price Bounce
The Small Blob bounces inside the Big Blob. This is very useful for numerous short plays.
You have better chances opening longs when the price is on the Lower parts of the Blobs.
The same goes for shorts on the Upper Parts.
Slow and Fast
The color of the WMA is a very fast indicator, it's the least reliable one.
Then comes the Small Blob color, then comes the WMA itself.
Following that you have the Big Blob color, then the blue Tenkan.
And finally the Saturation Clouds are the most reliable part.
FINAL THOUGHTS
This is a publishable version of this strategy. I hope to keep working on these types of strategies, maybe even upgrading this one.
Enjoy, share and leave comments!