3Commas DCA Strategy Backtesting [The Quant Science]This strategy is an advanced Dollar Cost Averaging (DCA) simulator designed to replicate the logic of 3Commas algorithmic trading bots directly within TradingView. This streamlined version showcases the power of Pine Script in developing high-efficiency backtests. By deep-diving into the data before going live, users can stress-test their setups and avoid costly mistakes.
The following 3Commas configuration is assumed for this template:
Direction: Long | Order Type: Limit | Exchange: Binance (BTC/USDT
Initial Order Size: Set to 1000 USDT.
Entry Logic: Our custom TradingView signal triggers on an RSI bearish cross of the 35 level, initiating a Long DCA sequence on oversold conditions.
The Averaging orders logic for this template is configured as follows:
Deviation to open first averaging order: 1%
Averaging order size: 100 USDT
Deviation step multiplier: 1.5
Order size multiplier: 1.5
Averaging orders per trade: 11
Limit averaging orders placed on exchange: 11
Critical Note: Max amount for bot usage & Backtesting Accuracy
When configuring 3Commas, always prioritize the Max amount for bot usage parameter. This is essential to ensure your backtesting data remains realistic and avoids "illusory" results.
As shown in this setup, the Max amount for bot usage is approximately 8,500 USDT. This represents the maximum amount of funds the bot can trade. To maintain high-fidelity backtesting on TradingView, we have set the Initial Capital to 10,000 USDT.
By utilizing ~85% of the available equity (8,500 out of 10,000 USDT), the simulation closely mirrors real-world trading conditions.
If your Max amount for bot usage exceeds your account balance, you must adjust your configuration. Always align your bot settings with your specific trading goals and financial capacity to avoid liquidation or failed order execution.
🧠 Workflow Description
This strategy automates 3Commas-style Dollar Cost Averaging (DCA), operating exclusively on the Long side. The first order is triggered when the 7-period RSI crosses down the oversold threshold (default: 35), signaling a potential local bottom. Upon entry, the system simultaneously calculates and places 10 averaging orders via limit orders at progressively lower price levels to manage the position. The spacing between these orders is dynamic; it increases exponentially through a deviation multiplier, allowing the strategy to cover deep drawdowns effectively. Simultaneously, the volume of each subsequent purchase grows according to an amount multiplier, aggressively pulling the average entry price downward. The trade is closed either at a take profit target triggered once the total position equity reaches the set value or via a stop loss calculated from the initial entry price.
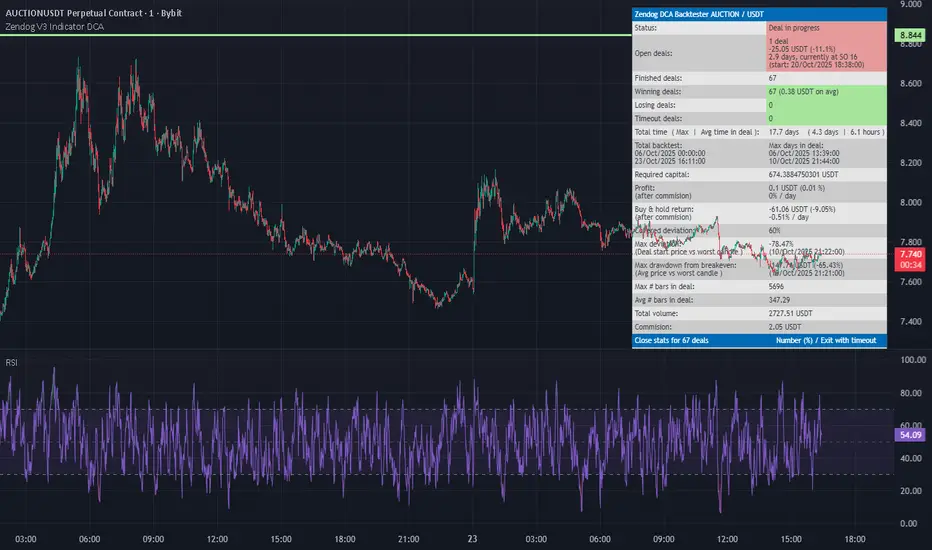
Backtesting Considerations & Performance Analysis
Despite the positive net profit shown in the strategy report, this specific configuration underperforms when compared to a simple Buy & Hold approach. In this scenario, a Buy & Hold investor who simply hold 10,000 USDT worth of the asset would have achieved a significantly higher return than the trader executing this DCA strategy. This indicates that while the bot is "profitable" in absolute terms, it is not capital-efficient under these specific market conditions.
❌ To keep this simulator streamlined and focused on core DCA logic, the current version does not include the following features:
Base Template Only: This is a foundational framework designed for educational and initial testing purposes.
No Leverage Backtesting: All calculations assume a 1x spot-trading margin (no liquidation or margin cost simulation).
No Short Selling: This version is strictly long-only.
Simplified DCA Settings: Advanced 3Commas parameters (such as Minimum Deviation Step or Non-linear Volume Scaling) are not included.
Fixed Order Count: The strategy is hardcoded to 11 total orders (1 Base Order + 10 Averaging Orders).
Standard Profit Logic: Take Profit % is calculated based on the Average Price, while Stop Loss % is anchored to the Initial Base Order price.
No Reinvestment (Compounding): The strategy uses a fixed position size and does not automatically reinvest profits into subsequent deals.
Feel free to swap the trigger logic or optimize the averaging settings to discover a configuration that outperforms a simple Buy & Hold strategy.
Pine Script®策略