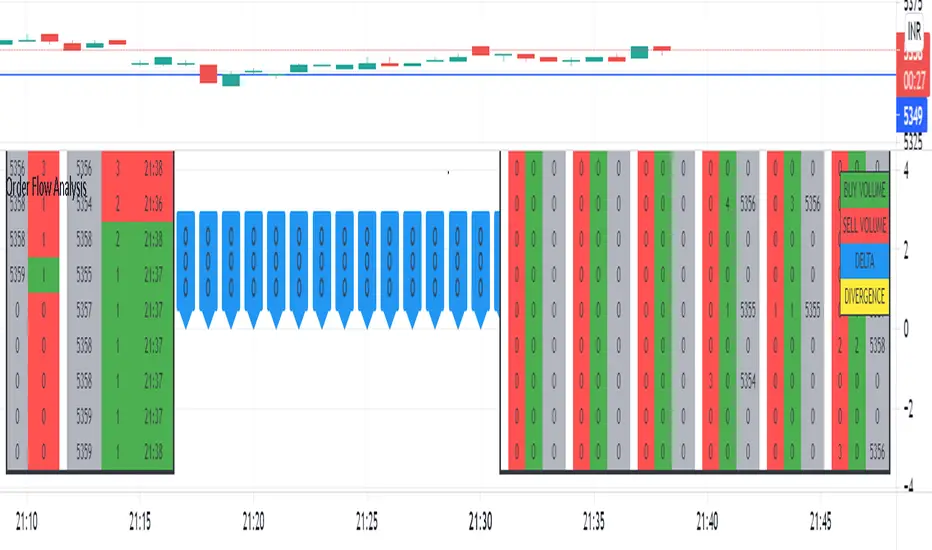
Order Flow AnalysisThe script plots the order flow clusters for the last six candles in the middle right.
The cluster contains buy volume, sell volume and the price range of the volume.
It calculates uptick volume as buy volume and down tick volume as sell volume and calculates the delta(shown in labels). Recent ATR is considered to determine each cell price range in the cluster.
At the left side, the top volume ticks and the live ticks are displayed.
Please note this works only during market trading hours.
Do not refresh the browser tab and do not change the timeframe, which will cause a reset of numbers.
Delta
Combo Backtest 123 Reversal & DAPD This is combo strategies for get a cumulative signal.
First strategy
This System was created from the Book "How I Tripled My Money In The
Futures Market" by Ulf Jensen, Page 183. This is reverse type of strategies.
The strategy buys at market, if close price is higher than the previous close
during 2 days and the meaning of 9-days Stochastic Slow Oscillator is lower than 50.
The strategy sells at market, if close price is lower than the previous close price
during 2 days and the meaning of 9-days Stochastic Fast Oscillator is higher than 50.
Second strategy
This indicator is similar to Bollinger Bands. It based on DAPD - Daily
Average Price Delta. DAPD is based upon a summation for each of the
highs (hod) for the 21 days prior to today minus the summation for
each of the lows (lod) for the last 21 days prior to today. The result
of this calculation would then be divided by 21.
It will be buy when high above previos DAPD high and sell if low below previos DAPD low
WARNING:
- For purpose educate only
- This script to change bars colors.
