RSI & BB Oversold Scalper with MACD Confirmation [DotGain]RSI & BB Oversold Scalper with MACD Confirmation
The RSI & BB Oversold Scalper is a mean reversion / dip-buying indicator designed for traders who want to combine oversold conditions with momentum confirmation .
It uses a multi-step logic: first detect an oversold setup, then wait for a MACD confirmation within a defined time window before issuing a buy signal.
---
Core Concept
1. Detect an oversold setup using Bollinger Bands %b, RSI and an optional DSS filter
2. Keep the setup active for a limited number of candles
3. Trigger the entry using a MACD bullish crossover
4. Reset after entry to avoid multiple signals from the same setup
---
Buy Signal Logic
A buy signal is generated when the following conditions are met:
1. Oversold Setup (filters can be enabled/disabled individually)
• Bollinger Bands %b Oversold (Lookback-based)
The price has traded below the lower Bollinger Band at least once within the last `lookbackBB` candles.
• RSI Oversold (Lookback-based)
The RSI has dropped below 30 at least once within the last `lookbackRSI` candles.
• DSS (Double Smoothed Stochastic) Reversal Filter
A bullish crossover of the DSS line above its signal line while the DSS value is below 20 , indicating a potential momentum reversal from oversold conditions.
Note:
BB %b and RSI are lookback filters , while the DSS condition is a single-bar crossover event .
---
2. MACD Confirmation (Entry Timing)
After the setup becomes active, the indicator waits for a bullish MACD crossover (`MACD line crosses above Signal line`) within a user-defined time window (`validWindow` candles).
If the MACD confirmation occurs within this window, a buy signal is printed.
If the window expires without confirmation, the setup is discarded automatically.
---
Reset Logic
• After a buy signal, the setup is reset immediately
• Only one signal is allowed per setup
• No late entries after the time window expires
---
Inputs & Customization
• Enable or disable BB, RSI and DSS filters individually
• Adjust lookback periods to control how recent oversold conditions must be
• Tune the MACD confirmation window to balance early vs. conservative entries
Smaller windows = faster, more aggressive entries
Larger windows = fewer but more confirmed signals
Recommended Markets & Timeframes
• Cryptocurrencies, Forex, Indices, liquid stocks
• Best suited for 1m – 15m scalping
• Also usable on 15m – 1h for slower mean-reversion trades
Visuals
• Buy signals are displayed as labels below the price candles
Important Notes
• This indicator is a signal and timing tool , not a complete trading system
• Always combine with higher-timeframe trend, support/resistance or volume analysis
• Backtesting and paper trading are strongly recommended
Disclaimer:
This "RSI & BB Oversold Scalper with MACD Confirmation" (Oversold Scalper) indicator is provided for informational and educational purposes only. It does not, and should not be construed as, financial, investment, or trading advice.
The signal generated by this tool (Green) is the result of a specific set of algorithmic conditions. They are not a direct recommendation to buy or sell any asset. The indicator's purpose is to highlight possible weakness in the markets, not to provide infallible trade signals.
All trading and investing in financial markets involves a substantial risk of loss. You can lose all of your invested capital.
Past performance is not indicative of future results. Even an indicator designed to filter out "chop" may produce false, lagging, or losing signals. Markets can remain unpredictable longer than you can remain solvent.
The creator DotGain assumes no liability for any financial losses or damages you may incur, directly or indirectly, as a result of using this indicator or the information it provides.
You are solely responsible for your own trading and investment decisions. Always conduct your own research (DYOR), validate signals with other methods, and consider your personal risk tolerance before entering any trade.
雙重平滑隨機指標(DSS)

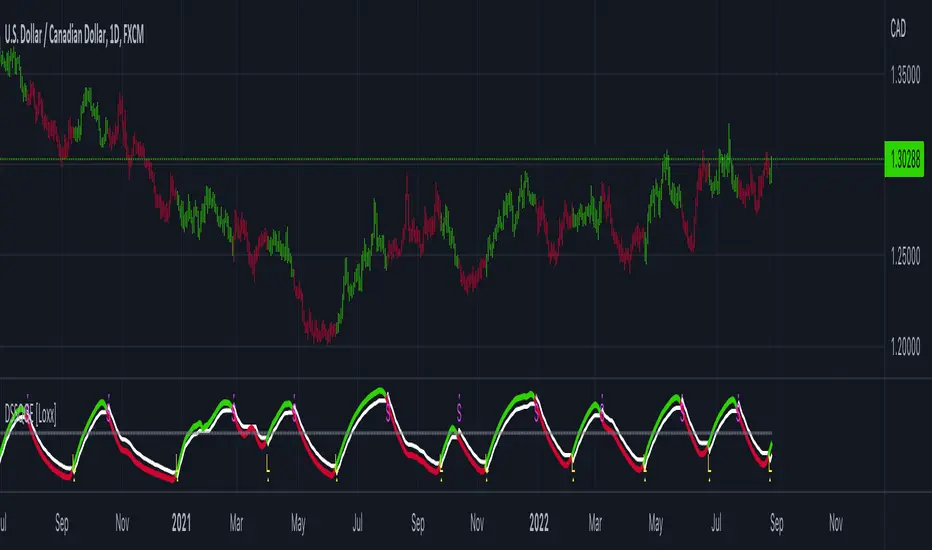
Double-Smoothed Stochastic QQE [Loxx]Double-Smoothed Stochastic QQE is a QQE indicator that uses a double-smoothed stochastic calculation for it's source input instead of traditional RSI.
What is the double-smoothed stochastic?
The Double Smoothed Stochastic indicator was created by William Blau. It applies Exponential Moving Averages (EMAs) of two different periods to a standard Stochastic %K. The components that construct the Stochastic Oscillator are first smoothed with the two EMAs. Then, the smoothed components are plugged into the standard Stochastic formula to calculate the indicator.'
What is Qualitative Quantitative Estimation (QQE)?
The Qualitative Quantitative Estimation (QQE) indicator works like a smoother version of the popular Relative Strength Index ( RSI ) indicator. QQE expands on RSI by adding two volatility based trailing stop lines. These trailing stop lines are composed of a fast and a slow moving Average True Range (ATR).
There are many indicators for many purposes. Some of them are complex and some are comparatively easy to handle. The QQE indicator is a really useful analytical tool and one of the most accurate indicators. It offers numerous strategies for using the buy and sell signals. Essentially, it can help detect trend reversal and enter the trade at the most optimal positions.
Included:
Loxx's Expanded Source Types
Alerts
Signals
Bar coloring
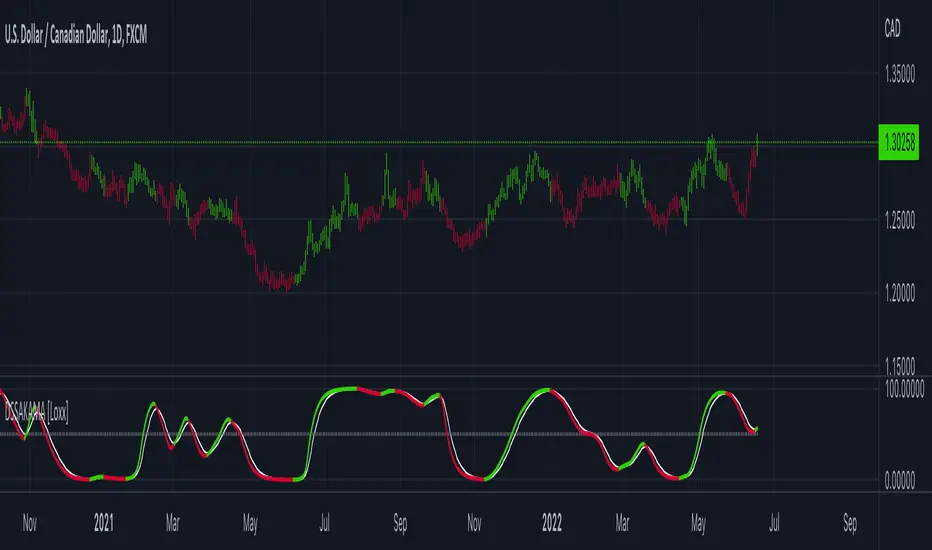
DSS of Advanced Kaufman AMA [Loxx]DSS of Advanced Kaufman AMA is a double smoothed stochastic oscillator using a Kaufman adaptive moving average with the option of using the Jurik Fractal Dimension Adaptive calculation. This helps smooth the stochastic oscillator thereby making it easier to identify reversals and trends.
What is the double smoothed stochastic?
The Double Smoothed Stochastic indicator was created by William Blau. It applies Exponential Moving Averages (EMAs) of two different periods to a standard Stochastic %K. The components that construct the Stochastic Oscillator are first smoothed with the two EMAs. Then, the smoothed components are plugged into the standard Stochastic formula to calculate the indicator.
What is KAMA?
Developed by Perry Kaufman, Kaufman's Adaptive Moving Average (KAMA) is a moving average designed to account for market noise or volatility . KAMA will closely follow prices when the price swings are relatively small and the noise is low. KAMA will adjust when the price swings widen and follow prices from a greater distance. This trend-following indicator can be used to identify the overall trend, time turning points and filter price movements.
What is the efficiency ratio?
In statistical terms, the Efficiency Ratio tells us the fractal efficiency of price changes. ER fluctuates between 1 and 0, but these extremes are the exception, not the norm. ER would be 1 if prices moved up 10 consecutive periods or down 10 consecutive periods. ER would be zero if price is unchanged over the 10 periods.
What is Jurik Fractal Dimension?
There is a weak and a strong way to measure the random quality of a time series.
The weak way is to use the random walk index ( RWI ). You can download it from the Omega web site. It makes the assumption that the market is moving randomly with an average distance D per move and proposes an amount the market should have changed over N bars of time. If the market has traveled less, then the action is considered random, otherwise it's considered trending.
The problem with this method is that taking the average distance is valid for a Normal (Gaussian) distribution of price activity. However, price action is rarely Normal, with large price jumps occuring much more frequently than a Normal distribution would expect. Consequently, big jumps throw the RWI way off, producing invalid results.
The strong way is to not make any assumption regarding the distribution of price changes and, instead, measure the fractal dimension of the time series. Fractal Dimension requires a lot of data to be accurate. If you are trading 30 minute bars, use a multi-chart where this indicator is running on 5 minute bars and you are trading on 30 minute bars.
Included
-Toggle bar colors on/offf
MTF DSS (Double Smoothed Stochastic) [TH]The Double Smoothed Stochastic indicator was created by William Blau.
The DSS ranges from 0 to 100, like the standard Stochastic Oscillator.
The same rules of interpretation apply to Stochastics can be applied to DSS, although the DSS offers a much smoother curve than the raw Stochastic.
How it works:
It applies Exponential Moving Averages (EMAs) of two different periods to a standard Stochastic %K.
The components that construct the Stochastic Oscillator are first smoothed with the two EMAs.
Then, the smoothed components are plugged into the standard Stochastic formula to calculate the indicator.
Calculation:
EMA of the ( EMA of the (Close – Lowest Low for the specified period) )
Divided by
EMA of the ( EMA of the (Highest High for the specified period – Lowest Low for the specified period) )
X 100
How to add alerts:
Check off each piece of criteria you want for the alerts, then select Okay.
Then go to 'Create Alert' and set the condition to 'MTF DSS', select create.
