Z-EMA Fusion BandsDesigned with crypto markets in mind, particularly Bitcoin , it builds on the concept that the 1-Week 50 EMA often serves as a long-term bull/bear market threshold — an area where institutional bias, momentum shifts, and cyclical rotations tend to occur.
🔹 Core Components & Synergies:
1. 1W 50 EMA (Higher Timeframe)
- This EMA is calculated on a weekly timeframe, regardless of your current chart.
- In crypto, price above the 1W 50 EMA typically aligns with long-term bull market phases, while extended periods below can signify bearish macro structure.
- The slope of the EMA is also analyzed to add directional confidence to trend strength.
2. ±1 Standard Deviation Bands
- Surrounding the 50 EMA, these bands visualize normal price dispersion relative to trend.
- When price consistently hugs or breaks outside these bands, it often reflects market expansion, volatility events, or mean-reversion opportunity.
3. Z-Score Gradient Fill
- The area between the bands is filled using a Z-score-based gradient, which dynamically adjusts color based on how far price is from the EMA (in terms of standard deviations).
- Color shifts from aqua (near EMA) to fuchsia (far from EMA) help you spot price compression, equilibrium, or overextension at a glance.
- The fill also uses transparency scaling, making it fade as price stretches further, emphasizing the core structure.
4. Directional EMA Coloring
- The EMA line itself is colored based on:
- The slope of the EMA (rising/falling)
- Whether the HTF candle is bullish or bearish
- This provides intuitive color-coded confirmation of momentum alignment or potential exhaustion.
5. Price/EMA Divergence Detection
- The script detects bullish and bearish divergence between price and the EMA (rather than using a traditional oscillator).
- Bullish Divergence: Price makes a lower low, EMA makes a higher low.
- Bearish Divergence: Price makes a higher high, EMA makes a lower high.
- These signals often mark transitional zones where momentum fades before a trend reversal or correction.
📊 Suggested Uses:
🔸 Swing and Position Trading:
- Use the 1W 50 EMA as a macro-trend anchor.
- Stay long-biased when price is above with positive slope, and short-biased when below.
- Consider entries near band edges for mean-reversion plays, especially if confluence forms with divergence signals.
🔸 Volatility-Based Filtering:
- Use the Z-score fill to identify volatility compression (near EMA) or expansion (edge of bands).
- Combine this with breakout strategies or dynamic position sizing.
🔸 Divergence Confirmation:
- Combine divergence markers with HTF EMA slope for high-probability setups.
- Bullish div + EMA flattening/rising can signal the start of accumulation after a macro dip.
🔸 Multi-Timeframe Analysis:
- Works well as a structural overlay on intraday charts (1H, 4H, 1D).
- Use this indicator to track long-term bias while executing lower timeframe trades.
⚠️ Disclaimer:
This indicator is designed for educational and informational purposes only. It does not constitute financial advice or a recommendation to buy or sell any asset.
Always use proper risk management, and combine with your own analysis, tools, and strategy. Performance in past market conditions does not guarantee future results.
Dynamicbands

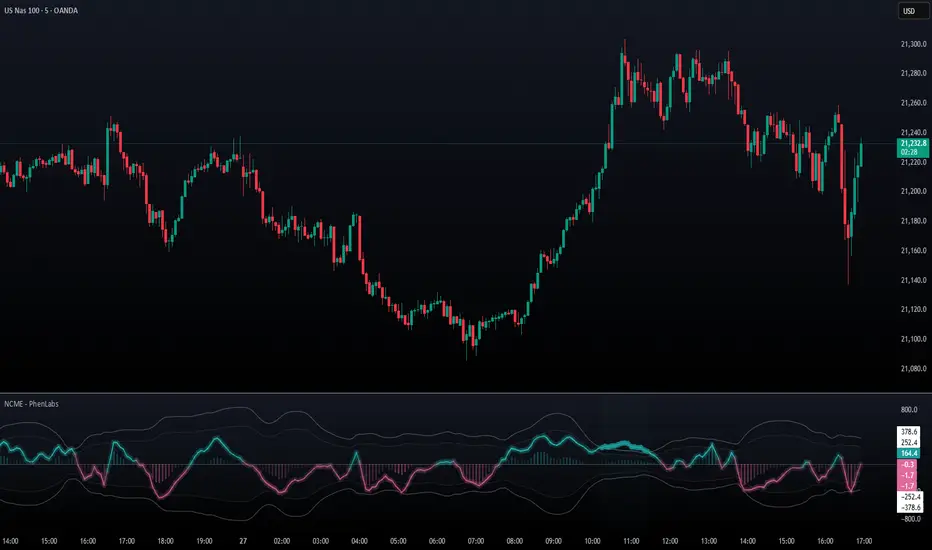
Navier-Cauchy Market Elasticity [PhenLabs]📊 Navier-Cauchy Market Elasticity
Version: PineScript™ v6
📌 Description
The Navier-Cauchy Market Elasticity (NCME) indicator takes a new step into technical analysis by applying materials science principles to financial markets. Similar to last weeks release utilizing Navier-Stokes dynamics equation this indicator focuses on the elastic interaction of virtual “solids”. Based on elasticity theory used in engineering, NCME treats price movements as material deformations, calculating market stress and strain using proven physics formulas. This unique approach reveals hidden market dynamics invisible to traditional indicators.
By implementing Lamé parameters and Young’s modulus calculations, NCME identifies critical stress points where markets exhibit extreme tension or compression. These zones often precede significant price movements, providing traders with advanced warning of potential reversals or breakouts.
🚀 Points of Innovation
• First indicator to apply Navier-Cauchy elasticity equations to market analysis
• Dynamic stress tensor calculations adapted for one-dimensional price movements
• Real-time Poisson ratio adjustments for market-specific elasticity modeling
• Gradient-based coloring system that visualizes stress intensity variations
• Advanced display modes with customizable visual layers for professional analysis
• Physics-based volatility normalization using Young’s modulus principles
🔧 Core Components
• Elasticity Engine: Calculates market elasticity using volatility-adjusted Young’s modulus
• Stress Tensor System: Computes normal stress values using Lamé parameters (λ and μ)
• Strain Measurement: Tracks price displacement relative to historical movement patterns
• Dynamic Bands: Statistical deviation bands that adapt to market elasticity changes
🔥 Key Features
• Four Display Modes: Choose between Histogram, Line, Both, or Advanced visualization
• Five Color Schemes: Modern, Classic, Neon, Ocean, and Fire themes with gradient support
• Background Stress Zones: Five distinct zones showing market stress levels visually
• Customizable Smoothing: Adjustable period for noise reduction without signal lag
• Extreme Value Detection: Automatic marking of critical stress points with visual alerts
• Advanced Mode Options: Glow effects, momentum ribbon, and extreme dots toggles
🎨 Visualization
• Stress Line: Primary indicator showing real-time market stress with gradient coloring
• Histogram Bars: Normalized stress values with dynamic opacity based on magnitude
• Reference Bands: Primary and secondary deviation bands for context
• Background Zones: Color-coded regions indicating stress intensity levels
• Signal Dots: Markers appearing at extreme stress points for easy identification
📖 Usage Guidelines
Display Settings
• Display Style
○ Default: Advanced
○ Options: Histogram, Line, Both, Advanced
○ Description: Controls visual presentation mode. Advanced offers the most comprehensive view with multiple layers
• Smoothing Period
○ Default: 3
○ Range: 1-50
○ Description: Moving average periods for noise reduction. Higher values create smoother signals but may introduce lag
Elasticity Parameters
• Displacement Length
○ Default: 14
○ Range: 1-100
○ Description: Lookback period for strain calculation. Shorter periods detect rapid stress changes
• Elasticity Length
○ Default: 30
○ Range: 1-200
○ Description: Period for volatility-based elasticity calculation. Longer periods provide more stable readings
• Poisson Ratio
○ Default: 0.3
○ Range: 0-0.5
○ Description: Theoretical elasticity ratio. 0.3 works well for most markets; adjust for specific asset classes
✅ Best Use Cases
• Identifying market tension before major breakouts
• Detecting compression zones during accumulation phases
• Confirming trend strength through stress persistence
• Timing reversals at extreme stress levels
• Multi-timeframe stress analysis for comprehensive market view
⚠️ Limitations
• Requires sufficient price history for accurate elasticity calculations
• May produce false signals during unprecedented market events
• Works best in liquid markets with consistent volume
• Not suitable as a standalone trading system
💡 What Makes This Unique
• Physics-Based Foundation: First indicator to properly implement elasticity theory
• Academic Rigor: Based on proven Navier-Cauchy equations from materials science
• Visual Innovation: Multiple display modes with professional-grade aesthetics
• Adaptive Technology: Self-adjusting parameters based on market conditions
🔬 How It Works
1. Strain Calculation:
• Measures price displacement over specified period
• Normalizes displacement relative to price level
2. Elasticity Determination:
• Calculates Young’s modulus using inverse volatility
• Updates Lamé parameters based on Poisson ratio
3. Stress Computation:
• Applies elasticity theory formula: σ = (λ + 2μ) × ε
• Scales result for visual clarity
• Applies smoothing to reduce noise
💡 Note: NCME represents a breakthrough in applying physics principles to market analysis. While based on proven scientific formulas, remember that markets are complex systems influenced by human psychology and external factors. Use NCME as part of a comprehensive trading strategy with proper risk management.
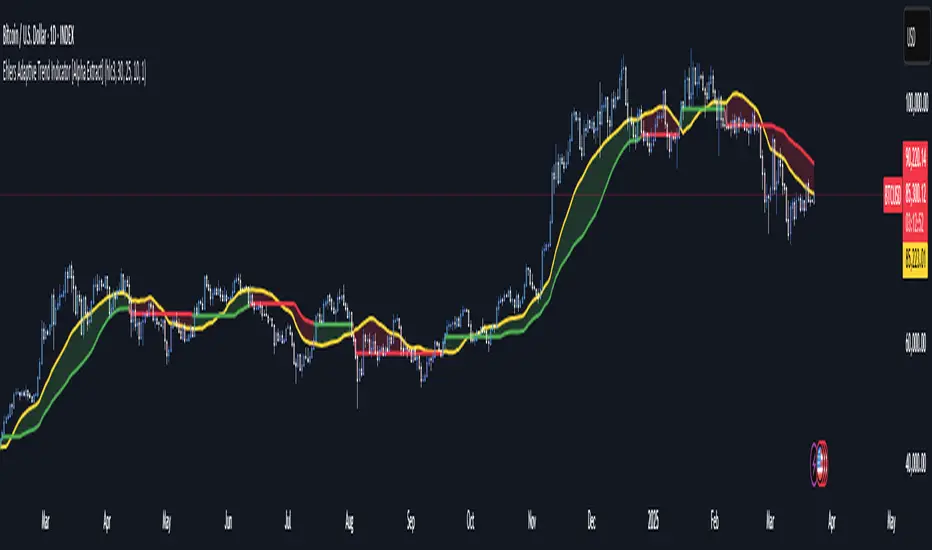
Ehlers Adaptive Trend Indicator [Alpha Extract]Ehlers Adaptive Trend Indicator
The Ehlers Adaptive Trend Indicator combines Ehlers' advanced digital signal processing techniques with dynamic volatility bands to identify robust trend conditions and potential reversals. This powerful tool helps traders visualize trend strength, adaptive support/resistance levels, and momentum shifts across various market conditions.
🔶 CALCULATION
The indicator employs a sophisticated adaptive algorithm that responds to changing market conditions:
• Ehlers Filter : Calculates a weighted average based on momentum differences to create an adaptive trend baseline.
• Dynamic Bands : Volatility-adjusted bands that expand and contract based on recent price action.
• Trend Level : A dynamic support/resistance level that adapts to the current trend direction.
• Smoothed Volatility : Market volatility measured and smoothed to provide reliable band width.
Formula:
• Ehlers Basis = Weighted average of price, with weights determined by momentum differences
• Volatility = Standard deviation of price over Ehlers Length period
• Smoothed Volatility = EMA of volatility over Smoothing Length
• Upper Band = Ehlers Basis + Smoothed Volatility × Sensitivity
• Lower Band = Ehlers Basis - Smoothed Volatility × Sensitivity
• Trend Level = Adaptive support in uptrends, resistance in downtrends
🔶 DETAILS
Visual Features :
• Ehlers Basis Line (Yellow): The core adaptive trend reference that serves as the primary trend indicator.
• Trend Level Line (Dynamic Color): Changes between green (bullish) and red (bearish) based on the current trend state.
• Fill Areas : Transparent green fill during bullish trends and transparent red fill during bearish trends for clear visual identification.
• Bar Coloring : Optional price bar coloring that reflects the current trend direction for enhanced visualization.
Interpretation :
• **Bullish Signal**: Price crosses above the upper band, triggering a trend change with the Trend Level becoming dynamic support.
• **Bearish Signal**: Price drops below the lower band, confirming a trend change with the Trend Level becoming dynamic resistance.
• **Trend Continuation**: Trend Level rises in bullish markets and falls in bearish markets, providing adaptive trailing support/resistance.
🔶 EXAMPLES
The chart demonstrates:
• Bullish Trend Identification : When price breaks above the upper band, the indicator shifts to bullish mode with green trend level and fill.
• Bearish Trend Identification : When price falls below the lower band, the indicator shifts to bearish mode with red trend level and fill.
• Trend Persistence : Trend Level adapts to market movement, rising during uptrends to provide dynamic support and falling during downtrends to act as resistance.
Example Snapshots :
• During a strong uptrend, the Trend Level continuously adjusts upward, keeping traders in the trend while filtering out minor retracements.
• During trend reversals, clear color changes and Trend Level shifts provide early warning of potential direction changes.
🔶 SETTINGS
Customization Options :
• Ehlers Length (p1) (Default: 30): Controls the primary adaptive calculation period, balancing responsiveness with stability.
• Momentum Length (p2) (Default: 25): Determines the lag for momentum calculations used in the adaptive weighting.
• Smoothing Length (Default: 10): Adjusts the volatility smoothing period—higher values provide more stable bands.
• Sensitivity (Default: 1.0): Multiplier for band width—higher values increase distance between bands, lower values tighten them.
• Visual Settings : Customizable colors for bullish and bearish trends, basis line, and optional bar coloring.
The Ehlers Adaptive Trend Indicator combines John Ehlers' digital signal processing expertise with modern volatility analysis to create a robust trend-following system that adapts to changing market conditions, helping traders stay on the right side of the market.