RVol based Support & Resistance ZonesDescription:
This indicator is designed to help traders identify significant price levels based on institutional volume. It monitors two higher timeframes (defined by the user) simultaneously. When a candle on these higher timeframes exhibits unusually high volume—known as high Relative Volume (RVol)—the indicator automatically draws a "Zone of Interest" box on your current chart.
These zones are defined by:
Up candle : from candle open to low of candle
Down candle : from candle open to high of candle
Key Features:
Multi-Timeframe Monitoring: You can trade on a lower timeframe (e.g., 5-minute) while the indicator monitors the 30-minute and 1-hour charts for volume spikes.
RVol Boxes: Automatically draws boxes extending from high-volume candles.
Up Candles: Box covers Low to Open.
Down Candles: Box covers High to Open.
Live Dashboard: A neat, color-coded table displays the current Volume, Average Volume, and RVol percentage for your watched timeframes.
Real-Time vs. Confirmed: Choose whether to see boxes appear immediately as volume spikes (Live) or only after the candle has closed and confirmed the volume (Candle Close).
Settings Guide:
1. General Settings
Relative Volume Length: The number of past candles used to calculate the "Average Volume." (Default is 20).
Max Days Back to Draw: To keep your chart clean, this limits how far back in history the script looks for high-volume zones. (e.g., set to 5 to only see zones created in the last 5 days).
Draw Mode:
- Live (Real-time): Draws the box immediately if the current developing candle hits the volume threshold. (Note: The box may disappear if the volume average shifts before the candle closes).
- Candle Close: The box only appears once the candle has finished and permanently confirmed the volume spike.
2. Table Settings
Show Info Table: Toggles the dashboard on or off.
Text Size & Position: Customise where the table appears on your screen and how large the text is.
Colours: Fully customisable colours for the Table Header (Top row) and Data Rows (Bottom rows).
3. Timeframe 1 & 2 Settings
You have two identical sections to configure two different timeframes (e.g., 30m and 1H).
Timeframe: The chart interval to monitor (e.g., "30" for 30 minutes, "60" for 1 Hour, "240" for 4 Hours).
Threshold %: The "Trigger" for drawing a box based on relative candle volume in that timeframe.
Example:
100% = Candle Volume is equal to the average volume for the specified timeframe.
200% = Candle Volume is 2x the average volume for the specified timeframe.
300% = Candle Volume is 3x the average volume for the specified timeframe.
Box & Edge Colour: Distinct colours for each timeframe so you can easily tell which timeframe created the zone.
Dynamicsupportandresistance

Draw Trendline with Breakout by Pooja🌟 Draw Trendline with Breakout by Pooja
Draw Trendline with Breakout by Pooja
✨ A smart & clean auto–trendline tool that detects swings, plots dynamic trendlines, and highlights real-time breakouts — designed for intraday, swing & positional traders.
Indicator intelligently reads market structure using objective statistical calculations (ATR / Stdev / LinReg) and gives you clarity on trend direction, structural shifts, and breakout opportunities.
Works on Stocks • Indian Stock Market • Crypto • Forex • Commodities
Suitable for Scalping • Day Trading • Swing Trading
🔥 Key Features
🔹 Auto Trendline Detection
Auto-detects swing highs/lows
Draws adaptive upper & lower trendlines
No manual drawing required
🔹 Dynamic Slope Engine
Choose from 3 professional slope methods:
📏 ATR Mode – volatility-adaptive
📊 Stdev Mode – statistical noise filtering
📐 Linear Regression Mode – structural slope mapping
🔹 Real-Time Breakout Signals
⚡ Instant breakout markers (Up/Down)
🔔 Alert support for both breakout types
Helps catch trend continuation & reversals early
🔹 Extended Projection Lines
➡️ Projects trendlines forward
🎯 Helps identify possible future reaction zones
🔹 Backpaint Control
🧩 Optional historical offset display
Great for forward testing & clean charts
🔹 Flexible Customization
Swing length
Colors
Slope sensitivity
Extended line visibility
📈 How to Use
Apply indicator
Set swing length based on volatility
Choose slope mode (ATR/Stdev/LinReg)
Observe auto trendlines
Watch for breakout markers
Set alerts for faster entries
Best used together with:
📌 Support & Resistance
📉 Price Action
🧭 Market Structure
🔊 Volume
💡 Why Traders Like It
Clean & lag-free structure mapping
Zero manual drawing
Breakouts are visually clear
Works on all assets & timeframes
⚠️ Disclaimer
This indicator is a technical analysis tool meant for charting assistance.
It does not guarantee profits or predict markets with certainty.
Always combine with your own analysis and proper risk management.
Past performance ≠ future results.

Dynamic EMA Stack Support & ResistanceEvery trader needs reliable support and resistance — but static zones and lagging indicators won't cut it in fast-moving markets. This script combines a Fibonacci-based 5-EMA stacking system and left/right pivots that create dynamic support & resistance logic to uncover real-time structural shifts & momentum zones that actually adapt to price action. This isn’t just a mashup — it’s a complete built-from-the-ground-up support & resistance engine designed for scalpers, intraday traders, and trend followers alike.
🧠 🧠 🧠What It Does🧠 🧠 🧠
This script uses two powerful engines working in sync:
1️⃣ EMA Stack (5-EMA Framework)
Built on Fibonacci-based lengths: 5, 8, 13, 21, 34, (configurable) this stack identifies:
🔹 Bullish Stack: EMAs aligned from fastest to slowest (uptrend confirmation)
🔹 Bearish Stack: EMAs aligned inversely (downtrend confirmation)
🟡 Narrowing Zones: When EMAs compress within ATR thresholds → possible breakout or reversal zone
🎯 Labels identify key transitions like:
✅"Begin Bear Trend?"
✅"Uptrend SPRT"
✅"RES?" (resistance test)
2️⃣ Pivot-Based Projection Engine
Using classic Left/Right Bar pivot logic, the script:
📌 Detects early-stage swing highs/lows before full confirmation
📈 Projects horizontal S/R lines that adapt to market structure
🔁 Keeps lines active until a new pivot replaces them
🧩 Syncs beautifully with EMA stack for confluence zones
🎯🎯🎯Key Features for Traders🎯🎯🎯
✅ Trend Detection
→ EMA order reveals real-time bias (bullish, bearish, compression)
✅ Dynamic S/R Zones
→ Historical support/resistance levels auto-draw and extend
✅ Smart Labeling
→ “SPRT”, “RES”, and “Trend?” labels for live context + testing logic
✅ Custom Candle Coloring
→ Choose from Bar Color or Full Candle Overlay modes
✅ Scalper & Swing Compatible
→ Use fast confirmations for scalping or stack consistency for longer trends
⚙️⚙️⚙️How to Use⚙️⚙️⚙️
✅Use Top/Bottom (trend state) Line Colors to quickly read trend conditions.
✅Use Pivot-based support/resistance projections to anticipate where price might pause or reverse.
✅Watch for yellow/blue zones to prepare for volatility shifts/reversals.
✅Combine with volume or momentum indicators for added confirmation.
📐📐📐Customization Options📐📐📐
✅EMA lengths (5, 8, 13, 21, 34) — fully configurable - try 21,34,55, 89, 144 for longer term trend states
✅Left/Right bar pivot settings (default: 21/5)
✅Label size, visibility, and color themes
✅Toggle line and label visibility for clean layouts
✅“Max Bars Back” to control how deep history is scanned safely
🛠🛠🛠Built-In Safeguards🛠🛠🛠
✅ATR-based filters to stabilize compression logic
✅Guarded lookback (max_bars_back) to avoid runtime errors
✅Works on any asset, any timeframe
🏁🏁🏁Final Word🏁🏁🏁
This script is not just a visual tool, it’s a complete trend and structure framework. Whether you're looking for clean trend alignment, dynamic support/resistance, or early warning labels, this system is tuned to help you react with confidence — not hindsight.
Rembember, no single indicator should be used in isolation. For best results, combine it with price action analysis, higher-timeframe context, and complementary tools like trendlines, moving averages etc Use it as part of a well-rounded trading approach to confirm setups — not to define them alone.
💡💡💡Turn logic into clarity. Structure into trades. And uncertainty into confidence.💡💡💡

Exponential Trend [AlgoAlpha]OVERVIEW
This script plots an adaptive exponential trend system that initiates from a dynamic anchor and accelerates based on time and direction. Unlike standard moving averages or trailing stops, the trend line here doesn't follow price directly—it expands exponentially from a pivot determined by a modified Supertrend logic. The result is a non-linear trend curve that starts at a specific price level and accelerates outward, allowing traders to visually assess trend strength, persistence, and early-stage reversal points through both base and volatility-adjusted extensions.
CONCEPTS
This indicator builds on the idea that trend-following tools often need dynamic, non-static expansion to reflect real market behavior. It uses a simplified Supertrend mechanism to define directional context and anchor levels, then applies an exponential growth function to simulate trend acceleration over time. The exponential growth is unidirectional and resets only when the direction flips, preserving trend memory. This method helps avoid whipsaws and adds time-weighted confirmation to trends. A volatility buffer—derived from ATR and modifiable by a width multiplier—adds a second layer to indicate zones of risk around the main trend path.
FEATURES
Exponential Trend Logic : Once a directional anchor is set, the base trend line accelerates using an exponential formula tied to elapsed bars, making the trend stronger the longer it persists.
Volatility-Adjusted Extension : A secondary band is plotted above or below the base trend line, widened by ATR to visualize volatility zones, act as soft stop regions or as a better entry point (Dynamic Support/Resistance).
Color-Coded Visualization : Clear green/red base and extension lines with shaded fills indicate trend direction and confidence levels.
Signal Markers & Alerts : Triangle markers indicate confirmed trend reversals. Built-in alerts notify users of bullish or bearish direction changes in real-time.
USAGE
Use this script to identify strong trends early, visually measure their momentum over time, and determine safe areas for entries or exits. Start by adjusting the *Exponential Rate* to control how quickly the trend expands—the higher the rate, the more aggressive the curve. The *Initial Distance* sets how far the anchor band is placed from price initially, helping filter out noise. Increase the *Width Multiplier* to widen the volatility zone for more conservative entries or exits. When the price crosses above or below the base line, a new trend is assumed and the exponential projection restarts from the new anchor. The base trend and its extension both shift over time, but only reset on a confirmed reversal. This makes the tool especially useful for momentum continuation setups or trailing stop logic in trending markets.

Money Flow Oscillator [BullByte]
Overview :
The Money Flow Oscillator is a versatile technical analysis tool designed to provide traders with insights into market momentum through the Money Flow Index (MFI). By integrating trend logic, dynamic support/resistance levels, multi-timeframe analysis, and additional indicators like ADX and Choppiness, this script delivers a detailed view of market conditions and signal strength—all while adhering to TradingView’s publication guidelines.
Key Features :
Money Flow Analysis :
Uses the MFI to assess buying and selling pressure, helping traders gauge market momentum.
Trend Switch Logic :
Employs ATR-based calculations to determine trend direction. The background color adjusts dynamically to signal bullish or bearish conditions, and a prominent center line changes color to reflect the prevailing trend.
Dynamic Support/Resistance :
Calculates oscillator support and resistance over a pivot lookback period. These levels help you identify potential breakouts or reversals as the MFI moves above or below prior levels.
Signal Metrics & Classifications :
Combines MFI values with additional metrics to classify signals into categories such as “Strong Bullish,” “Bullish,” “Bearish,” or “Strong Bearish.” An accompanying note provides details on momentum entry and overall signal strength.
Multi-Timeframe Order Flow Confirmatio n:
Analyzes the MFI on a higher timeframe to confirm order flow. This extra layer of analysis helps verify the short-term signals generated on your primary chart.
Volume and ADX Integration :
Incorporates volume analysis and a manual ADX calculation to further validate signal strength and trend stability. A dashboard displays these metrics for quick reference.
Choppiness Indicator :
Includes a choppiness index to determine if the market is trending or choppy. When the market is identified as choppy, the script advises caution by adjusting the overall signal note.
Comprehensive Dashboard :
A built-in dashboard presents key metrics—including ADX, MFI, order flow, volume score, and support/resistance details—allowing you to quickly assess market conditions at a glance.
How to Use :
Trend Identification : Monitor the dynamic background and center line colors to recognize bullish or bearish market conditions.
Signal Confirmation : Use the oscillator support/resistance levels along with the signal classifications and dashboard data to make informed entry or exit decisions.
Multi-Timeframe Analysis : Validate short-term signals with the higher timeframe MFI order flow confirmation.
Risk Management : Always combine these insights with your own risk management strategy and further analysis.
Disclaimer :
This indicator is provided for educational and informational purposes only. It does not constitute financial advice. Always perform your own analysis and use proper risk management before making any trading decisions. Past performance is not indicative of future results.

Time-Weighted Price Action IndicatorThe Time-Weighted Price Action Indicator is a simple yet effective tool designed to detect consolidation zones based on time duration and highlight potential reversal points using a contrarian breakout logic. Instead of following traditional breakout strategies, this indicator aims to capitalize on false breakouts and reversal entries.
How It Works
• The indicator identifies a price range (zone) using a configurable lookback period.
• If the price remains within this range for a specified number of bars (threshold), a consolidation zone is confirmed.
• Once a breakout or breakdown from this zone occurs, the indicator triggers a reversed signal — suggesting a potential reversal instead of a trend-following entry.
• Support and resistance levels are marked visually, and BUY/SELL labels are plotted when price re-enters the zone, indicating potential exhaustion or traps.
Key Features
• ✅ Time-based consolidation detection
• ✅ Contrarian signal logic (Buy at breakdowns, Sell at breakouts)
• ✅ Dynamic zone plotting with support/resistance visualization
• ✅ Auto-reset after each breakout for fresh zone detection
• ✅ Visual labels and alerts for BUY/SELL signals
How to Use
• Ideal for range-bound markets or identifying trap zones around support/resistance.
• Use in conjunction with volume, momentum, or trend filters to refine entries.
• Can complement mean reversion strategies or be used as a signal confirmation tool.
Why This Combination?
This approach blends time-based consolidation logic with a contrarian price action perspective, offering traders a different lens to analyze markets. Instead of blindly following breakouts, it highlights areas where price rejections and false breakouts often occur — common in algorithm-driven markets.
Why It’s Worth Using
This indicator helps you stay ahead of trap zones, identify reversal spots, and understand price behavior in consolidation zones — a critical edge, especially in sideways or choppy markets. It adds context to price movement, helping traders avoid common breakout failures.
Note:
• No performance guarantees or exaggerated claims.
• No solicitation or promotional language used.
• This is a free, open-source educational tool meant to aid price action understanding.

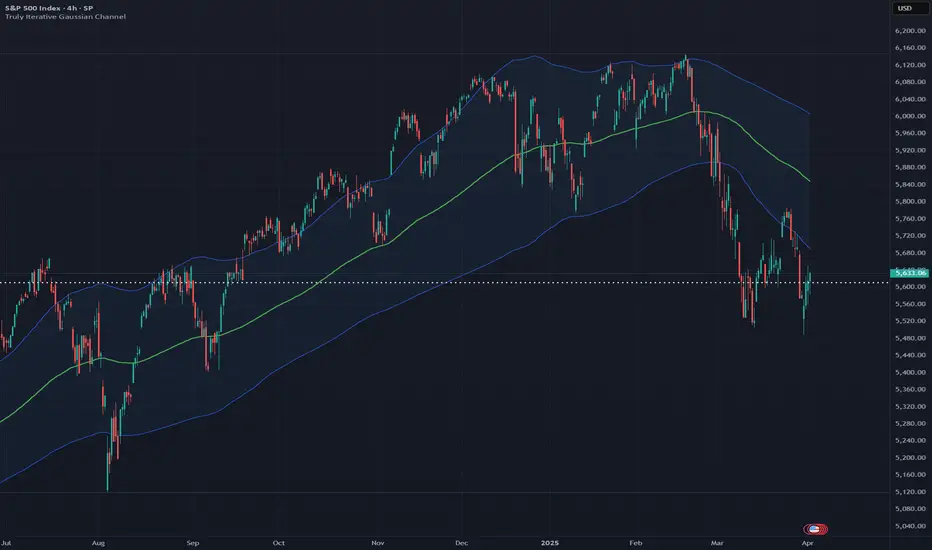
Truly Iterative Gaussian ChannelOVERVIEW
The Truly Iterative Gaussian Channel is a robust channeling system that integrates a Gaussian smoothing kernel with a rolling standard deviation to create dynamically adaptive upper and lower boundaries around price. This indicator provides a smooth, yet responsive representation of price movements while minimizing lag and dynamically adjusting channel width to reflect real-time market volatility. Its versatility makes it effective across various timeframes and trading styles, offering significant potential for experimentation and integration into advanced trading systems.
TRADING USES
The Gaussian indicator can be used for multiple trading strategies. Trend following relies on the middle Gaussian line to gauge trend direction: prices above this line indicate bullish momentum, while prices below signal bearish momentum. The upper and lower boundaries act as dynamic support and resistance levels, offering breakout or pullback entry opportunities. Mean reversion focuses on identifying reversal setups when price approaches or breaches the outer boundaries, aiming for a return to the Gaussian centerline. Volatility filtering helps assess market conditions, with narrow channels indicating low volatility or consolidation and suggesting fewer trading opportunities or an impending breakout. Adaptive risk management uses channel width to adjust for market volatility, with wider channels signaling higher risk and tighter channels indicating lower volatility and potentially safer entry points.
THEORY
Gaussian kernel smoothing, derived from the Gaussian normal distribution, is a cornerstone of probability and statistics, valued for its ability to reduce noise while preserving critical signal features. In this indicator, it ensures price movements are smoothed with precision, minimizing distortion while maintaining responsiveness to market dynamics.
The rolling standard deviation complements this by dynamically measuring price dispersion from the mean, enabling the channel to adapt in real time to changing market conditions. This combination leverages the mathematical correctness of both tools to balance smoothness and adaptability.
An iterative framework processes data efficiently, bar by bar, without recalculating historical value to ensure reliability and preventing repainting to create a mathematically grounded channel system suitable for a wide range of market environments.
The Gaussian channel excels at filtering noise while remaining responsive to price action, providing traders with a dependable tool for identifying trends, reversals, and volatility shifts with consistency and precision.
CALIBRATION
Calibration of the Gaussian channel involves adjusting its length to modify sensitivity and adaptability based on trading style. Shorter lengths (e.g., 50-100) are ideal for intraday traders seeking quick responses to price fluctuations. Medium lengths (e.g., 150-200) cater to swing traders aiming to capture broader market trends. Longer lengths (e.g., 250-400+) are better suited for positional traders focusing on long-term price movements and stability.
MARKET USAGE
Stock, Forex, Crypto, Commodities, and Indices.
WillStop Pro [tradeviZion]WillStop Pro : A Step-by-Step Guide for Beginners to Master Trend Trading
Welcome to an in-depth guide to the WillStop Pro indicator. This article will walk you through the key features, how to use them effectively, and how this tool can help you navigate the markets confidently. WillStop Pro is based on principles established by Larry Williams, a well-known figure in trading, and aims to help you manage trades more effectively without overcomplicating things.
This guide will help you understand the basics of the WillStop Pro indicator, how to interpret its signals, and how to use it step-by-step to manage risk and identify opportunities in your trading journey. We will also cover the underlying logic and calculations for advanced users interested in more details.
What is the WillStop Pro Indicator?
The WillStop Pro indicator is a user-friendly tool that helps traders establish stop levels dynamically. It helps you figure out optimal points to enter or exit trades, while managing risk effectively during changing market conditions. The indicator tracks trending markets and sets price levels as stops for ongoing trades, making it suitable both for deciding when to enter and exit trades.
The indicator is beginner-friendly because it simplifies complex calculations and presents the results visually. This allows traders to focus more on their decision-making process instead of spending time with complex analysis.
WillStop Pro adapts to different market conditions, whether you're trading stocks, forex, commodities, or cryptocurrencies. It adjusts stop levels dynamically based on current market momentum, providing a practical way to manage both risk and reward.
Another significant benefit of WillStop Pro is that it works well with other indicators. Beginners can use it on its own or combine it with other tools like moving averages or oscillators to form a comprehensive trading strategy. Whether you are trading daily or looking at longer-term trends, WillStop Pro helps you manage your trades effectively.
Key Features of WillStop Pro
Dynamic Stop Levels : WillStop Pro calculates real-time stop levels for both long (buy) and short (sell) positions. This helps you protect your profits and reduce risk. The stop levels adjust based on the current market environment, making them more adaptable compared to fixed stop levels.
Advanced Stop Settings : There are optional settings to make the stop calculations more advanced, which take into consideration previous price movements to refine where the stops should be placed. These settings provide more precise control over your trades.
Break Signals and Alerts : The indicator provides visual signals, like arrows, to show when a stop level has been broken. This makes it easier for you to identify possible reversals and understand when the market direction is changing.
Comprehensive Table Display : A small table on the chart shows the current trend, the stop level, and whether advanced mode is active. This simple display provides an overview of the market, making decision-making easier.
Based on Larry Williams' Methodology : WillStop Pro builds upon Larry Williams' ideas, which are designed to capture major market trends while managing risk effectively. It provides a systematic way to follow these strategies without requiring deep technical analysis skills.
How Are Stop Levels Calculated? (For Advanced Users)
The WillStop Pro indicator determines stop levels by evaluating highs, lows, and closing prices over a specific lookback period. It uses this information to identify key points that justify adjusting your stop level, and there are separate approaches for both long and short positions.
Below, we explain the mathematical logic behind the stop calculations, along with some code snippets to give advanced users a clearer understanding.
For Long Stops (buy positions): The indicator looks for the highest closing price within the lookback period and continues until it finds three valid bars that meet certain criteria. Stops are adjusted to skip bars that have consecutive upward closes to ensure that the stop is placed at a level that offers solid support. Specifically, the function iterates over recent bars to determine the highest closing value, and checks for specific conditions before finalizing the stop level. Here is an excerpt of the relevant code:
getTrueLow(idx) => math.min(low , close )
findStopLevels() =>
float highestClose = close
int highestCloseIndex = 0
for i = 0 to lookback
if close > highestClose
highestClose := close
highestCloseIndex := i
// Logic to adjust based on up close skipping
int longCount = 0
int longCurrentIndex = highestCloseIndex
while longCount < 3 and longCurrentIndex < 100
if not isInsideBar(longCurrentIndex)
longCount += 1
longCurrentIndex += 1
// Determine the lowest low for the stop level
float longStopLevel = high * 2
for i = searchIndex to highestCloseIndex
longStopLevel := math.min(longStopLevel, getTrueLow(i))
// Apply offset
longStopLevel := longStopLevel - (offsetTicks * tickSize)
In this code snippet, the function findStopLevels() calculates the long stop level by first identifying the highest close within the lookback period and then finding a suitable support level while skipping certain conditions, such as inside bars or consecutive upward closes. Finally, the user-defined offset ( offsetTicks ) is applied to determine the stop level.
For Short Stops (sell positions): Similarly, the indicator finds the lowest closing price within the lookback period and then identifies three bars that fit the conditions for a short stop. It avoids using bars with consecutive down closes to help find a more robust resistance level. Here's a relevant code snippet:
getTrueHigh(idx) => math.max(high , close )
findStopLevels() =>
float lowestClose = close
int lowestCloseIndex = 0
for i = 0 to lookback
if close < lowestClose
lowestClose := close
lowestCloseIndex := i
// Logic to adjust based on down close skipping
int shortCount = 0
int shortCurrentIndex = lowestCloseIndex
while shortCount < 3 and shortCurrentIndex < 100
if not isInsideBar(shortCurrentIndex)
shortCount += 1
shortCurrentIndex += 1
// Determine the highest high for the stop level
float shortStopLevel = 0
for i = searchIndex to lowestCloseIndex
shortStopLevel := math.max(shortStopLevel, getTrueHigh(i))
// Apply offset
shortStopLevel := shortStopLevel + (offsetTicks * tickSize)
Here, findStopLevels() calculates the short stop level by finding the lowest closing price within the lookback period. It then determines the highest value that acts as a resistance level, excluding bars that do not fit certain criteria.
Volume Confirmation for Alert Accuracy : To further enhance the stop level accuracy, volume is used as a confirmation filter. The average volume (volAvg) is calculated over a 20-period moving average, and alerts are only generated if the volume exceeds a defined threshold (volMultiplier). This ensures that price movements are significant enough to consider as meaningful signals.
volAvg = ta.sma(volume, 20)
isVolumeConfirmed() =>
result = requireVolumeConfirmation ? volume > (volAvg * volMultiplier) : true
result
This additional logic ensures that stop level breaks or adjustments are not triggered during periods of low trading activity, thus enhancing the reliability of the generated signals.
These calculations are at the core of WillStop Pro's ability to determine dynamic stop levels that respond effectively to market movements, helping traders manage risk by placing stops at levels that make sense given historical price and volume data.
How to Identify Opportunities with WillStop Pro
WillStop Pro provides various signals that help you decide when to enter or exit a trade:
When a Stop Level is Broken: If a stop level (support for long positions or resistance for short positions) is broken, it may indicate a reversal. WillStop Pro visually plots arrows whenever a stop level is breached, making it easy for you to see where changes might occur. This feature helps traders identify momentum shifts quickly.
Support and Resistance Levels: The indicator plots support and resistance levels, which show key zones to watch for opportunities. These levels often act as psychological barriers in the market, where price action may either reverse or stall temporarily.
Dynamic State Management: The indicator shifts between long and short states based on price action, providing real-time feedback. This helps traders stick to their trading plan without second-guessing the market.
A major advantage of WillStop Pro is that it responds well to changing market conditions. By identifying when key support or resistance levels break, it allows you to adjust your strategies and react to new opportunities accordingly. Whether the market is trending strongly or staying within a range, WillStop Pro provides valuable information to help guide your trades.
Setting Up Alerts
Alerts are an important feature in trading, especially when you can’t be in front of your charts all the time. WillStop Pro has been enhanced to include flexible alert settings to help you stay on top of your trades without constantly monitoring the charts.
Enable Alerts: There is a master switch to enable or disable all alerts. This way, you can control whether you want to be notified of events at any time.
Alert Frequency: Choose between receiving alerts Once Per Bar or Once Per Bar Close . This helps you manage the frequency of alerts and decide if you need real-time updates or want confirmation after a bar closes.
Break Alerts: These alerts notify you when a stop level has been broken. This can help you catch potential reversals or trading opportunities as soon as they happen.
Strong Break Alerts: Alerts are available for strong breaks, which occur when the price breaks stop levels with confirmation based on additional price, volume, and momentum criteria. These alerts help identify significant shifts in the market.
Level Change Alerts: These alerts tell you whenever a new stop level is calculated, keeping you updated about changes in market dynamics. You can set a Minimum Level Change % to ensure that alerts are only triggered when the stop level changes significantly.
Require Volume Confirmation: You can opt to receive alerts only if the volume is above a certain threshold. This confirmation helps reduce false signals by ensuring that significant price changes are backed by increased trading activity.
Volume Multiplier: The volume multiplier allows you to set a minimum volume requirement that must be met for an alert to trigger. This ensures that alerts are triggered only when there is sufficient trading interest.
Here is a part of the updated alert logic that has been implemented in the indicator:
// Alert on break conditions
if alertsEnabled
if alertOnBreaks
if longStopBroken and isVolumeConfirmed()
alert(createAlertMessage("Support Break - Short Signal", useAdvancedStops), alertFreq)
if shortStopBroken and isVolumeConfirmed()
alert(createAlertMessage("Resistance Break - Long Signal", useAdvancedStops), alertFreq)
// Strong break alerts
if alertOnStrongBreaks
if longStopBroken and isStrongBreak(false)
alert(createAlertMessage("Strong Support Break - Short Signal", useAdvancedStops), alertFreq)
if shortStopBroken and isStrongBreak(true)
alert(createAlertMessage("Strong Resistance Break - Long Signal", useAdvancedStops), alertFreq)
// Level change alerts
if alertOnLevelChanges and isSignificantChange() and isVolumeConfirmed()
alert(createAlertMessage("Significant Level Change", useAdvancedStops), alertFreq)
Setting alerts allows you to react to market changes without having to watch the charts constantly. Alerts are particularly helpful if you have other responsibilities and can’t be actively monitoring your trades all day.
Understanding the Table Display
The WillStop Pro indicator provides a status table that gives an overview of the current market state. Here’s what the table shows:
Indicator Status: The table indicates whether the indicator is in a LONG or SHORT state. This helps you quickly understand the market trend.
Stop Level: The active stop level is shown, whether it is acting as support (long) or resistance (short). This is important for knowing where to set your protective stops.
Mode: The table also displays whether the advanced calculation mode is being used. This keeps you informed about how stop levels are being calculated and why they are positioned where they are.
Empowering Messages: The table also includes motivational messages that rotate periodically, such as 'Trade with Clarity, Stop with Precision' and 'Let Winners Run, Cut Losses Short.' These messages are designed to keep you focused, motivated, and disciplined during your trading journey.
The table is simple and easy to follow, helping you maintain discipline in your trading plan. By having all the essential information in one place, the table reduces the need to make quick, emotional decisions and promotes more thoughtful analysis.
Tips for Using WillStop Pro Effectively
Here are some practical ways to make the most of the WillStop Pro indicator:
Start with Default Settings: If you’re new to the indicator, start with the default settings. This will give you an idea of how stop levels are determined and how they adjust to different markets.
Experiment with Advanced Settings: Once you are comfortable, try using the advanced stop settings to see how they refine the stop levels. This can be useful in certain market conditions to improve accuracy.
Use Alerts to Stay Updated: Set up alerts for when a stop level is broken or when new levels are calculated. This helps you take action without constantly watching the chart. Swing traders may find alerts especially helpful for monitoring longer-term moves.
Monitor the Status Table: Keep an eye on the status table to understand the current market condition. Whether the indicator is in a LONG or SHORT state can help you make more informed decisions.
Focus on Risk Management: WillStop Pro is designed to help you manage risk by dynamically adjusting stop levels. Make sure you are using these levels to protect your trades, especially during strong trends or volatile periods.
Acknowledging Larry Williams' Influence
WillStop Pro is inspired by the work of Larry Williams, who described the approach as one of his best trading techniques. His method aims to ride major market trends while reducing the risk of giving back gains during corrections. WillStop Pro builds upon this approach, adding features like advanced stop settings and visual alerts that make it easier to apply in modern markets.
By using WillStop Pro, you are essentially leveraging a well-established trading strategy with additional tools that help improve its effectiveness. The indicator is designed to provide a reliable way to manage trades, stay on top of market conditions, and reduce emotional decision-making.
Conclusion: Why WillStop Pro is Great for Beginners and Advanced Users
The WillStop Pro is a powerful yet easy-to-use tool that helps traders ride trends while managing risk during market corrections. It can be used both for entering and exiting trades, and its visual features make it accessible for those who are new to trading, while the underlying logic appeals to advanced users seeking greater control and understanding.
WillStop Pro is more than just a tool for setting stops. It is a comprehensive solution for managing trades, with features like dynamic stop levels, customizable alerts, and an easy-to-understand status table. This combination of simplicity and advanced features makes it suitable for beginners as well as more experienced traders.
We hope this guide helps you get started with WillStop Pro and improves your trading confidence. Remember to start with the basics, explore the advanced features, and set alerts to stay informed without getting overwhelmed. Whether you’re just beginning or want to simplify your strategy, WillStop Pro is a valuable tool to have in your trading arsenal.
Trading can be challenging, but the right tools make it more manageable. WillStop Pro helps you keep track of market movements, identify opportunities, and manage risk effectively. Give it a try and see how it can improve your trading decisions and help you navigate the markets more efficiently.
By incorporating WillStop Pro into your strategy, you are following a systematic approach that has been refined over time. It’s designed to help you make sense of the markets, plan your trades, and manage your risks with greater clarity and confidence.
Note: Always practice proper risk management and thoroughly test the indicator to ensure it aligns with your trading strategy. Past performance is not indicative of future results.
Trade smarter with TradeVizion—unlock your trading potential today!

Options Series - Dynamic Support & Resistance
🌟 Key Features & How It Works:
⭐ Dynamic Support and Resistance Management:
The script dynamically calculates and draws support and resistance lines based on pivot highs and pivot lows. Unlike static levels that remain unchanged, these lines are updated in real-time. When a support or resistance level is breached, the corresponding line is automatically deleted, keeping the chart clean and relevant. This feature ensures that the trader is always looking at valid support and resistance levels based on the current price action.
⭐ Use of Arrays for Line Management:
The script utilizes arrays to store and manage support and resistance lines (array.new_line(0)). This is a more advanced feature of Pine Script v5, allowing for efficient handling of multiple lines on the chart. By using arrays, the script can easily track and manipulate multiple lines (adding, removing, updating), ensuring that the chart remains optimized for real-time analysis.
⭐ Customizable Inputs for Flexibility:
The script includes user inputs for the pivot length and the line width, making it adaptable to different trading styles and preferences. The pivot length determines how sensitive the indicator is to price changes, while the line width allows traders to customize the visual representation of support and resistance levels. These inputs add flexibility and make the script accessible to a broad range of traders.
⭐ Efficient Breach Detection Mechanism:
The isBreached function is a key part of the script. It checks whether the current price has breached any of the existing support or resistance levels. If a breach is detected (i.e., the price crosses below a support or above a resistance), the respective line is deleted, ensuring that only active and valid lines remain on the chart. This automatic update feature reduces the need for manual intervention, helping traders stay focused on key price levels.
⭐ Visual Clarity and Chart Cleanliness:
By deleting breached lines, the script ensures that the chart does not become cluttered with outdated or irrelevant lines. This visual clarity is crucial for traders who rely on clean, simple charts for decision-making. Removing unnecessary information helps traders make faster, more confident decisions based on the current market structure.
⭐ Scalability for Multiple Timeframes:
The use of pivot points makes the script adaptable to different timeframes, from intraday scalping to longer-term swing trading. By changing the pivot length, traders can optimize the indicator for different market environments, ensuring that it can be applied across various asset classes and timeframes.
⭐ Practical for Range-bound and Breakout Trading:
This script is particularly effective for traders who focus on range-bound markets or breakout strategies. It allows them to quickly identify areas where price is likely to reverse (support/resistance) or break out (when support/resistance is breached), providing real-time insight into market dynamics.
⭐ Simplification of Price Action Analysis:
By automating the calculation of pivots and management of support/resistance levels, the script simplifies price action analysis. Traders no longer need to manually draw or monitor these levels, which is a common task in technical analysis. This provides an edge, as it reduces the time spent on chart preparation and helps focus on executing trades.
⭐ Originality:
The script "Options Series - Pivot Based Support & Resistance" is an original approach to generating support and resistance levels using pivot points. Pivot-based techniques are popular, but the script introduces an automated dynamic way of drawing support and resistance lines, tracking breaches, and deleting lines when they are no longer valid. This aspect adds a refreshing layer of interactivity and functionality that sets it apart from basic pivot point scripts. The use of arrays to store and manage multiple support and resistance lines is also a good application of Pine Script’s newer array functionalities.
⭐ Uniqueness of the Script:
The script stands out due to its dynamic management of support and resistance lines. Unlike traditional scripts that simply plot static pivot points, this one evolves with the market by removing broken levels, ensuring only valid support and resistance lines are visible on the chart. This is particularly useful for traders who focus on clean charting. The use of arrays to store and manage the lines, alongside the efficient deletion of lines when breached, demonstrates a solid understanding of Pine Script v5's advanced features, such as array manipulation.
🚀 Conclusion:
This script stands out for its real-time adaptability, dynamic support/resistance management, and efficient use of Pine Script’s advanced features. It a powerful tool for both novice and advanced traders.
The script is an indicator designed to draw support and resistance levels based on pivot highs and lows, dynamically removing lines when they are breached. If a price crosses a support or resistance level, the respective line is deleted, ensuring the chart reflects the current state of support and resistance accurately.

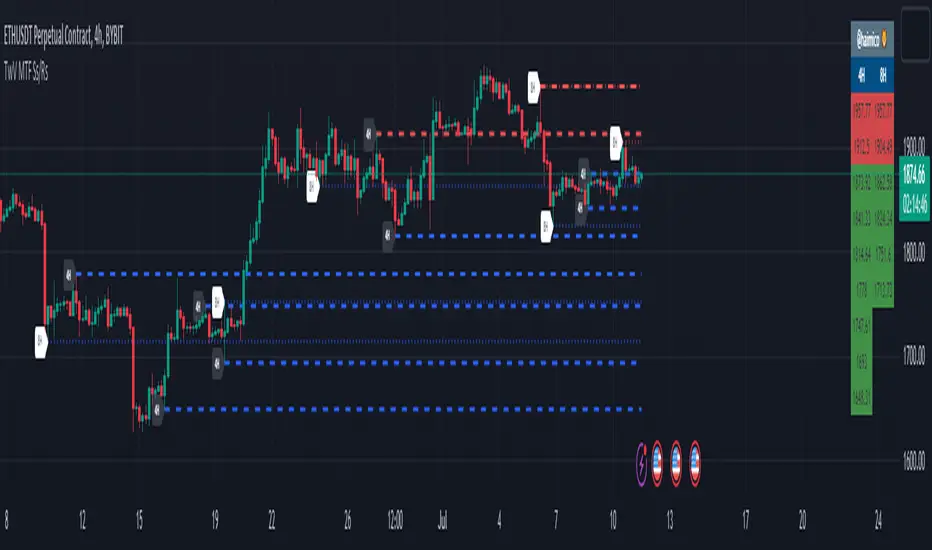
TwV Dynamic Multi-Timeframe Supports and ResistancesDynamic Multi-timeframe Supports and Resistances
This indicator is designed to be able to get used in combination with others that can lead to a potential help for trading.
The indicator uses colors such us light blue, dark blue, light red and dark red. Light blue and light red to indicate whether we are looking at a support or resistance for the multi-timeframe and dark blue and dark red to indicate whether we are looking at a support or resistance for the current chart’s timeframe.
The indicator is multi-timeframe because the trader can configure within the menu a background timeframe, which plots new supports and resistances according to the timeframe selected. Therefore, traders can use daily or 4H supports and resistances in a 1H graph or lower. (Just as an example)
The Supports' and Resistances' for the different timeframes are clearly identified with a label at the specific candle where they are coming from.
Most Supports & Resistances indicators need to be adjusted to a FIXED LOOKBACK PERIOD , I made an improvement and different by giving the indicator the ability to identify the bars that are being LOOK AT IN THE SCREEN , this really gives traders the possibility and agility to identify potential support and resistance areas without the need to be changing any settings on the indicator. Just change the Fixed/Dynamic setting indicator to start using this great functionality.
Fundamentals
Support and resistance are two foundational concepts in technical analysis. Understanding what these terms mean and their practical application is essential to correctly reading price charts.
Prices move because of supply and demand. When demand is greater than supply, prices rise. When supply is greater than demand, prices fall. Sometimes, prices will move sideways as both supply and demand are in equilibrium.
Like many concepts in technical analysis, the explanation and rationale behind technical concepts are relatively easy, but mastery in their application often takes years of practice.
Technical analysts use support and resistance levels to identify price points on a chart where the probabilities favor a pause or reversal of a prevailing trend.
Support occurs where a downtrend is expected to pause due to a concentration of demand.
Resistance occurs where an uptrend is expected to pause temporarily, due to a concentration of supply.
Support and resistance areas can be identified on charts using trendlines and moving averages.
Summary Panel
This panel allows the trader to have a summary of the values of the supports and resistances. It has the following characteristics:
Can be placed anywhere in the chart.
Its size can be modified to fit any type of screens including mobile
The summary box the high and low prices for the supports and resistances.
Script’s Basics
The idea behind the script is to find out Long-term levels are used to help predict large price reversals marking the start and completion of price movements on longer timelines such as the daily or weekly charts, to achieve this the script uses K-Means clustering to identify long-term support and resistance levels.
K-means clustering is one of the most popular algorithms, the objective of K-means is to group similar data points together and discover underlying patterns. To achieve this objective, K-means looks for a fixed number (k) of clusters in a dataset.
A cluster refers to a collection of data points aggregated together because of certain similarities. For this, a target number k has to be defined, which refers to the number of centroids it is needed in the dataset.
Every data point is allocated to each of the clusters through reducing the in-cluster sum of squares.
In other words, it identifies the k number of centroids and then allocates every data point to the nearest cluster, while keeping the centroids as small as possible.
MACD Support ResistanceThis script is dynamic support & resistance based on MACD cross.
Resistance= Highest value of candle looks back when MACD crossunder.
Support= Lowest value of candle looks back when MACD crossover.
Middle line is average of Resistance and Support.
Buy when close, LSMA and SMMA crossover middle line. Please use Green Trend Line as SL or Trailing.
Sell when close, LSMA and SMMA crossunder middle line. Please use Red Trend Line as SL or Trailing.
Let me know if its useful for you in the comments and by giving Like (means a lot to me). Also share your feedback and ideas to improve this script further.

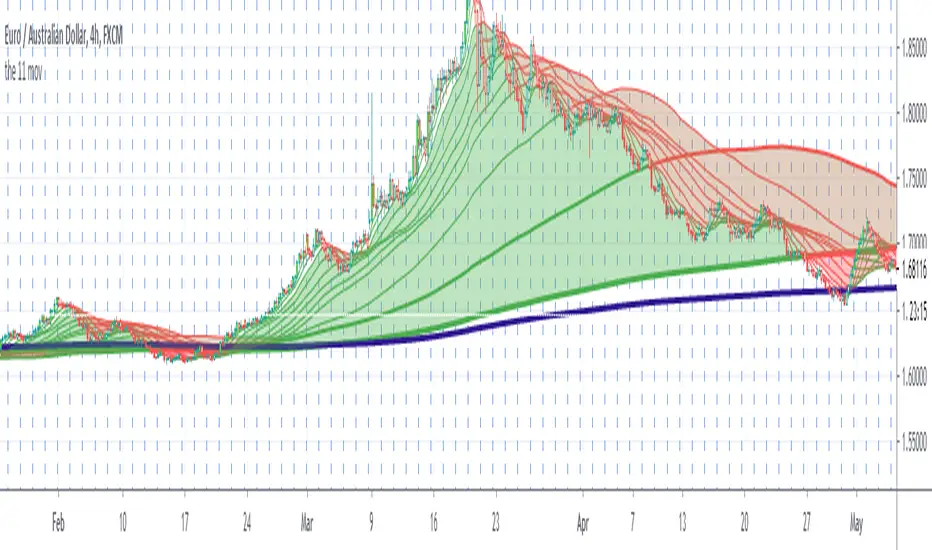
[bjb] tEMAs - Triple Exponential Moving Averages, by BlueJayBirdIs it not a pain in the butt not to find a simple script like this one in TV? I didn't find one, so I made it.
Features:
- Simple script with 3 simple Exponential Moving Averages.
Special features:
- Settable time resolution.
- Colored fill between EMA20/50 pair, and between EMA50/200 pair.
More useful than you think:
- I've found it specially useful for detecting Elliot Wave patterns. The fill colors make them stand out. Use EMA20/50 pair for this.
- The resolution change makes EMAs studies from higher timeframes, at lower time frames, more accurate. Try from 1m timeframe, setting the tEMAs resolution to 1h.
Like, follow and comment. 💯

EMA - MA 21/55/100/200 with Horizontal Lines and LabelsThis indicator will help you to get dynamic support lines of EMA 21,55,100,200 and MA 55,100,200. You can get the Price of EMA And MA in Labels also.
SOLID LINES - 4 HOUR
DOTTED LINES - 1 DAY
DASHED LINE - 1 HOUR
Hope It will help you.
Trade with your own risk. I am not liable for any loss and profit based on this indicator.
Thank you.
My MACD S/RThis script is dynamic support & resistance based on MACD crossover.
Resistance= highest value of candle looks back when MACD crossdown.
Support= lowest value of candle looks back when MACD crossover.
Middle line is average of Resistance and Support.
Buy when close crossover Mid line.
Sell when close crossunder Mid line.

Screener - Mean Reversion Channel█ OVERVIEW
This is Screener script for Mean Reversion Channel Indicator
█ Description & How To Use
The screener works by scanning through up to 40 symbols and list down symbols that are currently within Overbought/Oversold Zone as defined by Mean Reversion Channel indicator.
The Overbought/Oversold Zone are further categorized and sorted by:
Strong : Indicated by "(Strong)" next to the symbol name
Normal : Indicated by the absence of "(Strong)" or "(Weak)" next to the symbol name
Weak : Indicated by "(Weak)" next to the symbol name
Notes: Refer to chart above to see how the Zone are categorized.
Notes: If the screener displays "Nothing Interesting". It simply means none of the screened assets are within the Overbought/Oversold Zone.
█ Features
- Scan up to 40 symbols at a time (By default, no asset is define. Once configured all the symbols you required, remember to save as default to save you from pain of configuring it again in the future)
- Options to scan by zones
- Custom Timeframe
█ Limitation
Due to multiple use of security() function required to call other symbols, expect the screener to be slow at certain times
█ Disclaimer
Past performance is not an indicator of future results.
My opinions and research are my own and do not constitute financial advice in any way whatsoever.
Nothing published by me constitutes an investment recommendation, nor should any data or Content published by me be relied upon for any investment/trading activities.
I strongly recommends that you perform your own independent research and/or speak with a qualified investment professional before making any financial decisions.
Any ideas to further improve this indicator are welcome :)
Credit: QuantNomad for his script idea on custom screener

Square Root Moving AverageAbstract
This script computes moving averages which the weighting of the recent quarter takes up about a half weight.
This script also provides their upper bands and lower bands.
You can apply moving average or band strategies with this script.
Introduction
Moving average is a popular indicator which can eliminate market noise and observe trend.
There are several moving average related strategies used by many traders.
The first one is trade when the price is far from moving average.
To measure if the price is far from moving average, traders may need a lower band and an upper band.
Bollinger bands use standard derivation and Keltner channels use average true range.
In up trend, moving average and lower band can be support.
In ranging market, lower band can be support and upper band can be resistance.
In down trend, moving average and upper band can be resistance.
An another group of moving average strategy is comparing short term moving average and long term moving average.
Moving average cross, Awesome oscillators and MACD belong to this group.
The period and weightings of moving averages are also topics.
Period, as known as length, means how many days are computed by moving averages.
Weighting means how much weight the price of a day takes up in moving averages.
For simple moving averages, the weightings of each day are equal.
For most of non-simple moving averages, the weightings of more recent days are higher than the weightings of less recent days.
Many trading courses say the concept of trading strategies is more important than the settings of moving averages.
However, we can observe some characteristics of price movement to design the weightings of moving averages and make them more meaningful.
In this research, we use the observation that when there are no significant events, when the time frame becomes 4 times, the average true range becomes about 2 times.
For example, the average true range in 4-hour chart is about 2 times of the average true range in 1-hour chart; the average true range in 1-hour chart is about 2 times of the average true range in 15-minute chart.
Therefore, the goal of design is making the weighting of the most recent quarter is close to the weighting of the rest recent three quarters.
For example, for the 24-day moving average, the weighting of the most recent 6 days is close to the weighting of the rest 18 days.
Computing the weighting
The formula of moving average is
sum ( price of day n * weighting of day n ) / sum ( weighting of day n )
Day 1 is the most recent day and day k+1 is the day before day k.
For more convenient explanation, we don't expect sum ( weighting of day n ) is equal to 1.
To make the weighting of the most recent quarter is close to the weighting of the rest recent three quarters, we have
sum ( weighting of day 4n ) = 2 * sum ( weighting of day n )
If when weighting of day 1 is 1, we have
sum ( weighting of day n ) = sqrt ( n )
weighting of day n = sqrt ( n ) - sqrt ( n-1 )
weighting of day 2 ≒ 1.414 - 1.000 = 0.414
weighting of day 3 ≒ 1.732 - 1.414 = 0.318
weighting of day 4 ≒ 2.000 - 1.732 = 0.268
If we follow this formula, the weighting of day 1 is too strong and the moving average may be not stable.
To reduce the weighting of day 1 and keep the spirit of the formula, we can add a parameter (we call it as x_1w2b).
The formula becomes
weighting of day n = sqrt ( n+x_1w2b ) - sqrt ( n-1+x_1w2b )
if x_1w2b is 0.25, then we have
weighting of day 1 = sqrt(1.25) - sqrt(0.25) ≒ 1.1 - 0.5 = 0.6
weighting of day 2 = sqrt(2.25) - sqrt(1.25) ≒ 1.5 - 1.1 = 0.4
weighting of day 3 = sqrt(3.25) - sqrt(2.25) ≒ 1.8 - 1.5 = 0.3
weighting of day 4 = sqrt(4.25) - sqrt(3.25) ≒ 2.06 - 1.8 = 0.26
weighting of day 5 = sqrt(5.25) - sqrt(4.25) ≒ 2.3 - 2.06 = 0.24
weighting of day 6 = sqrt(6.25) - sqrt(5.25) ≒ 2.5 - 2.3 = 0.2
weighting of day 7 = sqrt(7.25) - sqrt(6.25) ≒ 2.7 - 2.5 = 0.2
What you see and can adjust in this script
This script plots three moving averages described above.
The short term one is default magenta, 6 days and 1 atr.
The middle term one is default yellow, 24 days and 2 atr.
The long term one is default green, 96 days and 4 atr.
I arrange the short term 6 days to make it close to sma(5).
The other twos are arranged according to 4x length and 2x atr.
There are 9 curves plotted by this script. I made the lower bands and the upper bands less clear than moving averages so it is less possible misrecognizing lower or upper bands as moving averages.
x_src : how to compute the reference price of a day, using 1 to 4 of open, high, low and close.
len : how many days are computed by moving averages
atr : how many days are computed by average true range
multi : the distance from the moving average to the lower band and the distance from the moving average to the lower band are equal to multi * average true range.
x_1w2b : adjust this number to avoid the weighting of day 1 from being too strong.
Conclusion
There are moving averages which the weighting of the most recent quarter is close to the weighting of the rest recent three quarters.
We can apply strategies based on moving averages. Like most of indicators, oversold does not always means it is an opportunity to buy.
If the short term lower band is close to the middle term moving average or the middle term lower band is close to the long term moving average, it may be potential support value.
References
Computing FIR Filters Using Arrays
How to trade with moving averages : the eight trading signals concluded by Granville
How to trade with Bollinger bands
How to trade with double Bollinger bands
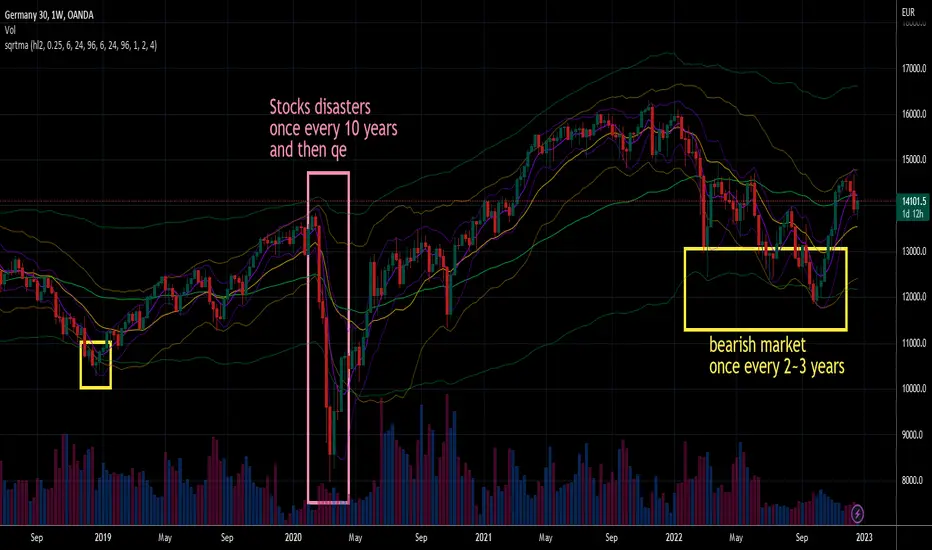
The 11 moving averages with bar color It is made by 11 moving averages and an indicator that color the candles when there is a strong trend.
The moving averages change color becoming green or red if there is a bullish trend in green or a bearish trend in red.
There are few ways to use this indicator.These two is what I found easier, please back test it and share your thoughts.
1. When the cloud is red and the candle is outside the cloud and the candle become red it s a sell entry.
When the cloud is green and the candle is outside the cloud and become green it s a buy entry.
2.The moving averages can be used as dynamic support and resistance.In a red cloud if a candle stop exactly where there is a moving averages and the next candle is a bearish engulfing candle it s a sell entry.
In a green cloud if a candle stop exactly where there is a moving averages and the next candle is a bullish engulfing candle it s a buy entry.
The exit is when the bar is not colored anymore or if the bar close below/above the second moving average from the top/from the bottom
Please look as well the blue moving averages that could work as dynamic support/resistance
VERY IMPORTANT WHEN YOU TRY A NEW STRATEGY TEST IT IN A DEMO ACCOUNT FOR AT LEAST 3 MONTHS
Every donations will be devolved to cancer research and you ll have one month free trial.
If you want to purchase this indicator 30% will be devolved to cancer research.
Please leave a comment or message me if you want you have two weeks trial.
Enjoy!
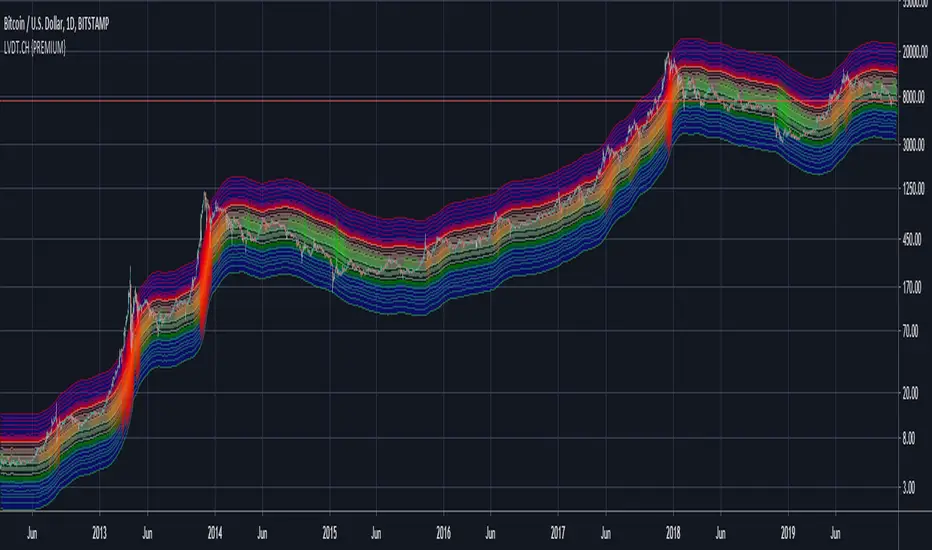
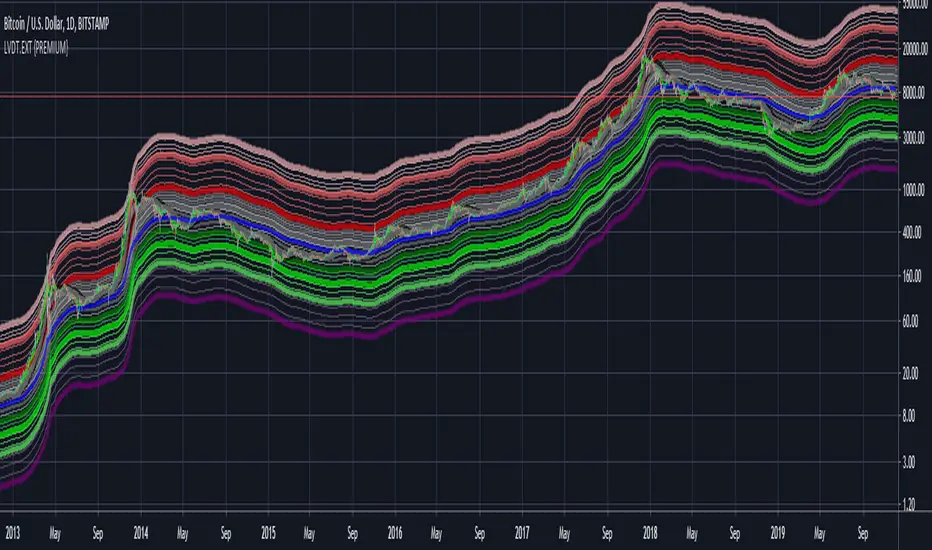
LIVIDITIUM EXTENDED BANDS {PREMIUM}This is the extended band/levels version of LIVIDITIUM Channel {PREMIUM}.
The LIVIDITIUM is a set of indicators centered around a series of parallel dynamic bands call the LVDT guide bands, defined by lines call the LVDT levels. Major LVDT levels have thicker line-widths.
LVDT levels are constructed from a mathematical conjugation of the complex golden ratio solutions.
>> Useful to determine critical levels, indicates possible support levels, as well as major and minor tops/bottoms.
Look at historical interactions to work out key levels for any particular chart, and adjust the displacement offset value to get the LVDT levels to conform better to a particular chart at a particular time-frame.
Note:
In no way is this intended as a financial/investment/trading advice. You are responsible for your own investment/trade decisions.
Please exercise your own judgement for your own trades base on your own risk-aversion level and goals as an investor or a trader. The use of OTHER indicators and analysis in conjunction (tailored to your own style of investing/trading) will help improve confidence of your analysis, for you to determine your own trade decisions.
Please PM me for access information.
( Bundled with LIVIDITIUM {PREMIUM})
LIVIDITIUM Channel {PREMIUM}This is the LITE version of LIVIDITIUM {PREMIUM} -- with colored streaks highlighting oversold or overbought conditions along the LVDT-bands .
The LIVIDITIUM is a set of indicators centered around a series of parallel dynamic bands call the LVDT guide bands, defined by lines call the LVDT levels. Major LVDT levels have thicker line-widths.
LVDT levels are constructed from a mathematical conjugation of the complex golden ratio solutions.
>> Useful to determine critical levels, indicates possible support levels, as well as major and minor tops/bottoms.
Look at historical interactions to work out key levels for any particular chart, and adjust the displacement offset value to get the LVDT levels to conform better to a particular chart at a particular time-frame.
Note:
In no way is this intended as a financial/investment/trading advice. You are responsible for your own investment/trade decisions.
Please exercise your own judgement for your own trades base on your own risk-aversion level and goals as an investor or a trader. The use of OTHER indicators and analysis in conjunction (tailored to your own style of investing/trading) will help improve confidence of your analysis, for you to determine your own trade decisions.
Please PM me for access information.
( Bundled with LIVIDITIUM {PREMIUM})