Multi-Distribution Volume Profile (Zeiierman)█ Overview
Multi-Distribution Volume Profile (Zeiierman) is a flexible, structure-first volume profile tool that lets you reshape how volume is distributed across price, from classic uniform profiles to advanced statistical curves like Gaussian, Lognormal, Student-t, and more.
Instead of forcing every market into a single "one-size-fits-all" profile, this tool lets you model how volume is likely concentrated inside each bar (body vs wicks, midpoint, tails, center bias, right-skew, heavy tails, etc.) and then stacks that behavior across a whole lookback window to build a rich, multi-distribution map of traded activity.
On top of that, it overlays a dynamic Center Band (value area) and a fade/gradient model that can color each price row by volume, hits, recency, volatility, reversals, or even liquidity voids, turning a plain profile into a multi-dimensional context map.
Highlights
Choose from multiple Profile Build Modes , including uniform, body-only, wick-only, midpoint/close/open, center-weighted, and a suite of probability-style distributions (Gaussian, Lognormal, Weibull, Student-t, etc.)
Flexible anchor layout: draw the profile on Right/Left (horizontal) or Bottom/Top (vertical) to fit any chart layout
Value Area / Center Band computed from volume quantiles around the POC.
Gradient-based Fade Metrics: volume, price hits, freshness (time decay), volatility impact, dwell time, reversal density, compression, and liquidity voids
Separate bullish vs bearish volume at each price row for directional structure insights
█ How It Works
⚪ Profile Construction
The script scans a user-defined Bars Included window and finds the full high–low span of that zone. It then divides this range into a user-controlled number of Price Levels (rows).
For each historical bar within the window:
It measures the candle’s price range, body, and wicks.
It assigns volume to rows according to the selected Profile Build Mode, for example:
* Range Uniform – volume spread evenly across the full high–low range.
* Range Body Only / Range Wick Only – concentrate volume inside the body or wicks only.
* Midpoint / Close / Open Only – allocate volume entirely into one price row (pinpoint modeling).
HL2 / Body Center Weighted – center weights around the middle of the range/body.
Recent-Weighted Volume – amplify newer bars using exponential time decay.
Volume Squared (Hard) – aggressively boost bars with large volume.
Up Bars Only / Down Bars Only – filter volume to only bullish or bearish bars.
For more advanced shapes, the script uses continuous distributions across the bar’s span:
Linear, Triangular, Exponential to High
Cosine Centered, PERT
Gaussian, Lognormal, Cauchy, Laplace
Pareto, Weibull, Logistic, Gumbel
Gamma, Beta, Chi-Square, Student-t, F-Shape
Each distribution produces a weight for each row within the bar’s range, normalized so the total volume remains consistent, but the shape of where that volume lands changes.
⚪ POC & Center Band (Value Area)
Once all rows are accumulated:
The row with the highest total volume becomes the Point of Control (POC)
The script computes cumulative volume and finds the band that wraps a user-defined Center of Profile % (e.g., 68%) around the center of distribution.
This range is displayed as a central band, often treated like a value area where price has spent the most “effort” trading.
⚪ Gradient Fade Engine
Each row also gets a fade metric, chosen in Fade Metric:
Volume – opacity based on relative volume.
Price Hits – how frequently that row was touched.
Blended (Vol+Hits) – average of volume & hits.
Freshness – emphasizes recent activity, controlled by Decay.
Volatility Impact – rows that saw larger ranges contribute more.
Dwell Time – where price “camped” the longest.
Reversal Density – where direction changes cluster.
Compression – tight-range compression zones.
Liquidity Void – inverse of volume (thin liquidity zones).
When Apply Gradient is enabled, the row’s bullish/bearish colors are tinted from faint to strong based on this chosen metric, effectively turning the profile into a heatmap of your chosen structural property.
█ How to Use
⚪ Explore Different Distribution Assumptions
Switch between multiple Profile Build Modes to see how your assumptions about intrabar volume affect structure:
Use Range Uniform for classical profile reading.
Deploy Gaussian, Logistic, or Cosine shapes to emphasize central clustering.
Try Pareto, Lognormal, or F-Shape to focus on tail / extremal activity.
Use Recent-Weighted Volume to prioritize the most recent structural behavior.
This is especially useful for traders who want to test how different modeling assumptions change perceived value areas and levels of interest.
⚪ Identify Value, Acceptance & Rejection Zones
Use the POC and Center of Profile (%) band to distinguish:
High-acceptance zones – wide central band, thick rows, strong gradient → fair value areas
Rejection zones & tails – thin extremes, low dwell time, high volatility or reversal density
These regions can be used as:
Targets and origin zones for mean reversion
Context for breakout validation (leaving value)
Bias reference for intraday rotations or swing rotations
⚪ Read Directional Structure Within the Profile
Because each row is split into bullish vs bearish contributions, you can visually read:
Where buyers dominated a price region (large bullish slice)
Where sellers absorbed or defended (large bearish slice)
Combining this with Fade Metrics like Reversal Density, Dwell Time, or Freshness turns the profile into a structural order-flow map, without needing raw tick-by-tick volume data.
⚪ Use Fade Metrics for Contextual Heatmaps
Each Fade Metric can be used for a different analytical lens:
Volume / Blended – emphasize where volume and activity are concentrated.
Freshness – highlight the most recently active zones that still matter.
Volatility Impact & Compression – spot areas of explosive moves vs coiled ranges.
Reversal Density – locate micro turning points and battle zones.
Liquidity Void – visually pop out thin regions that may act as speedways or magnets.
█ Settings
Profile Build Mode – Selects how each bar’s volume is distributed across its price range (uniform, body/wick, midpoint/close/open, center-weighted, or statistical distribution families).
Bars Included – Number of bars used to build the profile from the current bar backward.
Price Levels – Vertical resolution of the profile: more levels = smoother but heavier.
Anchor Side – Where the profile is drawn on the chart: Right, Left, Bottom, or Top.
Offset (bars) – Horizontal offset from the last bar to the profile when using Right/Left modes.
Apply Gradient – Toggles the fade/heatmap coloring based on the selected metric.
Fade Metric – Chooses the property driving row opacity (Volume, Hits, Freshness, Volatility Impact, Dwell Time, Reversal Density, Compression, Liquidity Void).
Decay – Time-decay factor for Freshness (values close to 1 keep older activity relevant for longer).
Profile Thickness – Relative thickness of the profile along the time axis, as a % of the lookback window.
Center of Profile (%) – Volume percentage used to define the central band (value area) around the POC.
-----------------
Disclaimer
The content provided in my scripts, indicators, ideas, algorithms, and systems is for educational and informational purposes only. It does not constitute financial advice, investment recommendations, or a solicitation to buy or sell any financial instruments. I will not accept liability for any loss or damage, including without limitation any loss of profit, which may arise directly or indirectly from the use of or reliance on such information.
All investments involve risk, and the past performance of a security, industry, sector, market, financial product, trading strategy, backtest, or individual's trading does not guarantee future results or returns. Investors are fully responsible for any investment decisions they make. Such decisions should be based solely on an evaluation of their financial circumstances, investment objectives, risk tolerance, and liquidity needs.
Dynamicvolumeprofile

LibVPrfLibrary "LibVPrf"
This library provides an object-oriented framework for volume
profile analysis in Pine Script®. It is built around the `VProf`
User-Defined Type (UDT), which encapsulates all data, settings,
and statistical metrics for a single profile, enabling stateful
analysis with on-demand calculations.
Key Features:
1. **Object-Oriented Design (UDT):** The library is built around
the `VProf` UDT. This object encapsulates all profile data
and provides methods for its full lifecycle management,
including creation, cloning, clearing, and merging of profiles.
2. **Volume Allocation (`AllotMode`):** Offers two methods for
allocating a bar's volume:
- **Classic:** Assigns the entire bar's volume to the close
price bucket.
- **PDF:** Distributes volume across the bar's range using a
statistical price distribution model from the `LibBrSt` library.
3. **Buy/Sell Volume Splitting (`SplitMode`):** Provides methods
for classifying volume into buying and selling pressure:
- **Classic:** Classifies volume based on the bar's color (Close vs. Open).
- **Dynamic:** A specific model that analyzes candle structure
(body vs. wicks) and a short-term trend factor to
estimate the buy/sell share at each price level.
4. **Statistical Analysis (On-Demand):** Offers a suite of
statistical metrics calculated using a "Lazy Evaluation"
pattern (computed only when requested via `get...` methods):
- **Central Tendency:** Point of Control (POC), VWAP, and Median.
- **Dispersion:** Value Area (VA) and Population Standard Deviation.
- **Shape:** Skewness and Excess Kurtosis.
- **Delta:** Cumulative Volume Delta, including its
historical high/low watermarks.
5. **Structural Analysis:** Includes a parameter-free method
(`getSegments`) to decompose a profile into its fundamental
unimodal segments, allowing for modality detection (e.g.,
identifying bimodal profiles).
6. **Dynamic Profile Management:**
- **Auto-Fitting:** Profiles set to `dynamic = true` will
automatically expand their price range to fit new data.
- **Manipulation:** The resolution, price range, and Value Area
of a dynamic profile can be changed at any time. This
triggers a resampling process that uses a **linear
interpolation model** to re-bucket existing volume.
- **Assumption:** Non-dynamic profiles are fixed and will throw
a `runtime.error` if `addBar` is called with data
outside their initial range.
7. **Bucket-Level Access:** Provides getter methods for direct
iteration and analysis of the raw buy/sell volume and price
boundaries of each individual price bucket.
---
**DISCLAIMER**
This library is provided "AS IS" and for informational and
educational purposes only. It does not constitute financial,
investment, or trading advice.
The author assumes no liability for any errors, inaccuracies,
or omissions in the code. Using this library to build
trading indicators or strategies is entirely at your own risk.
As a developer using this library, you are solely responsible
for the rigorous testing, validation, and performance of any
scripts you create based on these functions. The author shall
not be held liable for any financial losses incurred directly
or indirectly from the use of this library or any scripts
derived from it.
create(buckets, rangeUp, rangeLo, dynamic, valueArea, allot, estimator, cdfSteps, split, trendLen)
Construct a new `VProf` object with fixed bucket count & range.
Parameters:
buckets (int) : series int number of price buckets ≥ 1
rangeUp (float) : series float upper price bound (absolute)
rangeLo (float) : series float lower price bound (absolute)
dynamic (bool) : series bool Flag for dynamic adaption of profile ranges
valueArea (int) : series int Percentage of total volume to include in the Value Area (1..100)
allot (series AllotMode) : series AllotMode Allocation mode `classic` or `pdf` (default `classic`)
estimator (series PriceEst enum from AustrianTradingMachine/LibBrSt/1) : series LibBrSt.PriceEst PDF model when `model == PDF`. (deflault = 'uniform')
cdfSteps (int) : series int even #sub-intervals for Simpson rule (default 20)
split (series SplitMode) : series SplitMode Buy/Sell determination (default `classic`)
trendLen (int) : series int Look‑back bars for trend factor (default 3)
Returns: VProf freshly initialised profile
method clone(self)
Create a deep copy of the volume profile.
Namespace types: VProf
Parameters:
self (VProf) : VProf Profile object to copy
Returns: VProf A new, independent copy of the profile
method clear(self)
Reset all bucket tallies while keeping configuration intact.
Namespace types: VProf
Parameters:
self (VProf) : VProf profile object
Returns: VProf cleared profile (chaining)
method merge(self, srcABuy, srcASell, srcRangeUp, srcRangeLo, srcCvd, srcCvdHi, srcCvdLo)
Merges volume data from a source profile into the current profile.
If resizing is needed, it performs a high-fidelity re-bucketing of existing
volume using a linear interpolation model inferred from neighboring buckets,
preventing aliasing artifacts and ensuring accurate volume preservation.
Namespace types: VProf
Parameters:
self (VProf) : VProf The target profile object to merge into.
srcABuy (array) : array The source profile's buy volume bucket array.
srcASell (array) : array The source profile's sell volume bucket array.
srcRangeUp (float) : series float The upper price bound of the source profile.
srcRangeLo (float) : series float The lower price bound of the source profile.
srcCvd (float) : series float The final Cumulative Volume Delta (CVD) value of the source profile.
srcCvdHi (float) : series float The historical high-water mark of the CVD from the source profile.
srcCvdLo (float) : series float The historical low-water mark of the CVD from the source profile.
Returns: VProf `self` (chaining), now containing the merged data.
method addBar(self, offset)
Add current bar’s volume to the profile (call once per realtime bar).
classic mode: allocates all volume to the close bucket and classifies
by `close >= open`. PDF mode: distributes volume across buckets by the
estimator’s CDF mass. For `split = dynamic`, the buy/sell share per
price is computed via context-driven piecewise s(u).
Namespace types: VProf
Parameters:
self (VProf) : VProf Profile object
offset (int) : series int To offset the calculated bar
Returns: VProf `self` (method chaining)
method setBuckets(self, buckets)
Sets the number of buckets for the volume profile.
Behavior depends on the `isDynamic` flag.
- If `dynamic = true`: Works on filled profiles by re-bucketing to a new resolution.
- If `dynamic = false`: Only works on empty profiles to prevent accidental changes.
Namespace types: VProf
Parameters:
self (VProf) : VProf Profile object
buckets (int) : series int The new number of buckets
Returns: VProf `self` (chaining)
method setRanges(self, rangeUp, rangeLo)
Sets the price range for the volume profile.
Behavior depends on the `dynamic` flag.
- If `dynamic = true`: Works on filled profiles by re-bucketing existing volume.
- If `dynamic = false`: Only works on empty profiles to prevent accidental changes.
Namespace types: VProf
Parameters:
self (VProf) : VProf Profile object
rangeUp (float) : series float The new upper price bound
rangeLo (float) : series float The new lower price bound
Returns: VProf `self` (chaining)
method setValueArea(self, valueArea)
Set the percentage of volume for the Value Area. If the value
changes, the profile is finalized again.
Namespace types: VProf
Parameters:
self (VProf) : VProf Profile object
valueArea (int) : series int The new Value Area percentage (0..100)
Returns: VProf `self` (chaining)
method getBktBuyVol(self, idx)
Get Buy volume of a bucket.
Namespace types: VProf
Parameters:
self (VProf) : VProf Profile object
idx (int) : series int Bucket index
Returns: series float Buy volume ≥ 0
method getBktSellVol(self, idx)
Get Sell volume of a bucket.
Namespace types: VProf
Parameters:
self (VProf) : VProf Profile object
idx (int) : series int Bucket index
Returns: series float Sell volume ≥ 0
method getBktBnds(self, idx)
Get Bounds of a bucket.
Namespace types: VProf
Parameters:
self (VProf) : VProf Profile object
idx (int) : series int Bucket index
Returns:
up series float The upper price bound of the bucket.
lo series float The lower price bound of the bucket.
method getPoc(self)
Get POC information.
Namespace types: VProf
Parameters:
self (VProf) : VProf Profile object
Returns:
pocIndex series int The index of the Point of Control (POC) bucket.
pocPrice. series float The mid-price of the Point of Control (POC) bucket.
method getVA(self)
Get Value Area (VA) information.
Namespace types: VProf
Parameters:
self (VProf) : VProf Profile object
Returns:
vaUpIndex series int The index of the upper bound bucket of the Value Area.
vaUpPrice series float The upper price bound of the Value Area.
vaLoIndex series int The index of the lower bound bucket of the Value Area.
vaLoPrice series float The lower price bound of the Value Area.
method getMedian(self)
Get the profile's median price and its bucket index. Calculates the value on-demand if stale.
Namespace types: VProf
Parameters:
self (VProf) : VProf Profile object.
Returns:
medianIndex series int The index of the bucket containing the Median.
medianPrice series float The Median price of the profile.
method getVwap(self)
Get the profile's VWAP and its bucket index. Calculates the value on-demand if stale.
Namespace types: VProf
Parameters:
self (VProf) : VProf Profile object.
Returns:
vwapIndex series int The index of the bucket containing the VWAP.
vwapPrice series float The Volume Weighted Average Price of the profile.
method getStdDev(self)
Get the profile's volume-weighted standard deviation. Calculates the value on-demand if stale.
Namespace types: VProf
Parameters:
self (VProf) : VProf Profile object.
Returns: series float The Standard deviation of the profile.
method getSkewness(self)
Get the profile's skewness. Calculates the value on-demand if stale.
Namespace types: VProf
Parameters:
self (VProf) : VProf Profile object.
Returns: series float The Skewness of the profile.
method getKurtosis(self)
Get the profile's excess kurtosis. Calculates the value on-demand if stale.
Namespace types: VProf
Parameters:
self (VProf) : VProf Profile object.
Returns: series float The Kurtosis of the profile.
method getSegments(self)
Get the profile's fundamental unimodal segments. Calculates on-demand if stale.
Uses a parameter-free, pivot-based recursive algorithm.
Namespace types: VProf
Parameters:
self (VProf) : VProf The profile object.
Returns: matrix A 2-column matrix where each row is an pair.
method getCvd(self)
Cumulative Volume Delta (CVD) like metric over all buckets.
Namespace types: VProf
Parameters:
self (VProf) : VProf Profile object.
Returns:
cvd series float The final Cumulative Volume Delta (Total Buy Vol - Total Sell Vol).
cvdHi series float The running high-water mark of the CVD as volume was added.
cvdLo series float The running low-water mark of the CVD as volume was added.
VProf
VProf Bucketed Buy/Sell volume profile plus meta information.
Fields:
buckets (series int) : int Number of price buckets (granularity ≥1)
rangeUp (series float) : float Upper price range (absolute)
rangeLo (series float) : float Lower price range (absolute)
dynamic (series bool) : bool Flag for dynamic adaption of profile ranges
valueArea (series int) : int Percentage of total volume to include in the Value Area (1..100)
allot (series AllotMode) : AllotMode Allocation mode `classic` or `pdf`
estimator (series PriceEst enum from AustrianTradingMachine/LibBrSt/1) : LibBrSt.PriceEst Price density model when `model == PDF`
cdfSteps (series int) : int Simpson integration resolution (even ≥2)
split (series SplitMode) : SplitMode Buy/Sell split strategy per bar
trendLen (series int) : int Look‑back length for trend factor (≥1)
maxBkt (series int) : int User-defined number of buckets (unclamped)
aBuy (array) : array Buy volume per bucket
aSell (array) : array Sell volume per bucket
cvd (series float) : float Final Cumulative Volume Delta (Total Buy Vol - Total Sell Vol).
cvdHi (series float) : float Running high-water mark of the CVD as volume was added.
cvdLo (series float) : float Running low-water mark of the CVD as volume was added.
poc (series int) : int Index of max‑volume bucket (POC). Is `na` until calculated.
vaUp (series int) : int Index of upper Value‑Area bound. Is `na` until calculated.
vaLo (series int) : int Index of lower value‑Area bound. Is `na` until calculated.
median (series float) : float Median price of the volume distribution. Is `na` until calculated.
vwap (series float) : float Profile VWAP (Volume Weighted Average Price). Is `na` until calculated.
stdDev (series float) : float Standard Deviation of volume around the VWAP. Is `na` until calculated.
skewness (series float) : float Skewness of the volume distribution. Is `na` until calculated.
kurtosis (series float) : float Excess Kurtosis of the volume distribution. Is `na` until calculated.
segments (matrix) : matrix A 2-column matrix where each row is an pair. Is `na` until calculated.

LVN/HVN Auto Detection [PhenLabs]📊 PhenLabs - LVN/HVN Auto Detection
Version: PineScript™ v6
📌 Description
The PhenLabs LVN/HVN Auto Detection indicator is an advanced volume profile analysis tool that automatically identifies Low Volume Nodes (LVN) and High Volume Nodes (HVN) across multiple trading sessions. This sophisticated indicator analyzes volume distribution patterns to pinpoint critical support and resistance levels where price is likely to react, providing traders with high-probability zones for entries, exits, and risk management.
Unlike traditional volume indicators that only show current activity, this tool builds comprehensive volume profiles from historical sessions and intelligently filters the most significant levels. It combines real-time volume analysis with dynamic level detection, offering both visual bubbles for immediate volume activity and persistent horizontal lines that act as ongoing support/resistance references.
🚀 Points of Innovation
Multi-Session Volume Profile Analysis - Automatically calculates and analyzes volume profiles across the last 5 trading sessions
Intelligent Level Separation Logic - Prevents overlapping signals by maintaining minimum separation between LVN and HVN levels
Dynamic Timeframe Adaptation - Automatically adjusts session lengths based on chart timeframe for optimal level detection
Real-Time Activity Bubbles - Shows volume activity strength through different bubble sizes at key levels
Persistent Line Management - Creates horizontal lines that extend until price crosses them, providing ongoing reference points
Dual Threshold System - Independent percentage-based thresholds for both LVN and HVN identification
🔧 Core Components
Volume Profile Engine : Builds 20-row volume profiles for each analyzed session, distributing volume across price levels
Level Identification Algorithm : Uses percentage-based thresholds to classify volume distribution patterns
Separation Logic : Ensures minimum distance between conflicting levels, prioritizing HVN when overlap occurs
Line Management System : Tracks active support/resistance lines and removes them when price crosses through
Volume Activity Monitor : Compares current volume to 13-period moving average for activity classification
🔥 Key Features
Customizable Thresholds : LVN threshold (5-35%, default 20%) and HVN threshold (65-95%, default 80%) for precise level filtering
Volume Activity Multiplier : Adjustable volume threshold (0.5+, default 1.5) for bubble and line creation sensitivity
Flexible Display Modes : Choose between Lines only, Bubbles only, or Both for optimal chart clarity
Smart Level Separation : Minimum separation percentage (0.1-2%, default 0.5%) prevents conflicting signals
Color Customization : Independent color controls for LVN (red) and HVN (blue) elements
Performance Optimization : Processes every 15 bars with maximum 500 active lines for smooth operation
🎨 Visualization
Colored Bubbles : Three sizes (large, medium, small) indicate volume activity strength at key levels
Horizontal Lines : Persistent support/resistance lines with width corresponding to volume activity
Dual Color System : Semi-transparent red for LVN areas, semi-transparent blue for HVN zones
Information Tooltip : Optional table showing usage guidelines and optimization tips
📖 Usage Guidelines
Volume Thresholds
LVN Threshold
○ Default: 20.0%
○ Range: 5.0-35.0%
○ Description: Price levels with volume below this percentage are marked as LVNs. Lower values create fewer, more significant levels. Typical range 15-25% works for most instruments.
HVN Threshold
○ Default: 80.0%
○ Range: 65.0-95.0%
○ Description: Price levels with volume above this percentage are marked as HVNs. Higher values create fewer, stronger levels. Range 75-85% is optimal for most trading.
Display Controls
Volume Threshold
○ Default: 1.5
○ Range: 0.5+
○ Description: Multiplier for volume significance (High=2+threshold, Medium=1+threshold, Low=0+threshold). Higher values require more volume for signals.
✅ Best Use Cases
Swing Trading : Identify key levels for position entries and exits over multiple days
Scalping : Use bubbles for immediate volume activity confirmation at critical levels
Risk Management : Place stops beyond LVN levels where price moves quickly
Breakout Trading : Monitor HVN levels for potential breakout or rejection scenarios
Multi-Timeframe Analysis : Combine with higher timeframe levels for confluence
⚠️ Limitations
Timeframe Sensitivity : Lower timeframes may produce too many levels; higher timeframes recommended for cleaner signals
Volume Data Dependency : Accuracy depends on reliable volume data from your data provider
Historical Analysis : Uses past volume data which may not predict future price behavior
Performance Impact : High number of active lines may affect chart performance on slower devices
💡 What Makes This Unique
Automated Session Analysis : No manual drawing required - automatically analyzes multiple sessions
Intelligent Filtering : Advanced separation logic prevents overlapping and conflicting signals
Adaptive Processing : Adjusts to different timeframes automatically for optimal level detection
Dual Visualization System : Combines persistent lines with real-time activity indicators
🔬 How It Works
1. Volume Profile Construction :
Analyzes the last 5 trading sessions with dynamic session length based on timeframe
Divides each session’s price range into 20 equal levels for volume distribution analysis
2. Level Classification :
Calculates volume percentage at each price level relative to session maximum
Identifies LVN levels below threshold and HVN levels above threshold
3. Signal Generation :
Creates bubbles when volume activity exceeds thresholds at identified levels
Draws horizontal lines that persist until price crosses through them
💡 Note : For optimal results, increase your chart timeframe if you see too many levels. The indicator performs best on 15-minute and higher timeframes where volume patterns are more meaningful and less noisy.

Dynamic Volume Profile v2 (Up To 60 Channels)Dynamic Volume Profile (DVP) is an advanced charting study that displays trading activity over a specified time period at specified price levels dynamically.
DVP typically based on price and volume information and it combines these factors in a way that displays price, volume and time frame on a single chart dynamically. You can gather a multitude of information with a glance.
The first thing that most traders will use dynamic volume profile for is identifying basic support and resistance levels. It is important to note that using Dynamic Volume Profile as an identifier for support and resistance levels is a reactive method.
Point of Control ( PoC ): It refers to the area in the chart with the most traded volume activity. This is by far the most relevant area you want to monitor as it can help to define the placement of your stops or the areas in the chart where you might find the most pristine entry levels. The highest concentrated area of volume for a particular period of time we will call it PoC or Point of Control and you will be surprised how many times it acts as a wall on a retest. Traders tend to factor this in as an area of support or resistance.
Value Area ( VA ): The range of price levels in which a specified percentage of all volume was traded. By default, the industry standards tends to be 70%.
Value Area High ( VAH ) – The highest price level within the value area.
Value Area Low ( VAL ) – The lowest price level within the value area.
The script creates up to 60 channels according to highest/lowest levels for specified time period and finds the total volume for each channel. Then it calculates Point of Control, Value area and VAH/VAL. the script shows POC channel and Value Area, and you can see VAH/VAL ve all channels optionally.
In this version, number of channels can be changed up to 60 optionally by user
If you find my works useful, please consider a donation
BTC: 19qDW9AShZhBZsGuXcgRzam5Fbpc3EU8EV
ETH: 0x39c8552371b9b7f4e324197af460ba8bc8e18ef9

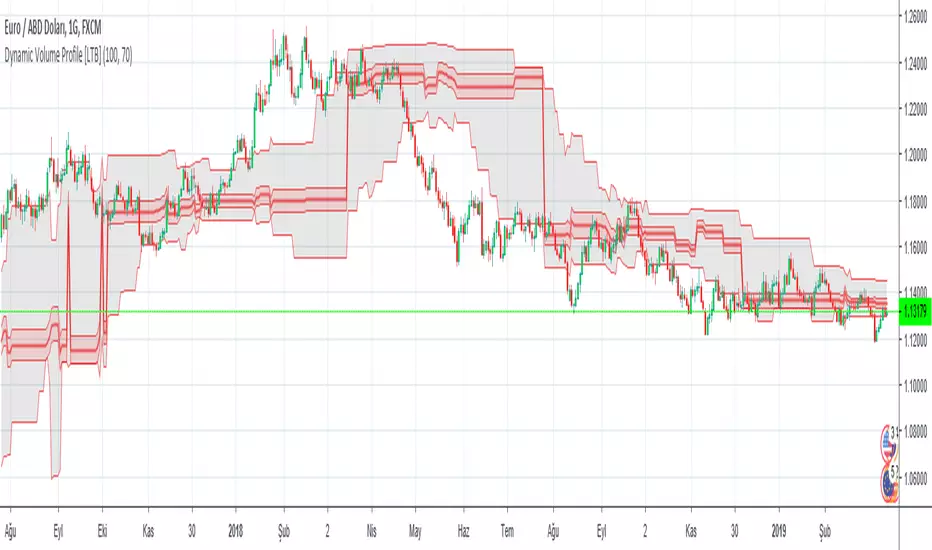
Dynamic Volume Profile [LTB]Dynamic Volume Profile (DVP) is an advanced charting study that displays trading activity over a specified time period at specified price levels dynamically.
DVP typically based on price and volume information and it combines these factors in a way that displays price, volume and time frame on a single chart dynamically. You can gather a multitude of information with a glance.
The first thing that most traders will use dynamic volume profile for is identifying basic support and resistance levels. It is important to note that using Dynamic Volume Profile as an identifier for support and resistance levels is a reactive method.
Point of Control (PoC): It refers to the area in the chart with the most traded volume activity. This is by far the most relevant area you want to monitor as it can help to define the placement of your stops or the areas in the chart where you might find the most pristine entry levels. The highest concentrated area of volume for a particular period of time we will call it PoC or Point of Control and you will be surprised how many times it acts as a wall on a retest. Traders tend to factor this in as an area of support or resistance.
Value Area (VA): The range of price levels in which a specified percentage of all volume was traded. By default, the industry standards tends to be 70%.
Value Area High (VAH) – The highest price level within the value area.
Value Area Low (VAL) – The lowest price level within the value area.
The script creates 10 channels according to highest/lowest levels for specified time period and finds the total volume for each channel. Then it calculates Point of Control, Value area and VAH/VAL. the script shows POC channel and Value Area, and you can see VAH/VAL ve all channels optionally.
Some useful resources:
www.tradingview.com
medium.com
If you find my works useful, please consider a donation
BTC: 16XRqyS3Vgh1knAU1tCcruqhUrVm4QWWmR
Author: LonesomeTheBlue