Buy When There's Blood in the Streets StrategyStatistical Analysis of Drawdowns in Stock Markets
Drawdowns, defined as the decline from a peak to a trough in asset prices, are an essential measure of risk and market dynamics. Their statistical properties provide insights into market behavior during extreme stress periods.
Distribution of Drawdowns: Research suggests that drawdowns follow a power-law distribution, implying that large drawdowns, while rare, are more frequent than expected under normal distributions (Sornette et al., 2003).
Impacts of Extreme Drawdowns: During significant drawdowns (e.g., financial crises), the average recovery time is significantly longer, highlighting market inefficiencies and behavioral biases. For example, the 2008 financial crisis led to a 57% drawdown in the S&P 500, requiring years to recover (Cont, 2001).
Using Standard Deviations: Drawdowns exceeding two or three standard deviations from their historical mean are often indicative of market overreaction or capitulation, creating contrarian investment opportunities (Taleb, 2007).
Behavioral Finance Perspective: Investors often exhibit panic-selling during drawdowns, leading to oversold conditions that can be exploited using statistical thresholds like standard deviations (Kahneman, 2011).
Practical Implications: Studies on mean reversion show that extreme drawdowns are frequently followed by periods of recovery, especially in equity markets. This underpins strategies that "buy the dip" under specific, statistically derived conditions (Jegadeesh & Titman, 1993).
References:
Sornette, D., & Johansen, A. (2003). Stock market crashes and endogenous dynamics.
Cont, R. (2001). Empirical properties of asset returns: stylized facts and statistical issues. Quantitative Finance.
Taleb, N. N. (2007). The Black Swan: The Impact of the Highly Improbable.
Kahneman, D. (2011). Thinking, Fast and Slow.
Jegadeesh, N., & Titman, S. (1993). Returns to Buying Winners and Selling Losers: Implications for Stock Market Efficiency.
Educational
STRATEGY Fibonacci Levels with High/Low Criteria - AYNET
Here is an explanation of the Fibonacci Levels Strategy with High/Low Criteria script:
Overview
This strategy combines Fibonacci retracement levels with high/low criteria to generate buy and sell signals based on price crossing specific thresholds. It utilizes higher timeframe (HTF) candlesticks and user-defined lookback periods for high/low levels.
Key Features
Higher Timeframe Integration:
The script calculates the open, high, low, and close values of the higher timeframe (HTF) candlestick.
Users can choose to calculate levels based on the current or the last HTF candle.
Fibonacci Levels:
Fibonacci retracement levels are dynamically calculated based on the HTF candlestick's range (high - low).
Users can customize the levels (0.000, 0.236, 0.382, 0.500, 0.618, 0.786, 1.000).
High/Low Lookback Criteria:
The script evaluates the highest high and lowest low over user-defined lookback periods.
These levels are plotted on the chart for visual reference.
Trade Signals:
Long Signal: Triggered when the close price crosses above both:
The lowest price criteria (lookback period).
The Fibonacci level 3 (default: 0.5).
Short Signal: Triggered when the close price crosses below both:
The highest price criteria (lookback period).
The Fibonacci level 3 (default: 0.5).
Visualization:
Plots Fibonacci levels and high/low criteria on the chart for easy interpretation.
Inputs
Higher Timeframe:
Users can select the timeframe (default: Daily) for the HTF candlestick.
Option to calculate based on the current or last HTF candle.
Lookback Periods:
lowestLookback: Number of bars for the lowest low calculation (default: 20).
highestLookback: Number of bars for the highest high calculation (default: 10).
Fibonacci Levels:
Fully customizable Fibonacci levels ranging from 0.000 to 1.000.
Visualization
Fibonacci Levels:
Plots six customizable Fibonacci levels with distinct colors and transparency.
High/Low Criteria:
Plots the highest and lowest levels based on the lookback periods as reference lines.
Trading Logic
Long Condition:
Price must close above:
The lowest price criteria (lowcriteria).
The Fibonacci level 3 (50% retracement).
Short Condition:
Price must close below:
The highest price criteria (highcriteria).
The Fibonacci level 3 (50% retracement).
Use Case
Trend Reversal Strategy:
Combines Fibonacci retracement with recent high/low criteria to identify potential reversal or breakout points.
Custom Timeframe Analysis:
Incorporates higher timeframe data for multi-timeframe trading strategies.

Fibonacci Levels Strategy with High/Low Criteria-AYNETThis code represents a TradingView strategy that uses Fibonacci levels in conjunction with high/low price criteria over specified lookback periods to determine buy (long) and sell (short) conditions. Below is an explanation of each main part of the code:
Explanation of Key Sections
User Inputs for Higher Time Frame and Candle Settings
Users can select a higher time frame (timeframe) for analysis and specify whether to use the "Current" or "Last" higher time frame (HTF) candle for calculating Fibonacci levels.
The currentlast setting allows flexibility between using real-time or the most recent closed higher time frame candle.
Lookback Periods for High/Low Criteria
Two lookback periods, lowestLookback and highestLookback, allow users to set the number of bars to consider when finding the lowest and highest prices, respectively.
This determines the criteria for entering trades based on how recent highs or lows compare to current prices.
Fibonacci Levels Configuration
Fibonacci levels (0%, 23.6%, 38.2%, 50%, 61.8%, 78.6%, and 100%) are configurable. These are used to calculate price levels between the high and low of the higher time frame candle.
Each level represents a retracement or extension relative to the high/low range of the HTF candle, providing important price levels for decision-making.
HTF Candle Calculation
HTF candle data is calculated based on the higher time frame selected by the user, using the newbar check to reset htfhigh, htflow, and htfopen values.
The values are updated with each new HTF bar or as prices move within the same HTF bar to track the highest high and lowest low accurately.
Set Fibonacci Levels Array
Using the calculated HTF candle's high, low, and open, the Fibonacci levels are computed by interpolating these values according to the user-defined Fibonacci levels.
A fibLevels array stores these computed values.
Plotting Fibonacci Levels
Each Fibonacci level is plotted on the chart with a different color, providing visual indicators for potential support/resistance levels.
High/Low Price Criteria Calculation
The lowest and highest prices over the specified lookback periods (lowestLookback and highestLookback) are calculated and plotted on the chart. These serve as dynamic levels to trigger long or short entries.
Trade Signal Conditions
longCondition: A long (buy) signal is generated when the price crosses above both the lowest price criteria and the 50% Fibonacci level.
shortCondition: A short (sell) signal is generated when the price crosses below both the highest price criteria and the 50% Fibonacci level.
Executing Trades
Based on the longCondition and shortCondition, trades are entered with the strategy.entry() function, using the labels "Long" and "Short" for tracking on the chart.
Strategy Use
This strategy allows traders to utilize Fibonacci retracement levels and recent highs/lows to identify trend continuation or reversal points, potentially providing entry points aligned with larger market structure. Adjusting the lowestLookback and highestLookback along with Fibonacci levels enables a customizable approach to suit different trading styles and market conditions.

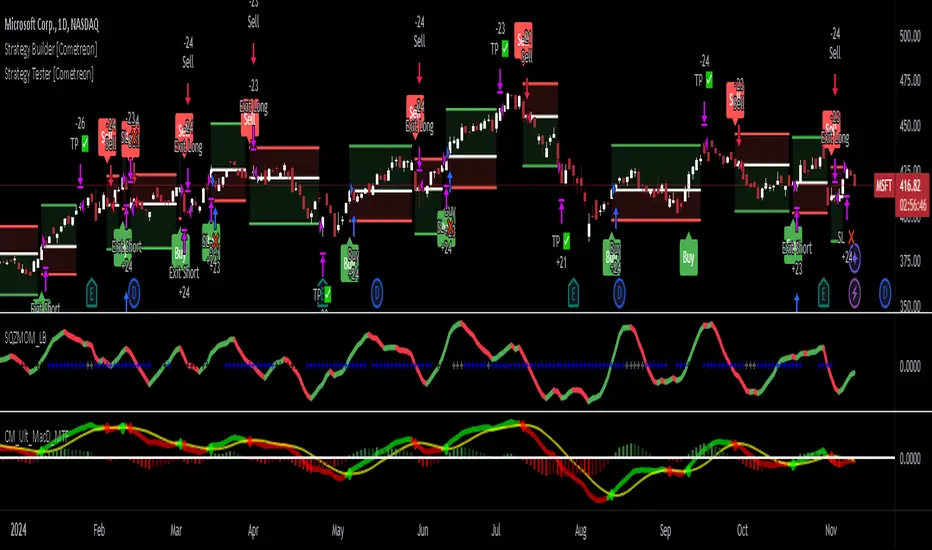
Strategy Tester [Cometreon]Strategy Tester is a powerful backtesting engine designed to evaluate and optimize trading strategies built with the Strategy Builder or signals triggered by the Signal Tester.
It provides a full-featured environment for assessing strategy performance across symbols and timeframes, offering smart tools for risk management, capital allocation, and alert handling.
Whether you're refining a custom strategy or validating signals, Strategy Tester helps you test with confidence and clarity.
🔷 Key Features
🟩 Multi-Symbol, Multi-Timeframe Testing
Easily test strategies across different assets and timeframes to understand how they behave in diverse market conditions.
🟩 Advanced Risk Management
Implement multiple Take Profit and Stop Loss combinations, break-even, trailing systems, and exit rules tailored to your style.
🟩 Flexible Session and Capital Settings
Customize trading hours, session windows, and initial capital allocation for ultra-precise testing scenarios.
🟩 Custom Alerts
Generate personalized alerts for entries, exits, and SL/TP adjustments to simulate real-time execution.
🔷 Technical Details and Customizable Inputs
1️⃣ Source Entry Long and Short - Select entry conditions for the strategy from the "Signal Tester" or "Strategy Builder".
2️⃣ Source Exit Long and Short - Select exit conditions for the strategy from the "Signal Tester" or "Strategy Builder".
3️⃣ Trading Session - Choose the period in which the strategy will enter positions, selecting from: Months, Days, up to 3 hourly sessions, and the strategy's activity range, i.e., start and end date.
4️⃣ Alert Message - Set custom messages for each type of Alert, such as Entry Long, Exit Short, or Change SL Long.
5️⃣ Plot - Choose whether to show Long and Short positions on the chart.
🔷 Risk Management Settings
1️⃣ Initial Capital - Set the starting capital for the strategy.
2️⃣ Quantity - Choose the entry quantity for each type of position, selecting from: Contracts, USD, Percentage of equity, or percentage of initial capital.
3️⃣ Take Profit - Configure up to 4 Take Profits using one of the following types:
%: Percentage from the entry price
USD: Distance in dollars
Pip: Distance in Pips
ATR: Based on ATR multiplier
Swing: Uses swing length
Risk Reward: Linked to Stop Loss or vice versa
4️⃣ Stop Loss - Set the SL using the same types as TP for maximum flexibility.
5️⃣ Break Even - Automatically modify SL when price hits a TP level, adjusting by % / USD / Pip from entry.
6️⃣ Trailing Take Profit - Activates a dynamic TP when a condition is met, updating it as price evolves (e.g., new highs).
7️⃣ Trailing Stop Loss - Updates SL automatically when the market moves in your favor (e.g., new lows in long trades).
8️⃣ Exit Before End Session - Exit positions a few candles before the session ends to avoid overnight risks.
🔍 How to Use Strategy Tester
🧩 Add the Indicator:
Load Strategy Tester onto your chart and connect it to any Cometreon signal generator.
⚙️ Configure Risk Settings:
Set up capital, risk, SL/TP parameters, and time filters to match your strategy profile.
🧪 Run the Test:
Execute the backtest and analyze the visual + data output for insight.
📊 Optimize and Repeat:
Adjust key parameters and re-run until your strategy achieves optimal performance.
☄️ Take your trading to the next level with TradeLab Beta's Strategy Tester this powerful backtesting tool and start optimizing your trading strategies today.
👉 Don't waste any more time and visit the link to get access to all Cometreon indicators.
CCI Threshold StrategyThe CCI Threshold Strategy is a trading approach that utilizes the Commodity Channel Index (CCI) as a momentum indicator to identify potential buy and sell signals in financial markets. The CCI is particularly effective in detecting overbought and oversold conditions, providing traders with insights into possible price reversals. This strategy is designed for use in various financial instruments, including stocks, commodities, and forex, and aims to capitalize on price movements driven by market sentiment.
Commodity Channel Index (CCI)
The CCI was developed by Donald Lambert in the 1980s and is primarily used to measure the deviation of a security's price from its average price over a specified period.
The formula for CCI is as follows:
CCI=(TypicalPrice−SMA)×0.015MeanDeviation
CCI=MeanDeviation(TypicalPrice−SMA)×0.015
where:
Typical Price = (High + Low + Close) / 3
SMA = Simple Moving Average of the Typical Price
Mean Deviation = Average of the absolute deviations from the SMA
The CCI oscillates around a zero line, with values above +100 indicating overbought conditions and values below -100 indicating oversold conditions (Lambert, 1980).
Strategy Logic
The CCI Threshold Strategy operates on the following principles:
Input Parameters:
Lookback Period: The number of periods used to calculate the CCI. A common choice is 9, as it balances responsiveness and noise.
Buy Threshold: Typically set at -90, indicating a potential oversold condition where a price reversal is likely.
Stop Loss and Take Profit: The strategy allows for risk management through customizable stop loss and take profit points.
Entry Conditions:
A long position is initiated when the CCI falls below the buy threshold of -90, indicating potential oversold levels. This condition suggests that the asset may be undervalued and due for a price increase.
Exit Conditions:
The long position is closed when the closing price exceeds the highest price of the previous day, indicating a bullish reversal. Additionally, if the stop loss or take profit thresholds are hit, the position will be exited accordingly.
Risk Management:
The strategy incorporates optional stop loss and take profit mechanisms, which can be toggled on or off based on trader preference. This allows for flexibility in risk management, aligning with individual risk tolerances and trading styles.
Benefits of the CCI Threshold Strategy
Flexibility: The CCI Threshold Strategy can be applied across different asset classes, making it versatile for various market conditions.
Objective Signals: The use of quantitative thresholds for entry and exit reduces emotional bias in trading decisions (Tversky & Kahneman, 1974).
Enhanced Risk Management: By allowing traders to set stop loss and take profit levels, the strategy aids in preserving capital and managing risk effectively.
Limitations
Market Noise: The CCI can produce false signals, especially in highly volatile markets, leading to potential losses (Bollinger, 2001).
Lagging Indicator: As a lagging indicator, the CCI may not always capture rapid market movements, resulting in missed opportunities (Pring, 2002).
Conclusion
The CCI Threshold Strategy offers a systematic approach to trading based on well-established momentum principles. By focusing on overbought and oversold conditions, traders can make informed decisions while managing risk effectively. As with any trading strategy, it is crucial to backtest the approach and adapt it to individual trading styles and market conditions.
References
Bollinger, J. (2001). Bollinger on Bollinger Bands. New York: McGraw-Hill.
Lambert, D. (1980). Commodity Channel Index. Technical Analysis of Stocks & Commodities, 2, 3-5.
Pring, M. J. (2002). Technical Analysis Explained. New York: McGraw-Hill.
Tversky, A., & Kahneman, D. (1974). Judgment under uncertainty: Heuristics and biases. Science, 185(4157), 1124-1131.

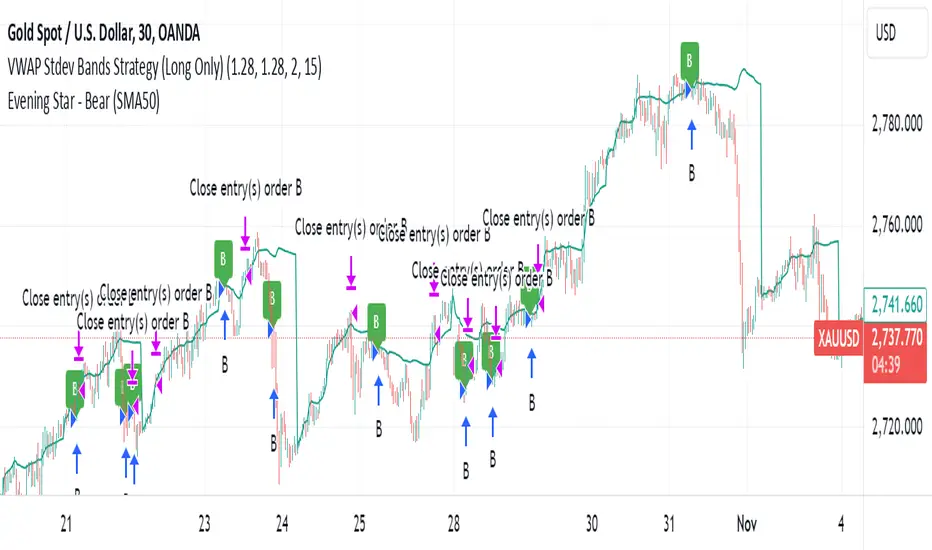
VWAP Stdev Bands Strategy (Long Only)The VWAP Stdev Bands Strategy (Long Only) is designed to identify potential long entry points in trending markets by utilizing the Volume Weighted Average Price (VWAP) and standard deviation bands. This strategy focuses on capturing upward price movements, leveraging statistical measures to determine optimal buy conditions.
Key Features:
VWAP Calculation: The strategy calculates the VWAP, which represents the average price a security has traded at throughout the day, weighted by volume. This is an essential indicator for determining the overall market trend.
Standard Deviation Bands: Two bands are created above and below the VWAP, calculated using specified standard deviations. These bands act as dynamic support and resistance levels, providing insight into price volatility and potential reversal points.
Trading Logic:
Long Entry Condition: A long position is triggered when the price crosses below the lower standard deviation band and then closes above it, signaling a potential price reversal to the upside.
Profit Target: The strategy allows users to set a predefined profit target, closing the long position once the specified target is reached.
Time Gap Between Orders: A customizable time gap can be specified to prevent multiple orders from being placed in quick succession, allowing for a more controlled trading approach.
Visualization: The VWAP and standard deviation bands are plotted on the chart with distinct colors, enabling traders to visually assess market conditions. The strategy also provides optional plotting of the previous day's VWAP for added context.
Use Cases:
Ideal for traders looking to engage in long-only positions within trending markets.
Suitable for intraday trading strategies or longer-term approaches based on market volatility.
Customization Options:
Users can adjust the standard deviation values, profit target, and time gap to tailor the strategy to their specific trading style and market conditions.
Note: As with any trading strategy, it is important to conduct thorough backtesting and analysis before live trading. Market conditions can change, and past performance does not guarantee future results.
Dual Momentum StrategyThis Pine Script™ strategy implements the "Dual Momentum" approach developed by Gary Antonacci, as presented in his book Dual Momentum Investing: An Innovative Strategy for Higher Returns with Lower Risk (McGraw Hill Professional, 2014). Dual momentum investing combines relative momentum and absolute momentum to maximize returns while minimizing risk. Relative momentum involves selecting the asset with the highest recent performance between two options (a risky asset and a safe asset), while absolute momentum considers whether the chosen asset has a positive return over a specified lookback period.
In this strategy:
Risky Asset (SPY): Represents a stock index fund, typically more volatile but with higher potential returns.
Safe Asset (TLT): Represents a bond index fund, which generally has lower volatility and acts as a hedge during market downturns.
Monthly Momentum Calculation: The momentum for each asset is calculated based on its price change over the last 12 months. Only assets with a positive momentum (absolute momentum) are considered for investment.
Decision Rules:
Invest in the risky asset if its momentum is positive and greater than that of the safe asset.
If the risky asset’s momentum is negative or lower than the safe asset's, the strategy shifts the allocation to the safe asset.
Scientific Reference
Antonacci's work on dual momentum investing has shown the strategy's ability to outperform traditional buy-and-hold methods while reducing downside risk. This approach has been reviewed and discussed in both academic and investment publications, highlighting its strong risk-adjusted returns (Antonacci, 2014).
Reference: Antonacci, G. (2014). Dual Momentum Investing: An Innovative Strategy for Higher Returns with Lower Risk. McGraw Hill Professional.

S&P 100 Option Expiration Week StrategyThe Option Expiration Week Strategy aims to capitalize on increased volatility and trading volume that often occur during the week leading up to the expiration of options on stocks in the S&P 100 index. This period, known as the option expiration week, culminates on the third Friday of each month when stock options typically expire in the U.S. During this week, investors in this strategy take a long position in S&P 100 stocks or an equivalent ETF from the Monday preceding the third Friday, holding until Friday. The strategy capitalizes on potential upward price pressures caused by increased option-related trading activity, rebalancing, and hedging practices.
The phenomenon leveraged by this strategy is well-documented in finance literature. Studies demonstrate that options expiration dates have a significant impact on stock returns, trading volume, and volatility. This effect is driven by various market dynamics, including portfolio rebalancing, delta hedging by option market makers, and the unwinding of positions by institutional investors (Stoll & Whaley, 1987; Ni, Pearson, & Poteshman, 2005). These market activities intensify near option expiration, causing price adjustments that may create short-term profitable opportunities for those aware of these patterns (Roll, Schwartz, & Subrahmanyam, 2009).
The paper by Johnson and So (2013), Returns and Option Activity over the Option-Expiration Week for S&P 100 Stocks, provides empirical evidence supporting this strategy. The study analyzes the impact of option expiration on S&P 100 stocks, showing that these stocks tend to exhibit abnormal returns and increased volume during the expiration week. The authors attribute these patterns to intensified option trading activity, where demand for hedging and arbitrage around options expiration causes temporary price adjustments.
Scientific Explanation
Research has found that option expiration weeks are marked by predictable increases in stock returns and volatility, largely due to the role of options market makers and institutional investors. Option market makers often use delta hedging to manage exposure, which requires frequent buying or selling of the underlying stock to maintain a hedged position. As expiration approaches, their activity can amplify price fluctuations. Additionally, institutional investors often roll over or unwind positions during expiration weeks, creating further demand for underlying stocks (Stoll & Whaley, 1987). This increased demand around expiration week typically leads to temporary stock price increases, offering profitable opportunities for short-term strategies.
Key Research and Bibliography
Johnson, T. C., & So, E. C. (2013). Returns and Option Activity over the Option-Expiration Week for S&P 100 Stocks. Journal of Banking and Finance, 37(11), 4226-4240.
This study specifically examines the S&P 100 stocks and demonstrates that option expiration weeks are associated with abnormal returns and trading volume due to increased activity in the options market.
Stoll, H. R., & Whaley, R. E. (1987). Program Trading and Expiration-Day Effects. Financial Analysts Journal, 43(2), 16-28.
Stoll and Whaley analyze how program trading and portfolio insurance strategies around expiration days impact stock prices, leading to temporary volatility and increased trading volume.
Ni, S. X., Pearson, N. D., & Poteshman, A. M. (2005). Stock Price Clustering on Option Expiration Dates. Journal of Financial Economics, 78(1), 49-87.
This paper investigates how option expiration dates affect stock price clustering and volume, driven by delta hedging and other option-related trading activities.
Roll, R., Schwartz, E., & Subrahmanyam, A. (2009). Options Trading Activity and Firm Valuation. Journal of Financial Markets, 12(3), 519-534.
The authors explore how options trading activity influences firm valuation, finding that higher options volume around expiration dates can lead to temporary price movements in underlying stocks.
Cao, C., & Wei, J. (2010). Option Market Liquidity and Stock Return Volatility. Journal of Financial and Quantitative Analysis, 45(2), 481-507.
This study examines the relationship between options market liquidity and stock return volatility, finding that increased liquidity needs during expiration weeks can heighten volatility, impacting stock returns.
Summary
The Option Expiration Week Strategy utilizes well-researched financial market phenomena related to option expiration. By positioning long in S&P 100 stocks or ETFs during this period, traders can potentially capture abnormal returns driven by option market dynamics. The literature suggests that options-related activities—such as delta hedging, position rollovers, and portfolio adjustments—intensify demand for underlying assets, creating short-term profit opportunities around these key dates.

Payday Anomaly StrategyThe "Payday Effect" refers to a predictable anomaly in financial markets where stock returns exhibit significant fluctuations around specific pay periods. Typically, these are associated with the beginning, middle, or end of the month when many investors receive wages and salaries. This influx of funds, often directed automatically into retirement accounts or investment portfolios (such as 401(k) plans in the United States), temporarily increases the demand for equities. This phenomenon has been linked to a cycle where stock prices rise disproportionately on and around payday periods due to increased buy-side liquidity.
Academic research on the payday effect suggests that this pattern is tied to systematic cash flows into financial markets, primarily driven by employee retirement and savings plans. The regularity of these cash infusions creates a calendar-based pattern that can be exploited in trading strategies. Studies show that returns on days around typical payroll dates tend to be above average, and this pattern remains observable across various time periods and regions.
The rationale behind the payday effect is rooted in the behavioral tendencies of investors, specifically the automatic reinvestment mechanisms used in retirement funds, which align with monthly or semi-monthly salary payments. This regular injection of funds can cause market microstructure effects where stock prices temporarily increase, only to stabilize or reverse after the funds have been invested. Consequently, the payday effect provides traders with a potentially profitable opportunity by predicting these inflows.
Scientific Bibliography on the Payday Effect
Ma, A., & Pratt, W. R. (2017). Payday Anomaly: The Market Impact of Semi-Monthly Pay Periods. Social Science Research Network (SSRN).
This study provides a comprehensive analysis of the payday effect, exploring how returns tend to peak around payroll periods due to semi-monthly cash flows. The paper discusses how systematic inflows impact returns, leading to predictable stock performance patterns on specific days of the month.
Lakonishok, J., & Smidt, S. (1988). Are Seasonal Anomalies Real? A Ninety-Year Perspective. The Review of Financial Studies, 1(4), 403-425.
This foundational study explores calendar anomalies, including the payday effect. By examining data over nearly a century, the authors establish a framework for understanding seasonal and monthly patterns in stock returns, which provides historical support for the payday effect.
Owen, S., & Rabinovitch, R. (1983). On the Predictability of Common Stock Returns: A Step Beyond the Random Walk Hypothesis. Journal of Business Finance & Accounting, 10(3), 379-396.
This paper investigates predictability in stock returns beyond random fluctuations. It considers payday effects among various calendar anomalies, arguing that certain dates yield predictable returns due to regular cash inflows.
Loughran, T., & Schultz, P. (2005). Liquidity: Urban versus Rural Firms. Journal of Financial Economics, 78(2), 341-374.
While primarily focused on liquidity, this study provides insight into how cash flows, such as those from semi-monthly paychecks, influence liquidity levels and consequently impact stock prices around predictable pay dates.
Ariel, R. A. (1990). High Stock Returns Before Holidays: Existence and Evidence on Possible Causes. The Journal of Finance, 45(5), 1611-1626.
Ariel’s work highlights stock return patterns tied to certain dates, including paydays. Although the study focuses on pre-holiday returns, it suggests broader implications of predictable investment timing, reinforcing the calendar-based effects seen with payday anomalies.
Summary
Research on the payday effect highlights a repeating pattern in stock market returns driven by scheduled payroll investments. This cyclical increase in stock demand aligns with behavioral finance insights and market microstructure theories, offering a valuable basis for trading strategies focused on the beginning, middle, and end of each month.

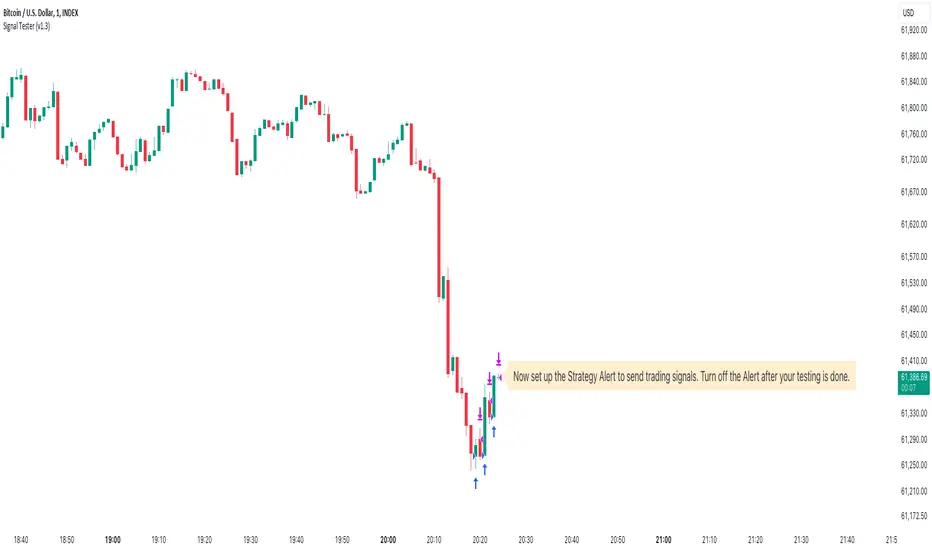
Customizable BTC Seasonality StrategyThis strategy leverages intraday seasonality effects in Bitcoin, specifically targeting hours of statistically significant returns during periods when traditional financial markets are closed. Padysak and Vojtko (2022) demonstrate that Bitcoin exhibits higher-than-average returns from 21:00 UTC to 23:00 UTC, a period in which all major global exchanges, such as the New York Stock Exchange (NYSE), Tokyo Stock Exchange, and London Stock Exchange, are closed. The absence of competing trading activity from traditional markets during these hours appears to contribute to these statistically significant returns.
The strategy proceeds as follows:
Entry Time: A long position in Bitcoin is opened at a user-specified time, which defaults to 21:00 UTC, aligning with the beginning of the identified high-return window.
Holding Period: The position is held for two hours, capturing the positive returns typically observed during this period.
Exit Time: The position is closed at a user-defined time, defaulting to 23:00 UTC, allowing the strategy to exit as the favorable period concludes.
This simple seasonality strategy aims to achieve a 33% annualized return with a notably reduced volatility of 20.93% and maximum drawdown of -22.45%. The results suggest that investing only during these high-return hours is more stable and less risky than a passive holding strategy (Padysak & Vojtko, 2022).
References
Padysak, M., & Vojtko, R. (2022). Seasonality, Trend-following, and Mean reversion in Bitcoin.

Keltner Channel Strategy by Kevin DaveyKeltner Channel Strategy Description
The Keltner Channel Strategy is a volatility-based trading approach that uses the Keltner Channel, a technical indicator derived from the Exponential Moving Average (EMA) and Average True Range (ATR). The strategy helps identify potential breakout or mean-reversion opportunities in the market by plotting upper and lower bands around a central EMA, with the channel width determined by a multiplier of the ATR.
Components:
1. Exponential Moving Average (EMA):
The EMA smooths price data by placing greater weight on recent prices, allowing traders to track the market’s underlying trend more effectively than a simple moving average (SMA). In this strategy, a 20-period EMA is used as the midline of the Keltner Channel.
2. Average True Range (ATR):
The ATR measures market volatility over a 14-period lookback. By calculating the average of the true ranges (the greatest of the current high minus the current low, the absolute value of the current high minus the previous close, or the absolute value of the current low minus the previous close), the ATR captures how much an asset typically moves over a given period.
3. Keltner Channel:
The upper and lower boundaries are set by adding or subtracting 1.5 times the ATR from the EMA. These boundaries create a dynamic range that adjusts with market volatility.
Trading Logic:
• Long Entry Condition: The strategy enters a long position when the closing price falls below the lower Keltner Channel, indicating a potential buying opportunity at a support level.
• Short Entry Condition: The strategy enters a short position when the closing price exceeds the upper Keltner Channel, signaling a potential selling opportunity at a resistance level.
The strategy plots the upper and lower Keltner Channels and the EMA on the chart, providing a visual representation of support and resistance levels based on market volatility.
Scientific Support for Volatility-Based Strategies:
The use of volatility-based indicators like the Keltner Channel is supported by numerous studies on price momentum and volatility trading. Research has shown that breakout strategies, particularly those leveraging volatility bands such as the Keltner Channel or Bollinger Bands, can be effective in capturing trends and reversals in both trending and mean-reverting markets  .
Who is Kevin Davey?
Kevin Davey is a highly respected algorithmic trader, author, and educator, known for his systematic approach to building and optimizing trading strategies. With over 25 years of experience in the markets, Davey has earned a reputation as an expert in quantitative and rule-based trading. He is particularly well-known for winning several World Cup Trading Championships, where he consistently demonstrated high returns with low risk.

Advanced Multi-Seasonality StrategyThe Multi-Seasonality Strategy is a trading system based on seasonal market patterns. Seasonality refers to recurring market trends driven by predictable calendar-based events. These patterns emerge due to economic cycles, corporate activities (e.g., earnings reports), and investor behavior around specific times of the year. Studies have shown that such effects can influence asset prices over defined periods, leading to opportunities for traders who exploit these patterns (Hirshleifer, 2001; Bouman & Jacobsen, 2002).
How the Strategy Works:
The strategy allows the user to define four distinct periods within a calendar year. For each period, the trader selects:
Entry Date (Month and Day): The date to enter the trade.
Holding Period: The number of trading days to remain in the trade after the entry.
Trade Direction: Whether to take a long or short position during that period.
The system is designed with flexibility, enabling the user to activate or deactivate each of the four periods. The idea is to take advantage of seasonal patterns, such as buying during historically strong periods and selling during weaker ones. A well-known example is the "Sell in May and Go Away" phenomenon, which suggests that stock returns are higher from November to April and weaker from May to October (Bouman & Jacobsen, 2002).
Seasonality in Financial Markets:
Seasonal effects have been documented across different asset classes and markets:
Equities: Stock markets tend to exhibit higher returns during certain months, such as the "January effect," where prices rise after year-end tax-loss selling (Haugen & Lakonishok, 1987).
Commodities: Agricultural commodities often follow seasonal planting and harvesting cycles, which impact supply and demand patterns (Fama & French, 1987).
Forex: Currency pairs may show strength or weakness during specific quarters based on macroeconomic factors, such as fiscal year-end flows or central bank policy decisions.
Scientific Basis:
Research shows that market anomalies like seasonality are linked to behavioral biases and institutional practices. For example, investors may respond to tax incentives at the end of the year, and companies may engage in window dressing (Haugen & Lakonishok, 1987). Additionally, macroeconomic factors, such as monetary policy shifts and holiday trading volumes, can also contribute to predictable seasonal trends (Bouman & Jacobsen, 2002).
Risks of Seasonal Trading:
While the strategy seeks to exploit predictable patterns, there are inherent risks:
Market Changes: Seasonal effects observed in the past may weaken or disappear as market conditions evolve. Increased algorithmic trading, globalization, and policy changes can reduce the reliability of historical patterns (Lo, 2004).
Overfitting: One of the risks in seasonal trading is overfitting the strategy to historical data. A pattern that worked in the past may not necessarily work in the future, especially if it was based on random chance or external factors that no longer apply (Sullivan, Timmermann, & White, 1999).
Liquidity and Volatility: Trading during specific periods may expose the trader to low liquidity, especially around holidays or earnings seasons, leading to slippage and larger-than-expected price swings.
Economic and Geopolitical Shocks: External events such as pandemics, wars, or political instability can disrupt seasonal patterns, leading to unexpected market behavior.
Conclusion:
The Multi-Seasonality Strategy capitalizes on the predictable nature of certain calendar-based patterns in financial markets. By entering and exiting trades based on well-established seasonal effects, traders can potentially capture short-term profits. However, caution is necessary, as market dynamics can change, and seasonal patterns are not guaranteed to persist. Rigorous backtesting, combined with risk management practices, is essential to successfully implementing this strategy.
References:
Bouman, S., & Jacobsen, B. (2002). The Halloween Indicator, "Sell in May and Go Away": Another Puzzle. American Economic Review, 92(5), 1618-1635.
Fama, E. F., & French, K. R. (1987). Commodity Futures Prices: Some Evidence on Forecast Power, Premiums, and the Theory of Storage. Journal of Business, 60(1), 55-73.
Haugen, R. A., & Lakonishok, J. (1987). The Incredible January Effect: The Stock Market's Unsolved Mystery. Dow Jones-Irwin.
Hirshleifer, D. (2001). Investor Psychology and Asset Pricing. Journal of Finance, 56(4), 1533-1597.
Lo, A. W. (2004). The Adaptive Markets Hypothesis: Market Efficiency from an Evolutionary Perspective. Journal of Portfolio Management, 30(5), 15-29.
Sullivan, R., Timmermann, A., & White, H. (1999). Data-Snooping, Technical Trading Rule Performance, and the Bootstrap. Journal of Finance, 54(5), 1647-1691.
This strategy harnesses the power of seasonality but requires careful consideration of the risks and potential changes in market behavior over time.

Statistical ArbitrageThe Statistical Arbitrage Strategy, also known as pairs trading, is a quantitative trading method that capitalizes on price discrepancies between two correlated assets. The strategy assumes that over time, the prices of these two assets will revert to their historical relationship. The core idea is to take advantage of mean reversion, a principle suggesting that asset prices will revert to their long-term average after deviating significantly.
Strategy Mechanics:
1. Selection of Correlated Assets:
• The strategy focuses on two historically correlated assets (e.g., equity index futures like Dow Jones Mini and S&P 500 Mini). These assets tend to move in the same direction due to similar underlying fundamentals, such as overall market conditions. By tracking their relative prices, the strategy seeks to exploit temporary mispricings.
2. Spread Calculation:
• The spread is the difference between the prices of the two assets. This spread represents the relationship between the assets and serves as the basis for determining when to enter or exit trades.
3. Mean and Standard Deviation:
• The historical average (mean) of the spread is calculated using a Simple Moving Average (SMA) over a chosen period. The strategy also computes the standard deviation (volatility) of the spread, which measures how far the spread has deviated from the mean over time. This allows the strategy to define statistically significant price deviations.
4. Entry Signal (Mean Reversion):
• A buy signal is triggered when the spread falls below the mean by a multiple (e.g., two) of the standard deviation. This indicates that one asset is temporarily undervalued relative to the other, and the strategy expects the spread to revert to its mean, generating profits as the prices converge.
5. Exit Signal:
• The strategy exits the trade when the spread reverts to the mean. At this point, the mispricing has been corrected, and the profit from the mean reversion is realized.
Academic Support:
Statistical arbitrage has been widely studied in finance and economics. Gatev, Goetzmann, and Rouwenhorst’s (2006) landmark study on pairs trading demonstrated that this strategy could generate excess returns in equity markets. Their research found that by focusing on historically correlated stocks, traders could identify pricing anomalies and profit from their eventual correction.
Additionally, Avellaneda and Lee (2010) explored statistical arbitrage in different asset classes and found that exploiting deviations in price relationships can offer a robust, market-neutral trading strategy. In these studies, the strategy’s success hinges on the stability of the relationship between the assets and the timely execution of trades when deviations occur.
Risks of Statistical Arbitrage:
1. Correlation Breakdown:
• One of the primary risks is the breakdown of correlation between the two assets. Statistical arbitrage assumes that the historical relationship between the assets will hold in the future. However, market conditions, company fundamentals, or external shocks (e.g., macroeconomic changes) can cause these assets to deviate permanently, leading to potential losses.
• For instance, if two equity indices historically move together but experience divergent economic conditions or policy changes, their prices may no longer revert to the expected mean.
2. Execution Risk:
• This strategy relies on efficient execution and tight spreads. In volatile or illiquid markets, the actual price at which trades are executed may differ significantly from expected prices, leading to slippage and reduced profits.
3. Market Risk:
• Although statistical arbitrage is designed to be market-neutral (i.e., not dependent on the overall market direction), it is not entirely risk-free. Systematic market shocks, such as financial crises or sudden shifts in market sentiment, can affect both assets simultaneously, causing the spread to widen rather than revert to the mean.
4. Model Risk:
• The assumptions underlying the strategy, particularly regarding mean reversion, may not always hold true. The model assumes that asset prices will return to their historical averages within a certain timeframe, but the timing and magnitude of mean reversion can be uncertain. Misestimating this timeframe can lead to extended drawdowns or unrealized losses.
5. Overfitting:
• Over-reliance on historical data to fine-tune the strategy parameters (e.g., the lookback period or standard deviation thresholds) may result in overfitting. This means that the strategy works well on past data but fails to perform in live markets due to changing conditions.
Conclusion:
The Statistical Arbitrage Strategy offers a systematic and quantitative approach to trading that capitalizes on temporary price inefficiencies between correlated assets. It has been proven to generate returns in academic studies and is widely used by hedge funds and institutional traders for its market-neutral characteristics. However, traders must be aware of the inherent risks, including correlation breakdown, execution risks, and the potential for prolonged deviations from the mean. Effective risk management, diversification, and constant monitoring are essential for successfully implementing this strategy in live markets.

G-Channel with EMA StrategyThe G-Channel is a custom channel with an upper (a), lower (b), and average (avg) line. These lines are dynamically calculated based on the current and previous closing prices, using the length input (default 100) to smooth the values:
Upper Line (a): This is the maximum value of the current price or the previous upper value, adjusted by the difference between the upper and lower lines divided by the length.
Lower Line (b): This is the minimum value of the current price or the previous lower value, similarly adjusted by the difference between the upper and lower lines.
The average line (avg) is simply the midpoint between the upper and lower lines. The G-Channel signals trend direction:
Bullish Condition: The system looks for the condition when the price crosses over the lower line (b), indicating a potential upward trend.
Bearish Condition: When the price crosses under the upper line (a), it signals a potential downward trend.
Exponential Moving Average (EMA)
The strategy also incorporates an EMA with a default length of 200. The EMA serves as a trend filter to determine whether the market is trending upward or downward:
Price below EMA: Indicates a bearish trend.
Price above EMA: Indicates a bullish trend.
Buy/Sell Conditions
The strategy generates buy or sell signals based on the interaction between the G-Channel signals and the price relative to the EMA:
Buy Signal: The strategy triggers a buy when:
A bullish condition (recent crossover of price over the lower G-Channel line) is detected.
The price is below the EMA, indicating that despite the recent bullish signal, the market might still be undervalued or in a temporary downturn.
Sell Signal: The strategy triggers a sell when:
A bearish condition (recent crossunder of price below the upper G-Channel line) is detected.
The price is above the EMA, suggesting that the market might be overextended and poised for a downturn.
Visualization
The strategy plots:
The upper, lower, and average lines of the G-Channel, with the average line colored based on bullish (green) or bearish (red) conditions.
The EMA (orange) line to provide context on the general trend direction.
Markers for Buy and Sell signals to visually indicate the strategy's entry points.
Strategy Execution
When a buy or sell signal is detected:
Buy Entry: If the bullish condition and price < EMA condition are met, a long (buy) position is opened.
Sell Entry: If the bearish condition and price > EMA condition are met, a short (sell) position is opened.
Purpose
This strategy aims to catch price reversals at critical points (when the price moves through the G-Channel) while filtering trades using the EMA to avoid entering during unfavorable market trends.

DMR By ANTExplanation of the DMR by ANT Script
a. What is This Script and How Is It Useful?
This Pine Script, named "DMR by ANT, " is designed for use on TradingView, focusing on dynamically assessing market conditions. It calculates key levels, specifically the high and low of the previous two days, to establish trading zones that assist traders in making informed decisions.
The script highlights:
Previous Day's High and Low : It captures the high and low prices from the previous two days to help set up trading ranges.
First 15 Minutes Candles High and low is marked with Orange Lines .
Trade Zones : It identifies whether the current price is in a 'tradeable' zone or 'non-tradeable' zone. The zones are determined based on the relationship between the current price, today's open price, and the calculated high and low levels.
Targets and Stop Losses : The script dynamically provides target and stop-loss levels based on user-defined input points, which can help manage risk effectively.
This script is beneficial for traders looking to enter (or avoid) trades based on defined price action criteria and can effectively streamline the analysis process in fast-moving markets.
Customize Input Parameters:(settings)
Adjust the ATR, based on ATR target and stop-loss is calculated and displayed. The default values 7(rest see the help), Dynamics changes based on ATR values changes in real time.
b. How to Effectively Use This Script
The DMR script can be utilized across various trading instruments, including:
Indexes: Suitable for gauging market sentiment and overall trends; can assist in short-term trading strategies.
Options: Helps determine the likely movement of the underlying assets, providing insight into probable volatility and directional bias.
ETFs (Exchange-Traded Funds): Useful for trading diversified portfolios; traders can define entry and exit points relevant to the basket of stocks.
Stocks: Ideal for individual stock trading, as traders can analyze stock movements concerning broader market trends.
When utilizing this script, traders should:
Identify key trading levels before entering trades based on the calculated high and low ranges.
Use the dynamic targets and stop-loss levels to protect capital and maximize potential gains.
Continuously monitor the script's signals and adapt to ongoing market changes.
c. Best Time Frames for Different Instruments
The optimal time frames for using the DMR script can vary based on the trading instrument.
Here’s a summary in tabular format for clearer guidance:
Instrument Best Time Frames
Index 5-minute, 15-minute, 1-hour
Options 1-minute, 5-minute, 15-minute
ETF 5-minute, 15-minute, 1-hour
Stocks 5-minute, 15-minute, 1-hour, Daily
Indexes: Shorter time frames (5 to 15 minutes) can capture quick market movements, while 1-hour frames can provide a broader market overview.
Options Trading: Given the time sensitivity of options, using very short time frames (1-5 minutes) can be effective to seize rapid price movements before expiry.
ETFs: Similar to indices, shorter frames help in effectively tracking movements of the underlying assets.
Stocks: A mix of short (5-15 minutes) for day trading and daily charts for swing trading can provide balanced insights.
Conclusion
Utilizing the DMR by ANT script can greatly enhance a trader's ability to analyze market conditions, identify opportunities, and manage risk effectively. By adapting the script through the different listed recommendations, traders can maximize their trading strategy’s effectiveness across various instruments.
Do comment below for further improvement.

Overnight Positioning w EMA - Strategy [presentTrading]I've recently started researching Market Timing strategies, and it’s proving to be quite an interesting area of study. The idea of predicting optimal times to enter and exit the market, based on historical data and various indicators, brings a dynamic edge to trading. Additionally, it is integrated with the 3commas bot for automated trade execution.
I'm still working on it. Welcome to share your point of view.
█ Introduction and How it is Different
The "Overnight Positioning with EMA " is designed to capitalize on market inefficiencies during the overnight trading period. This strategy takes a position shortly before the market closes and exits shortly after it opens the following day. What sets this strategy apart is the integration of an optional Exponential Moving Average (EMA) filter, which ensures that trades are aligned with the underlying trend. The strategy provides flexibility by allowing users to select between different global market sessions, such as the US, Asia, and Europe.
It is integrated with the 3commas bot for automated trade execution and has a built-in mechanism to avoid holding positions over the weekend by force-closing positions on Fridays before the market closes.
BTCUSD 20 mins Performance
█ Strategy, How it Works: Detailed Explanation
The core logic of this strategy is simple: enter trades before market close and exit them after market open, taking advantage of potential price movements during the overnight period. Here’s how it works in more detail:
🔶 Market Timing
The strategy determines the local market open and close times based on the selected market (US, Asia, Europe) and adjusts entry and exit points accordingly. The entry is triggered a specific number of minutes before market close, and the exit is triggered a specific number of minutes after market open.
🔶 EMA Filter
The strategy includes an optional EMA filter to help ensure that trades are taken in the direction of the prevailing trend. The EMA is calculated over a user-defined timeframe and length. The entry is only allowed if the closing price is above the EMA (for long positions), which helps to filter out trades that might go against the trend.
The EMA formula:
```
EMA(t) = +
```
Where:
- EMA(t) is the current EMA value
- Close(t) is the current closing price
- n is the length of the EMA
- EMA(t-1) is the previous period's EMA value
🔶 Entry Logic
The strategy monitors the market time in the selected timezone. Once the current time reaches the defined entry period (e.g., 20 minutes before market close), and the EMA condition is satisfied, a long position is entered.
- Entry time calculation:
```
entryTime = marketCloseTime - entryMinutesBeforeClose * 60 * 1000
```
🔶 Exit Logic
Exits are triggered based on a specified time after the market opens. The strategy checks if the current time is within the defined exit period (e.g., 20 minutes after market open) and closes any open long positions.
- Exit time calculation:
exitTime = marketOpenTime + exitMinutesAfterOpen * 60 * 1000
🔶 Force Close on Fridays
To avoid the risk of holding positions over the weekend, the strategy force-closes any open positions 5 minutes before the market close on Fridays.
- Force close logic:
isFriday = (dayofweek(currentTime, marketTimezone) == dayofweek.friday)
█ Trade Direction
This strategy is designed exclusively for long trades. It enters a long position before market close and exits the position after market open. There is no shorting involved in this strategy, and it focuses on capturing upward momentum during the overnight session.
█ Usage
This strategy is suitable for traders who want to take advantage of price movements that occur during the overnight period without holding positions for extended periods. It automates entry and exit times, ensuring that trades are placed at the appropriate times based on the market session selected by the user. The 3commas bot integration also allows for automated execution, making it ideal for traders who wish to set it and forget it. The strategy is flexible enough to work across various global markets, depending on the trader's preference.
█ Default Settings
1. entryMinutesBeforeClose (Default = 20 minutes):
This setting determines how many minutes before the market close the strategy will enter a long position. A shorter duration could mean missing out on potential movements, while a longer duration could expose the position to greater price fluctuations before the market closes.
2. exitMinutesAfterOpen (Default = 20 minutes):
This setting controls how many minutes after the market opens the position will be exited. A shorter exit time minimizes exposure to market volatility at the open, while a longer exit time could capture more of the overnight price movement.
3. emaLength (Default = 100):
The length of the EMA affects how the strategy filters trades. A shorter EMA (e.g., 50) reacts more quickly to price changes, allowing more frequent entries, while a longer EMA (e.g., 200) smooths out price action and only allows entries when there is a stronger underlying trend.
The effect of using a longer EMA (e.g., 200) would be:
```
EMA(t) = +
```
4. emaTimeframe (Default = 240):
This is the timeframe used for calculating the EMA. A higher timeframe (e.g., 360) would base entries on longer-term trends, while a shorter timeframe (e.g., 60) would respond more quickly to price movements, potentially allowing more frequent trades.
5. useEMA (Default = true):
This toggle enables or disables the EMA filter. When enabled, trades are only taken when the price is above the EMA. Disabling the EMA allows the strategy to enter trades without any trend validation, which could increase the number of trades but also increase risk.
6. Market Selection (Default = US):
This setting determines which global market's open and close times the strategy will use. The selection of the market affects the timing of entries and exits and should be chosen based on the user's preference or geographic focus.

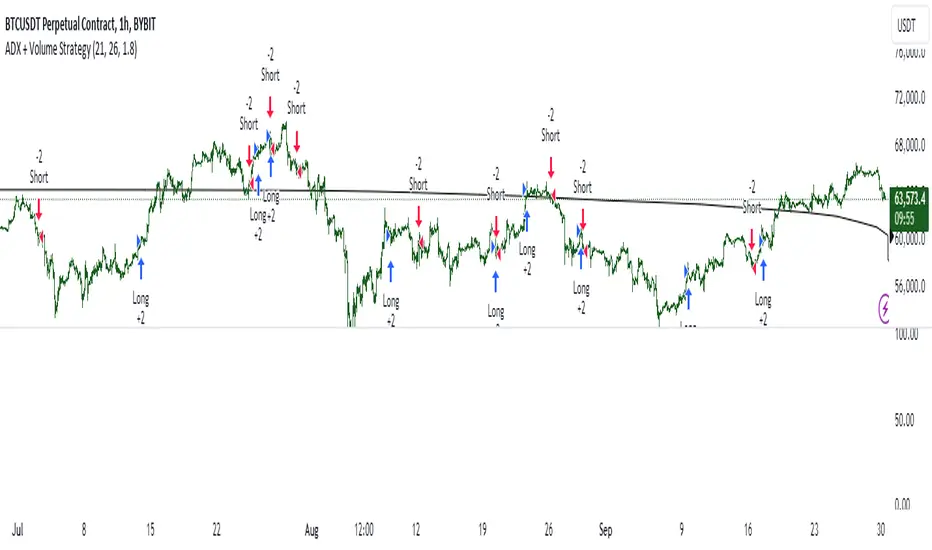
ADX + Volume Strategy### Strategy Description: ADX and Volume-Based Trading Strategy
This strategy is designed to identify strong market trends using the **Average Directional Index (ADX)** and confirm trading signals with **Volume**. The idea behind the strategy is to enter trades only when the market shows a strong trend (as indicated by ADX) and when the price movement is supported by high trading volume. This combination helps filter out weaker signals and provides more reliable entries into positions.
### Key Indicators:
1. **ADX (Average Directional Index)**:
- **Purpose**: ADX is a technical indicator that measures the strength of a trend, regardless of its direction (up or down).
- **Usage**: The strategy uses ADX to determine whether the market is trending strongly. If ADX is above a certain threshold (default is 25), it indicates that a strong trend is present.
- **Directional Indicators**:
- **DI+ (Directional Indicator Plus)**: Indicates the strength of the upward price movement.
- **DI- (Directional Indicator Minus)**: Indicates the strength of the downward price movement.
- ADX does not indicate the direction of the trend but confirms that a trend exists. DI+ and DI- are used to determine the direction.
2. **Volume**:
- **Purpose**: Volume is a key indicator for confirming the strength of a price movement. High volume suggests that a large number of market participants are supporting the movement, making it more likely to continue.
- **Usage**: The strategy compares the current volume to the 20-period moving average of the volume. The trade signal is confirmed if the current volume is greater than the average volume by a specified **Volume Multiplier** (default multiplier is 1.5). This ensures that the trade is supported by strong market participation.
### Strategy Logic:
#### **Entry Conditions:**
1. **Long Position** (Buy):
- **ADX** is above the threshold (default is 25), indicating a strong trend.
- **DI+ > DI-**, signaling that the market is trending upward.
- The **current volume** is greater than the 20-period average volume multiplied by the **Volume Multiplier** (e.g., 1.5), indicating that the upward price movement is backed by sufficient market activity.
2. **Short Position** (Sell):
- **ADX** is above the threshold (default is 25), indicating a strong trend.
- **DI- > DI+**, signaling that the market is trending downward.
- The **current volume** is greater than the 20-period average volume multiplied by the **Volume Multiplier** (e.g., 1.5), indicating that the downward price movement is backed by strong selling activity.
#### **Exit Conditions**:
- Positions are closed when the opposite signal appears:
- **For long positions**: Close when the short conditions are met (ADX still above the threshold, DI- > DI+, and the volume condition holds).
- **For short positions**: Close when the long conditions are met (ADX still above the threshold, DI+ > DI-, and the volume condition holds).
### Parameters:
- **ADX Period**: The period used to calculate ADX (default is 14). This controls how sensitive the ADX is to price movements.
- **ADX Threshold**: The minimum ADX value required for the strategy to consider the market trend as strong (default is 25). Higher values focus on stronger trends.
- **Volume Multiplier**: This parameter adjusts how much higher the current volume needs to be compared to the 20-period moving average for the signal to be valid. A value of 1.5 means the current volume must be 50% higher than the average volume.
### Example Trade Flow:
1. **Long Trade Example**:
- ADX > 25, confirming a strong trend.
- DI+ > DI-, confirming that the trend direction is upward.
- The current volume is 50% higher than the 20-period average volume (multiplied by 1.5).
- **Action**: Enter a long position.
2. **Short Trade Example**:
- ADX > 25, confirming a strong trend.
- DI- > DI+, confirming that the trend direction is downward.
- The current volume is 50% higher than the 20-period average volume.
- **Action**: Enter a short position.
### Strengths of the Strategy:
- **Trend Filtering**: The strategy ensures that trades are only taken when the market is trending strongly (confirmed by ADX) and that the price movement is supported by high volume, reducing the likelihood of false signals.
- **Volume Confirmation**: Using volume as confirmation provides an additional layer of reliability, as volume spikes often accompany sustained price moves.
- **Dual Signal Confirmation**: Both trend strength (ADX) and volume conditions must be met for a trade, making the strategy more robust.
### Weaknesses of the Strategy:
- **Limited Effectiveness in Range-Bound Markets**: Since the strategy relies on strong trends, it may underperform in sideways or non-trending markets where ADX stays below the threshold.
- **Lagging Nature of ADX**: ADX is a lagging indicator, which means that it may confirm the trend after it has already begun, potentially leading to late entries.
- **Volume Requirement**: In low-volume markets, the volume multiplier condition may not be met often, leading to fewer trade opportunities.
### Customization:
- **Adjust the ADX Threshold**: You can raise the threshold if you want to focus only on very strong trends, or lower it to capture moderate trends.
- **Adjust the Volume Multiplier**: You can change the multiplier to be more or less strict. A higher multiplier (e.g., 2.0) will require a stronger volume spike to confirm the signal, while a lower multiplier (e.g., 1.2) will allow more trades with weaker volume confirmation.
### Summary:
This ADX and Volume strategy is ideal for traders who want to follow strong trends while ensuring that the trend is supported by high trading volume. By combining a trend strength filter (ADX) and volume confirmation, the strategy aims to increase the probability of entering profitable trades while reducing the number of false signals. However, it may underperform in range-bound markets or in markets with low volume.
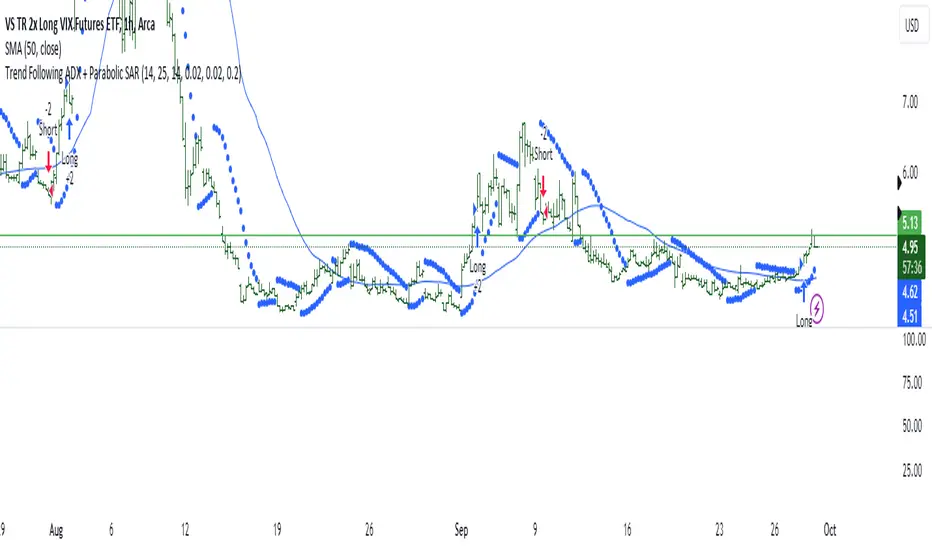
Trend Following ADX + Parabolic SAR### Strategy Description: Trend Following using **ADX** and **Parabolic SAR**
This strategy is designed to follow market trends using two popular indicators: **Average Directional Index (ADX)** and **Parabolic SAR**. The strategy attempts to enter trades when the market shows a strong trend (using ADX) and confirms the trend direction using the Parabolic SAR. Here's a breakdown:
### Key Indicators:
1. **ADX (Average Directional Index)**:
- **Purpose**: ADX measures the strength of a trend, regardless of direction.
- **Usage**: The strategy uses ADX to confirm that the market is trending. When ADX is above a certain threshold (e.g., 25), it indicates a strong trend.
- **Directional Indicators**:
- **DI+ (Directional Indicator Plus)**: Indicates upward movement strength.
- **DI- (Directional Indicator Minus)**: Indicates downward movement strength.
2. **Parabolic SAR**:
- **Purpose**: Parabolic SAR is a trend-following indicator used to identify potential reversals in the price direction.
- **Usage**: It provides specific price points above or below which the strategy confirms buy or sell signals.
### Strategy Logic:
#### **Entry Conditions**:
1. **Long Position** (Buy):
- **ADX** is above the threshold (default: 25), indicating a strong trend.
- **DI+ > DI-**, indicating the upward trend is stronger than the downward.
- The price is above the **Parabolic SAR** level, confirming the upward trend.
2. **Short Position** (Sell):
- **ADX** is above the threshold (default: 25), indicating a strong trend.
- **DI- > DI+**, indicating the downward trend is stronger than the upward.
- The price is below the **Parabolic SAR** level, confirming the downward trend.
#### **Exit Conditions**:
- Positions are closed when an opposite signal is detected.
- For example, if a long position is open and the conditions for a short position are met, the long position is closed, and a short position is opened.
### Parameters:
1. **ADX Period**: Defines the length of the period for the ADX calculation (default: 14).
2. **ADX Threshold**: The minimum value of ADX to confirm a strong trend (default: 25).
3. **Parabolic SAR Start**: The initial step for the SAR (default: 0.02).
4. **Parabolic SAR Increment**: The step increment for SAR (default: 0.02).
5. **Parabolic SAR Max**: The maximum step for SAR (default: 0.2).
### Example Trade Flow:
#### **Long Trade**:
1. ADX > 25, confirming a strong trend.
2. DI+ > DI-, indicating the market is trending upward.
3. The price is above the Parabolic SAR, confirming the upward direction.
4. **Action**: Enter a long (buy) position.
5. Exit the long position when a short signal is triggered (i.e., DI- > DI+, price below Parabolic SAR).
#### **Short Trade**:
1. ADX > 25, confirming a strong trend.
2. DI- > DI+, indicating the market is trending downward.
3. The price is below the Parabolic SAR, confirming the downward direction.
4. **Action**: Enter a short (sell) position.
5. Exit the short position when a long signal is triggered (i.e., DI+ > DI-, price above Parabolic SAR).
### Strengths of the Strategy:
- **Trend-Following**: It performs well in markets with strong trends, whether upward or downward.
- **Dual Confirmation**: The combination of ADX and Parabolic SAR reduces false signals by ensuring both trend strength and direction are considered before entering a trade.
### Weaknesses:
- **Range-Bound Markets**: This strategy may perform poorly in choppy, non-trending markets because both ADX and SAR are trend-following indicators.
- **Lagging Nature**: Since both ADX and SAR are lagging indicators, the strategy may enter trades after the trend has already started, potentially missing early profits.
### Customization:
- **ADX Threshold**: You can increase the threshold if you only want to trade in very strong trends, or lower it to capture more moderate trends.
- **SAR Parameters**: Adjusting the SAR `start`, `increment`, and `max` values will make the Parabolic SAR more or less sensitive to price changes.
### Summary:
This strategy combines the ADX and Parabolic SAR to take advantage of strong market trends. By confirming both trend strength (ADX) and trend direction (Parabolic SAR), it aims to enter high-probability trades in trending markets while minimizing false signals. However, it may struggle in sideways or non-trending markets.
For Educational purposes only !!!
Indicator Test with Conditions TableOverview: The "Indicator Test with Conditions Table" is a customizable trading strategy developed using Pine Script™ for the TradingView platform. It allows users to define complex entry conditions for both long and short positions based on various technical indicators and price levels.
Key Features:
Customizable Input Conditions:
Users can configure up to three input conditions for both long and short entries, each with its own logical operator (AND/OR) for combining conditions.
Input conditions can be based on:
Price Sources: Users can select any price data (e.g., close, open, high, low) for each condition.
Comparison Operators: Users can choose from a variety of operators, including:
Greater than (>)
Greater than or equal to (>=)
Less than (<)
Less than or equal to (<=)
Equal to (=)
Not equal to (!=)
Crossover (crossover)
Crossunder (crossunder)
Logical Operators:
The strategy provides options for combining conditions using logical operators (AND/OR) for greater flexibility in defining entry criteria.
Dynamic Condition Evaluation:
The strategy evaluates the defined conditions dynamically, checking whether they are enabled before proceeding with the comparison.
Users can toggle conditions on and off using boolean inputs, allowing for quick adjustments without modifying the code.
Visual Feedback:
A table is displayed on the chart, providing real-time status updates on the conditions and whether they are enabled. This enhances user experience by allowing easy monitoring of the strategy's logic.
Order Execution:
The strategy enters long or short positions based on the combined conditions' evaluations, automatically executing trades when the criteria are met.
How to Use:
Set Up Input Conditions:
Navigate to the strategy’s input settings to configure your desired price sources, operators, and logical combinations for long and short conditions.
Monitor Conditions:
Observe the condition table displayed at the bottom right of the chart to see which conditions are enabled and their current evaluations.
Adjust Strategy Parameters:
Modify the conditions, logical operators, and input sources as needed to optimize the strategy for different market scenarios or trading styles.
Execution:
Once the conditions are met, the strategy will automatically enter trades based on the defined logic.
Conclusion: The "Indicator Test with Conditions Table" strategy is a robust tool for traders looking to implement customized trading logic based on various market conditions. Its flexibility and real-time monitoring capabilities make it suitable for both novice and experienced traders.

ETH Signal 15m
This strategy uses the Supertrend indicator combined with RSI to generate buy and sell signals, with stop loss (SL) and take profit (TP) conditions based on ATR (Average True Range). Below is a detailed explanation of each part:
1. General Information BINANCE:ETHUSDT.P
Strategy Name: "ETH Signal 15m"
Designed for use on the 15-minute time frame for the ETH pair.
Default capital allocation is 15% of total equity for each trade.
2. Backtest Period
start_time and end_time: Define the start and end time of the backtest period.
start_time = 2024-08-01: Start date of the backtest.
end_time = 2054-01-01: End date of the backtest.
The strategy will only run when the current time falls within this specified range.
3. Supertrend Indicator
Supertrend is a trend-following indicator that provides buy or sell signals based on the direction of price changes.
factor = 2.76: The multiplier used in the Supertrend calculation (increasing this value makes the Supertrend less sensitive to price movements).
atrPeriod = 12: Number of periods used to calculate ATR.
Output:
direction: Determines the buy/sell direction based on Supertrend.
If direction decreases, it signals a buy (Long).
If direction increases, it signals a sell (Short).
4. RSI Indicator
RSI (Relative Strength Index) is a momentum indicator, often used to identify overbought or oversold conditions.
rsiLength = 12: Number of periods used to calculate RSI.
rsiOverbought = 70: RSI level considered overbought.
rsiOversold = 30: RSI level considered oversold.
5. Entry Conditions
Long Entry:
Supertrend gives a buy signal (ta.change(direction) < 0).
RSI must be below the overbought level (rsi < rsiOverbought).
Short Entry:
Supertrend gives a sell signal (ta.change(direction) > 0).
RSI must be above the oversold level (rsi > rsiOversold).
The strategy will only execute trades if the current time is within the backtest period (in_date_range).
6. Stop Loss (SL) and Take Profit (TP) Conditions
ATR (Average True Range) is used to calculate the distance for Stop Loss and Take Profit based on price volatility.
atr = ta.atr(atrPeriod): ATR is calculated using 12 periods.
Stop Loss and Take Profit are calculated as follows:
Long Trade:
Stop Loss: Set at close - 4 * atr (current price minus 4 times the ATR).
Take Profit: Set at close + 2 * atr (current price plus 2 times the ATR).
Short Trade:
Stop Loss: Set at close + 4 * atr (current price plus 4 times the ATR).
Take Profit: Set at close - 2.237 * atr (current price minus 2.237 times the ATR).
Summary:
This strategy enters a Long trade when the Supertrend indicates an upward trend and RSI is not in the overbought region. Conversely, a Short trade is entered when Supertrend signals a downtrend, and RSI is not oversold.
The trade is exited when the price reaches the Stop Loss or Take Profit levels, which are determined based on price volatility (ATR).
Disclaimer:
The content provided in this strategy is for informational and educational purposes only. It is not intended as financial, investment, or trading advice. Trading in cryptocurrency, stocks, or any financial markets involves significant risk, and you may lose more than your initial investment. Past performance is not indicative of future results, and no guarantee of profit can be made. You should consult with a professional financial advisor before making any investment decisions. The creator of this strategy is not responsible for any financial losses or damages incurred as a result of following this strategy. All trades are executed at your own risk.

ICT Indicator with Paper TradingThe strategy implemented in the provided Pine Script is based on **ICT (Inner Circle Trader)** concepts, particularly focusing on **order blocks** to identify key levels for potential reversals or continuations in the market. Below is a detailed description of the strategy:
### 1. **Order Block Concept**
- **Order blocks** are price levels where large institutional orders accumulate, often leading to a reversal or continuation of price movement.
- In this strategy, **order blocks** are identified when:
- The high of the current bar crosses above the high of the previous bar (for bullish order blocks).
- The low of the current bar crosses below the low of the previous bar (for bearish order blocks).
### 2. **Buy and Sell Signal Generation**
The core of the strategy revolves around identifying the **breakout** of order blocks, which is interpreted as a signal to either enter or exit trades:
- **Buy Signal**:
- Generated when the closing price crosses **above** the last identified bullish order block (i.e., the highest point during the last upward crossover of highs).
- This signals a potential upward trend, and the strategy enters a long position.
- **Sell Signal**:
- Generated when the closing price crosses **below** the last identified bearish order block (i.e., the lowest point during the last downward crossover of lows).
- This signals a potential downward trend, and the strategy exits any open long positions.
### 3. **Strategy Execution**
The strategy is executed using the `strategy.entry()` and `strategy.close()` functions:
- **Enter Long Positions**: When a buy signal is generated, the strategy opens a long position (buying).
- **Exit Positions**: When a sell signal is generated, the strategy closes the long position.
### 4. **Visual Indicators on the Chart**
To make the strategy easier to follow visually, buy and sell signals are marked directly on the chart:
- **Buy signals** are indicated with a green upward-facing triangle above the bar where the signal occurred.
- **Sell signals** are indicated with a red downward-facing triangle below the bar where the signal occurred.
### 5. **Key Elements of the Strategy**
- **Trend Continuation and Reversals**: This strategy is attempting to capture trends based on the breakout of important price levels (order blocks). When the price breaks above or below a significant order block, it is expected that the market will continue in that direction.
- **Order Block Strength**: Order blocks are considered strong areas where price action could reverse or accelerate, based on how institutional investors place large orders.
### 6. **Paper Trading**
This script uses **paper trading** to simulate trades without actual money being involved. This allows users to backtest the strategy, seeing how it would have performed in historical market conditions.
### 7. **Basic Strategy Flow**
1. **Order Block Identification**: The script constantly monitors price movements to detect bullish and bearish order blocks.
2. **Buy Signal**: If the closing price crosses above the last order block high, the strategy interprets it as a sign of bullish momentum and enters a long position.
3. **Sell Signal**: If the closing price crosses below the last order block low, it signals a bearish momentum, and the strategy closes the long position.
4. **Visual Representation**: Buy and sell signals are displayed on the chart for easy identification.
### **Advantages of the Strategy:**
- **Simple and Clear Rules**: The strategy is based on clearly defined rules for identifying order blocks and trade signals.
- **Effective for Trend Following**: By focusing on breakouts of order blocks, this strategy attempts to capture strong trends in the market.
- **Visual Aids**: The plot of buy/sell signals helps traders to quickly see where trades would have been placed.
### **Limitations:**
- **No Shorting**: This strategy only enters long positions (buying). It does not account for shorting opportunities.
- **No Risk Management**: There are no built-in stop losses, trailing stops, or profit targets, which could expose the strategy to large losses during adverse market conditions.
- **Whipsaws in Range Markets**: The strategy could produce false signals in sideways or choppy markets, where breakouts are short-lived and prices quickly reverse.
### **Overall Strategy Objective:**
The goal of the strategy is to enter into long positions when the price breaks above a significant order block, and exit when it breaks below. The strategy is designed for trend-following, with the assumption that price will continue in the direction of the breakout.
Let me know if you'd like to enhance or modify this strategy further!

Liquidity strategy tester [Influxum]This tool is based on the concept of liquidity. It includes 10 methods for identifying liquidity in the market. Although this tool is presented as a strategy, we see it more as a data-gathering instrument.
Warning: This indicator/strategy is not intended to generate profitable strategies. It is designed to identify potential market advantages and help with identifying effective entry points to capitalize on those advantages.
Once again, we have advanced the methods of effectively searching for liquidity in the market. With strategies, defined by various entry methods and risk management, you can find your edge in the market. This tool is backed by thorough testing and development, and we plan to continue improving it.
In its current form, it can also be used to test well-known ICT or Smart Money concepts. Using various methods, you can define market structure and identify areas where liquidity is located.
Fair Value Gaps - one of the entry signal options is fair value gaps, where an imbalance between buyers and sellers in the market can be expected.
Time and Price Theory - you can test this by setting liquidity from a specific session and testing entries as that liquidity is grabbed
Judas Swing - can be tested as a market reversal after a breakout during the first hours of trading.
Power of Three - accumulation can be observed as the market moving within a certain range, identified as cluster liquidity in our tool, manipulation occurs with the break of liquidity, and distribution is the direction of the entry.
🟪 Methods of Identifying Liquidity
Pivot Liquidity
This refers to liquidity formed by local extremes – the highest or lowest prices reached in the market over a certain period. The period is defined by a pivot number and determines how many candles before and after the high/low were higher/lower. Simply put, the pivot number represents the number of adjacent candles to the left and right, with a lower high for a pivot high and a higher low for a pivot low. The higher the number, the more significant the high/low is. Behind these local market extremes, we expect to find orders waiting for breakout as well as stop-losses.
Gann Swing
Similar to pivot liquidity, Gann swing identifies significant market points. However, instead of candle highs and lows, it focuses on the closing prices. A Gann swing is formed when a candle closes above (or below) several previous closes (the number is again defined by a strength parameter).
Percentage Change
Apart from ticks, percentages are also a key unit of market movement. In the search for liquidity, we monitor when a local high or low is formed. For liquidity defined by percentage change, a high must be a certain percentage higher than the last low to confirm a significant high. Similarly, a low must be a defined percentage away from the last significant high to confirm a new low. With the right percentage settings, you can eliminate market noise.
Session Range (3x)
Session range is a popular concept for finding liquidity, especially in smart money concepts (SMC). You can set up liquidity visualization for the Asian, London, or New York sessions – or even all three at once. This tool allows you to work with up to three sessions, so you can easily track how and if the market reacts to liquidity grabs during these sessions.
Tip for traders: If you want to see the reaction to liquidity grab during a specific session at a certain time (e.g., the well-known killzone), you can set the Trading session in this tool to the exact time where you want to look for potential entries.
Unfinished Auction
Based on order flow theory, an unfinished auction occurs when the market reverses sharply without filling all pending orders. In price action terms, this can be seen as two candles at a local high or low with very similar or identical highs/lows. The maximum difference between these values is defined as Tolerance, with the default setting being 3 ticks. This setting is particularly useful for filtering out noise during slower market periods, like the Asian session.
Double Tops and Bottoms
A very popular concept not only from smart money concepts but also among price pattern traders is the double bottom and double top. This occurs when the market stops and reverses at a certain price twice in a row. In the tool, you can set how many candles apart these bottoms/tops can be by adjusting the Length parameter. According to some theories, double bottoms are more effective when there is a significant peak between the two bottoms. You can set this in the tool as the Swing value, which defines how large the movement (expressed in ticks) must be between the two peaks/bottoms. The final parameter you can adjust is Tolerance, which defines the possible price difference between the two peaks/bottoms, also expressed in ticks.
Range or Cluster Liquidity
When the market stays within a certain price range, there’s a chance that breakout orders and stop-losses are accumulating outside of this range. Our tool defines ranges in two ways:
Candle balance calculates the average price within a candle (open, high, low, and close), and it defines consolidation when the centers of candles are within a certain distance from each other.
Overlap confirms consolidation when a candle overlaps with the previous one by a set percentage.
Daily, Weekly, and Monthly Highs or Lows
These options simply define liquidity as the previous day’s, week’s, or month’s highs or lows.
Visual Settings
You can easily adjust how liquidity is displayed on the chart, choosing line style, color, and thickness. To display only uncollected liquidity, select "Delete grabbed liquidity."
Liquidity Duration
This setting allows you to control how long liquidity areas remain valid. You can cancel liquidity at the end of the day, the second day, or after a specific number of candles.
🟪 Strategy
Now we come to the part of working with strategies.
Max # of bars after liquidity grab – This parameter allows you to define how many candles you can search for entry signals from the moment liquidity is grabbed. If you are using engulfing as an entry signal, which consists of 2 candles, keep in mind that this number must be at least 2. In general, if you want to test a quick and sharp reaction, set this number as low as possible. If you want to wait for a structural change after the liquidity grab, which may require more candles, set the number a bit higher.
🟪 Strategy - entries
In this section, we define the signals or situations where we can enter the market after liquidity has been taken out.
Liquidity grab - This setup triggers a trade immediately after liquidity is grabbed, meaning the trade opens as the next candle forms.
Close below, close above - This refers to situations where the price closes below liquidity, but then reverses and closes above liquidity again, suggesting the liquidity grab was a false breakout.
Over bar - This occurs when the entire candle (high and low) passes beyond the liquidity level but then experiences a pullback.
Engulfing - A popular price action pattern that is included in this tool.
2HL - weak, medium, strong - A variation of a popular candlestick pattern.
Strong bar - A strong reactionary candle that forms after a liquidity grab. If liquidity is grabbed at a low, this would be a strong long candle that closes near its high and is significantly larger compared to typical volatility.
Naked bar - A candlestick pattern we’ve tested that serves as a good confirmation of market movement.
FVG (Fair Value Gap) - A currently popular concept. This is the only signal with additional settings. “Pending FVG order valid” means if a fair value gap forms after a liquidity grab, a limit order is placed, which remains valid for a set number of candles. “FVG minimal tick size” allows you to filter based on the gap size, measured in ticks. “GAP entry model” lets you decide whether to place the limit order at the gap close or its edge.
🟪 Strategy - General
Long, short - You can choose whether to focus on long or short trades. It’s interesting to see how long and short trades yield different results across various markets.
Pyramiding - By default, the tool opens only one trade at a time. If a new signal arises while a trade is open, it won’t enter another position unless the pyramiding box is checked. You also need to set the maximum number of open trades in the Properties.
Position size - Simply set the size of the traded position.
🟪 Strategy - Time
In this section, you can set time parameters for the strategy being tested.
Test since year - As the name implies, you can limit the testing to start from a specific year.
Trading session - Define the trading session during which you want to test entries. You can also visualize the background (BG) for confirmation.
Exclude session - You can set a session period during which you prefer not to search for trades. For example, when the New York session opens, volatility can sharply increase, potentially reducing the long-term success rate of the tested setup.
🟪 Strategy - Exits
This section lets you define risk management rules.
PT & SL - Set the profit target (PT) and stop loss (SL) here.
Lowest/highest since grab - This option sets the stop loss at the lowest point after a liquidity grab at a low or at the highest point after a liquidity grab at a high. Since markets usually overshoot during liquidity grabs, it’s good practice to place the stop loss at the furthest point after the grab. You can also set your risk-reward ratio (RRR) here. A value of 1 sets an RRR of 1:1, 2 means 2:1, and so on.
Lowest/highest last # bars - Similar to the previous option, but instead of finding the extreme after a liquidity grab, it identifies the furthest point within the last number of candles. You can set how far back to look using the # bars field (for an engulfing pattern, 2 is optimal since it’s made of two candles, and the stop loss can be placed at the edge of the engulfing pattern). The RRR setting works the same way as in the previous option.
Other side liquidity grab - If this option is checked, the trade will exit when liquidity is grabbed on the opposite side (i.e., if you entered on a liquidity grab at a low, the trade will exit when liquidity is grabbed at a high).
Exit after # bars - A popular exit strategy where you close the position after a set number of candles.
Exit after # bars in profit - This option exits the trade once the position is profitable for a certain number of consecutive candles. For example, if set to 5, the position will close when 5 consecutive candles are profitable. You can also set a maximum number of candles (in the max field), ensuring the trade is closed after a certain time even if the profit condition hasn’t been met.
🟪 Alerts
Alerts are a key tool for traders to ensure they don’t miss trading opportunities. They also allow traders to manage their time effectively. Who would want to sit in front of the computer all day waiting for a trading opportunity when they could be attending to other matters? In our tool, you currently have two options for receiving alerts:
Liquidity grabs alert – if you enable this feature and set an alert, the alert will be triggered every time a candle on the current timeframe closes and intersects with the displayed liquidity line.
Entry signals alert – this feature triggers an alert when a signal for entry is generated based on the option you’ve selected in the Entry type. It’s an ideal way to be notified only when a trading opportunity appears according to your predefined rules.

Signal Tester (v1.2)This is an automation test Strategy, which helps you to get Strategy Alerts quickly on the 1m chart.
This is useful when you want to start automating Strategies but first you want to see if the connection between TradingView and your automation tool works properly.
This Strategy sends LONG Buy/Sell signals every 1 minute so you don't have to wait for a long time to see if your integration with an automation tool works.
How it works:
It works on the 1m chart
Every 1 minute it will send a BUY or a SELL signal (alternating between them forever)