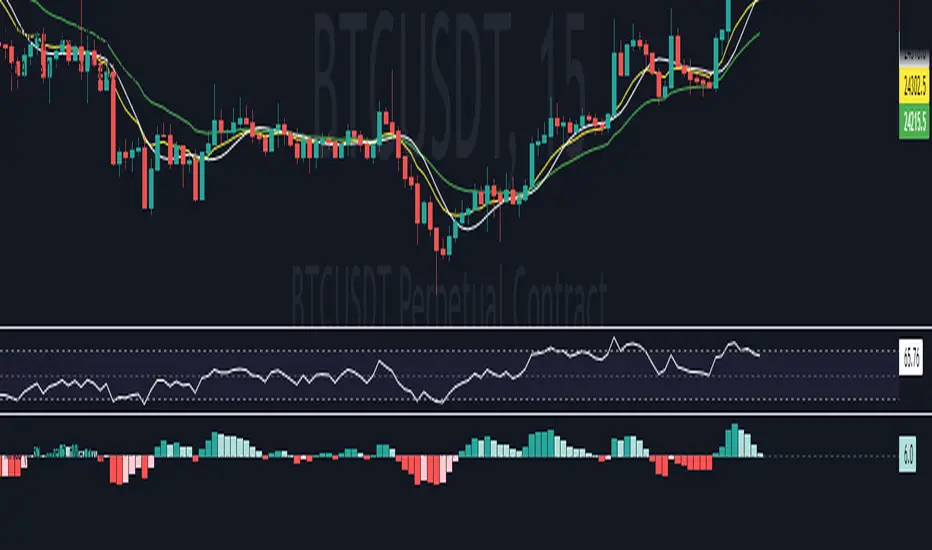
Renko ScalperWhat it is-
A lightweight Renko Scalper that combines Renko brick direction with an internal EMA trend filter and MACD confirmation to signal high-probability short-term entries. EMAs are used internally (hidden from the chart) so the visual remains uncluttered.
Signals-
Buy arrow: Renko direction turns bullish AND EMA trend up AND MACD histogram positive.
Sell arrow: Renko direction turns bearish AND EMA trend down AND MACD histogram negative.
Consecutive same-direction signals are suppressed (only one arrow per direction until opposite signal).
Visuals-
Buy / Sell arrows (large) above/below bars.
Chart background tints green/red after the respective signal for easy glance recognition.
Inputs:-
Renko Box Size (points)
EMA Fast / EMA Slow
MACD fast/slow/signal lengths
How to use-
Add to chart
Use smaller Renko box sizes for scalping, larger for swing-like entries.
Confirm signal with price action and volume—this indicator is a signal generator, not a full automated system.
Use alerts (built in) to receive Buy / Sell arrow notifications.
Alerts-
Buy Arrow — buySignal
Sell Arrow — sellSignal
Buy Background / Sell Background — background-color state alerts
Recommended settings-
Timeframes: 1m–15m for scalping, 5m for balanced intraday.
Symbols: liquid futures/currency pairs/major crypto.
Disclaimer
This script is educational and not financial advice. Backtest and forward test on a demo account before live use. Past performance is not indicative of future results. Use proper risk management.
Ema-macd

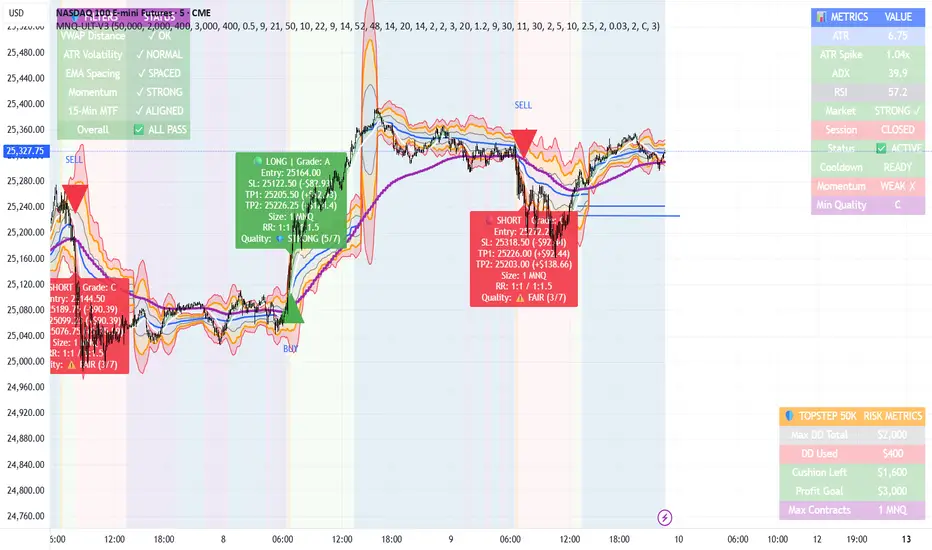
MNQ TopStep 50K | Ultra Quality v3.0MNQ TopStep 50K | Ultra Quality v3.0 - Publish Summary📊 OverviewA professional-grade trading indicator designed specifically for MNQ futures traders using TopStep funded accounts. Combines 7 technical confirmations with 5 advanced safety filters to deliver high-quality trade signals while managing drawdown risk.🎯 Key FeaturesCore Signal System
7-Point Confirmation: VWAP, EMA crossovers, 15-min HTF trend, MACD, RSI, ADX, and Volume
Signal Grading: Each signal is rated A+ through D based on 7 quality factors
Quality Threshold: Adjustable minimum grade requirement (A+, A, B, C, D)
Advanced Safety Filters (Customizable)
Mean Reversion Filter - Prevents chasing extended moves beyond VWAP bands
ATR Spike Filter - Avoids trading during extreme volatility events
EMA Spacing Filter - Ensures proper trend separation (optional)
Momentum Filter - Requires consecutive directional bars (optional)
Multi-Timeframe Confirmation - Aligns with 15-min trend (optional)
TopStep Risk Management
Real-time drawdown tracking
Position sizing calculator based on remaining cushion
Daily loss limit monitoring
Consecutive loss protection
Max trades per day limiter
Visual Components
VWAP with 1σ, 2σ, 3σ bands
EMA 9/21 with cloud fill
15-min EMA 50 for HTF trend
Comprehensive metrics dashboard
Risk management panel
Filter status panel
Detailed trade labels with entry, stops, and targets
⚙️ Default Settings (Balanced for Regular Signals)Technical Indicators
Fast EMA: 9 | Slow EMA: 21 | HTF EMA: 50 (15-min)
MACD: 10/22/9
RSI: 14 period | Thresholds: 52 (buy) / 48 (sell)
ADX: 14 period | Minimum: 20
ATR: 14 period | Stop: 2x | TP1: 2x | TP2: 3x
Volume: 1.2x average required
Session Settings
Default: 9:30 AM - 11:30 AM ET (adjustable)
Avoids first 15 minutes after market open
Customizable trading hours
Safety Filters (Default Configuration)
✅ Mean Reversion: Enabled (2.5σ max from VWAP)
✅ ATR Spike: Enabled (2.0x threshold)
❌ EMA Spacing: Disabled (can enable for quality)
❌ Momentum: Disabled (can enable for quality)
❌ MTF Confirmation: Disabled (can enable for quality)
Risk Controls
Minimum Signal Quality: C (adjustable to A+ for fewer/better signals)
Min Bars Between Signals: 10
Max Trades Per Day: 5
Stop After Consecutive Losses: 2
📈 Expected PerformanceWith Default Settings:
Signals per week: 10-15 trades
Estimated win rate: 55-60%
Risk-Reward: 1:2 (TP1) and 1:3 (TP2)
With Aggressive Settings (Min Quality = D, All Filters Off):
Signals per week: 20-25 trades
Estimated win rate: 50-55%
With Conservative Settings (Min Quality = A, All Filters On):
Signals per week: 3-5 trades
Estimated win rate: 65-70%
🚀 How to UseBasic Setup:
Add indicator to MNQ 5-minute chart
Adjust TopStep account settings in inputs
Set your risk per trade percentage (default: 0.5%)
Configure trading session hours
Set minimum signal quality (Start with C for balanced results)
Signal Interpretation:
Green Triangle (BUY): Long signal - all confirmations aligned
Red Triangle (SELL): Short signal - all confirmations aligned
Label Details: Shows entry, stop loss, take profit levels, position size, and signal grade
Signal Grade: A+ = Elite (6-7 points) | A = Strong (5) | B = Good (4) | C = Fair (3)
Dashboard Monitoring:
Top Right: Technical metrics and market conditions
Top Left: Filter status (which filters are passing/blocking)
Bottom Right: TopStep risk metrics and position sizing
⚡ Customization TipsFor More Signals:
Lower "Minimum Signal Quality" to D
Decrease ADX threshold to 18-20
Lower RSI thresholds to 50/50
Reduce Volume multiplier to 1.1x
Disable additional filters
For Higher Quality (Fewer Signals):
Raise "Minimum Signal Quality" to A or A+
Increase ADX threshold to 25-30
Enable all 5 advanced filters
Tighten VWAP distance to 2.0σ
Increase momentum requirement to 3-4 bars
For TopStep Compliance:
Adjust "Max Total Drawdown" and "Daily Loss Limit" to match your account
Update "Already Used Drawdown" daily
Monitor the Risk Panel for cushion remaining
Use recommended contract sizing
🛡️ Risk DisclaimerIMPORTANT: This indicator is for educational and informational purposes only.
Past performance does not guarantee future results
All trading involves substantial risk of loss
Use proper risk management and position sizing
Test thoroughly in paper trading before live use
The indicator does not guarantee profitable trades
Adjust settings based on your risk tolerance and trading style
Always comply with your broker's and TopStep's rules
Buy/Sell Ei - Premium Edition (Fixed Momentum)**📈 Buy/Sell Ei Indicator - Smart Trading System with Price Pattern Detection 📉**
**🔍 What is it?**
The **Buy/Sell Ei** indicator is a professional tool designed to identify **buy and sell signals** based on a combination of **candlestick patterns** and **moving averages**. With high accuracy, it pinpoints optimal entry and exit points in **both bullish and bearish trends**, making it suitable for forex pairs, stocks, and cryptocurrencies.
---
### **🌟 Key Features:**
✅ **Advanced Candlestick Pattern Detection**
✅ **Momentum Filter (Customizable consecutive candle count)**
✅ **Live Trade Mode (Instant signals for active trading)**
✅ **Dual MA Support (Fast & Slow MA with multiple types: SMA, EMA, WMA, VWMA)**
✅ **Date Filter (Focus on specific trading periods)**
✅ **Win/Loss Tracking (Performance analytics with success rate)**
---
### **🚀 Why Choose Buy/Sell Ei?**
✔ **Precision:** Reduces false signals with strict pattern rules.
✔ **Flexibility:** Works in both live trading and backtesting modes.
✔ **User-Friendly:** Clear labels and alerts for easy decision-making.
✔ **Adaptive:** Compatible with all timeframes (M1 to Monthly).
---
### **🛠 How It Works:**
1. **Trend Confirmation:** Uses MAs to filter trades in the trend’s direction.
2. **Pattern Recognition:** Detects "Ready to Buy/Sell" and confirmed signals.
3. **Momentum Check:** Optional filter for consecutive bullish/bearish candles.
4. **Live Alerts:** Labels appear instantly in Live Trade Mode.
---
### **📊 Ideal For:**
- **Day Traders** (Scalping & Intraday)
- **Swing Traders** (Medium-term setups)
- **Technical Analysts** (Backtesting strategies)
**🔧 Designed by Sahar Chadri | Optimized for TradingView**
**🎯 Trade Smarter, Not Harder!**

Trend Strength MeterThe Trend Strength Meter (TSM) is a powerful and versatile indicator designed to help traders identify market trends, measure their strength, and detect potential reversals with ease. This indicator combines the power of moving averages, divergence detection, and a clean, customizable dashboard to provide actionable insights for traders of all levels.
How It Works
Trend Strength Calculation:
1. The TSM calculates the trend strength using the difference between two Exponential Moving Averages (EMAs): a fast EMA (default: 20) and a slow EMA (default: 50).
2. The difference is expressed as a percentage of the slow EMA, providing a clear measure of the trend's strength and direction.
Histogram Visualization:
1. A color-coded histogram visually represents the trend strength:
Green: Bullish trend
Red: Bearish trend
Gray: Neutral or no significant trend
2. A smoothed trend strength line (SMA of the trend strength) is also plotted for better clarity.
Divergence Detection:
1. The indicator detects bullish and bearish divergences using the RSI (Relative Strength Index) and price action.
2. Bullish Divergence: Price makes a lower low, but RSI makes a higher low, signaling potential upward momentum.
3. Bearish Divergence: Price makes a higher high, but RSI makes a lower high, signaling potential downward momentum.
=> Divergences are marked with arrows on the chart:
Green Arrow: Bullish divergence
Red Arrow: Bearish divergence
Dashboard:
1. A clean and informative dashboard displays key information:
Trend Strength Value: The current strength of the trend
Trend Direction: Bullish, Bearish, or Neutral
Last Signal: Buy, Sell, or None (based on divergence signals)
The dashboard is fully customizable and can be positioned anywhere on the chart (e.g., top-right, bottom-left, center, etc.).
Key Features
1. Trend Strength Measurement: Quickly identify the strength and direction of the trend.
2. Divergence Detection: Spot potential reversals before they occur with bullish and bearish divergence signals.
3. Customizable Dashboard: Move the dashboard to your preferred location on the chart for better visibility.
4. User-Friendly Design: Clean visuals and intuitive color coding make it easy to interpret market conditions.
5. Actionable Signals: Provides clear Buy/Sell signals based on divergence, helping traders make informed decisions.
How to Use
1. Trend Confirmation:
Use the histogram and trend strength value to confirm the current market trend.
Green bars indicate a bullish trend, while red bars indicate a bearish trend.
2. Divergence Signals:
Look for divergence arrows (green for bullish, red for bearish) to anticipate potential reversals.
Combine divergence signals with other technical analysis tools for higher accuracy.
3. Dashboard Insights:
Monitor the dashboard for real-time updates on trend strength, direction, and the latest signal.
Use the "Last Signal" (Buy/Sell) to validate your trading decisions.
4. Custom Settings:
Adjust the EMA lengths and divergence lookback period to suit your trading style and timeframe.
Position the dashboard anywhere on the chart for convenience.
Best Practices
1. Use the TSM in conjunction with other indicators or price action analysis for confirmation.
2. Test the indicator on different timeframes to find the one that works best for your strategy.
3. Always practice proper risk management when trading.
Disclaimer
This indicator is a tool to assist in technical analysis and should not be used as a standalone trading strategy. Past performance is not indicative of future results. Always conduct your own research and consult with a financial advisor before making trading decisions.

Parabolic SAR + EMA 200 + MACD SignalsParabolic SAR + EMA 200 + MACD Signals Indicator, a powerful tool designed to help traders identify optimal entry points in the market.
This indicator combines three popular technical indicators: Parabolic SAR (Stop and Reverse), EMA200 (Exponential Moving Average 200) and MACD (Moving Average Convergence Divergence) - to provide clear and concise buy and sell signals based on market trends.
The MACD component of this indicator calculates the difference between two exponentially smoothed moving averages, providing insight into the trend strength of the market. The Parabolic SAR component helps identify potential price reversals, while the EMA200 acts as a key level of support and resistance, providing additional confirmation of the overall trend direction.
Whether you're a seasoned trader or just starting out, the MACD-Parabolic SAR-EMA200 Indicator is a must-have tool for anyone looking to improve their trading strategy and maximize profits in today's dynamic markets.
Buy conditions
The price should be above the EMA 200
Parabolic SAR should show an upward trend
MACD Delta should be positive
ُSell conditions
The price should be below the EMA 200
Parabolic SAR should show an downward trend
MACD Delta should be negative

Bar Color Long / Short Indicator With Advised SLOverview
This script is a trading indicator named "Bar Color Long / Short Indicator With Advised SL" designed for the TradingView platform. The indicator's primary purpose is to provide entry signals for long and short positions, based on various technical analysis methods. Additionally, the indicator suggests stop-loss levels for both long and short positions.
User Inputs
The indicator has several user inputs, such as:
Length
Smoothing
Multiplier
Show bar colors (ON/OFF)
When the bar colors are turned off, the alert signals for long and short positions will be displayed instead.
Custom Risk Calculation
The script calculates a custom risk level based on a modified version of the RSI (Relative Strength Index) formula. The custom risk level is divided into three categories: low, medium, and high.
Sentiment Score Calculation
The indicator calculates a sentiment score based on a combination of methods resembling EMA (Exponential Moving Average), MACD (Moving Average Convergence Divergence), and ROC (Rate of Change). The sentiment score is used to determine if the sentiment is positive or negative.
Bollinger Bands Percent and Combined Signal
The Bollinger Bands Percent is calculated, and the custom risk, sentiment score, and Bollinger Bands Percent are combined to generate a new signal. This signal is used in conjunction with EMA10 to determine the bar colors and provide entry signals.
Bar Colors
Based on the combined signal and EMA10, the script determines the bar colors as follows:
Orange: Positive sentiment
Blue: Negative sentiment
Gray: Neutral
Entry Signals and Alerts
When the bar colors are turned off, the indicator displays large green arrow signals for long (buy) positions and red arrow signals for short (sell) positions based on the sentiment and EMA10 conditions. The script also includes alert conditions for long and short signals, which can be used to set up notifications when these signals are triggered in the TradingView platform.
Advised Stop-Loss Levels
The indicator plots stop-loss lines for both long and short positions at the last candle, accompanied by labels showing the advised stop-loss levels in numeric values.

TARVIS Labs - Alts Macro Bottom/Top SignalsSCRIPT DESCRIPTION
PLEASE READ THROUGH THIS CAREFULLY.
This is a script specifically written to help provide indicators from a macro view for ALTS. This script needs to be run on the 1 day. It helps indicate when to accumulate alts, and when its in a bull run when this a bull run top beginning to form with warnings, and a indicator that a top is in. This is described further below.
NOTE - in order to accomodate most alts the script had to be broad enough in its indicators to cover many different scenarios. If you are trading a smaller altcoin I suggest taking a more conservative approach to accumulation.
FAQs:
1. Why is there no accumulation zone showing up before an uptrend?
This could be because the trend has been so strong for this coin that there hasn't been a strong enough signal to accumulate or this could be that the chart doesnt have enough historical data (needs over 2 years) for the indicators to flash green.
2. Why is there no tops shown for a chart Im looking at?
This is either because there isn't enough historical data (needs over 2 years) for the indicators to build or because the altcoin didnt perform as well as the rest of the market. The altcoin has to perform as well as the market over the length of the bull run in order for the signals to show. Typically an altcoin that shows sharp increases and sharp drops shortly after will not have signals show up.
3. The "Potential End of Bull Run Top Indicator" showed up but we weren't near the top yet, why is that?
The alts indicator has to work across many altcoins, and their trends are not all the same. This can lead to the indicator showing but not necessarily being the exact top. The data from the alts macro bottom/top signals should be paired with the "TARVIS Labs bitcoin macro bottom/top signals" indicator for BTC. The reasoning is because if the top is not showing that its in for Bitcoin its likely that the altcoin's top is also not in. You should use the two in tandem to know if the bull run top is very likely in.
ACCUMULATION ZONE INDICATOR - LIGHT GREEN
Description
When we look at the general crypto landscape, the 200d & 300d EMAs are extremely useful. We can use their cross and momentum in order to determine a bottom forming. If the price has fallen over 40% below the 200 day EMA and the 200 day EMA has crossed below the 300d EMA, its a downtrend with a steep fall, which could indicate a good time to accumulate. When we see the 200 day EMA's slope drop drastically (over 5% w/w) it is also a good signal to accumulate.
Strategy for Usage
For alts, the strategy can vary drastically. You need to take into account:
1. the market cap of the altcoin, is it a smaller market cap altcoin or a larger one?
2. historical trend, does it typically trend strongly with a smaller accumulation zone?
Once you've taken these into account you can form a strategy. For example, if the altcoin has had smaller accumulation zones historically you'll want to take advantage of the accumulation zones when they pop up and be more aggressive (say a 30 day accumulation). If the altcoin has historically had longer accumulation zones then you'll want to be more conservative with your strategy and potentially have a 100 day (or even longer) accumulation period. If the altcoin is a smaller market cap alt, you will want to also take that into account. You'll want to likely be more conservative,
STRONG BUY IN ACCUMULATION ZONE INDICATOR - DARK GREEN
Description
We can add to the bottoming signal by looking for strong downtrends inside the bottoming signal. We do this by seeing when the 36 day EMA has a slope decreasing by 2% day/day.
Strategy for Usage
These strong downtrend days can be used to add more to our accumulation strategy. We can add more on these days (ex. double what you were planning to on a typical accumulation day).
LOCAL TOP NEAR BULL RUN TOP INDICATOR - RED
Description
When the 100 week EMA is in a strong uptrend (4% increase w/w) we can look for significant loss of momentum in order to determine if a local top is in near a bull run top. This strategy uses a MACD with 9/36/9 config for the daily chart. We look for the signals momentum loss, when the slope becomes negative.
Strategy for Usage
Ideally the right strategy to use here is to exit the market when this indicator starts. When the indicator ends if the "Potential End of Bull Run Top Indicator" is not showing on the chart you can buy back into the market.
POTENTIAL END OF BULL RUN TOP INDICATOR - DARK RED
Description
When the 100 week EMA is in a strong uptrend (3% increase w/w), and a MACD config of 108/234/9 has a negative signal slope signifying a very large momentum loss, but the 1d 18 EMA is still above the 1d 63 EMA we show this signal.
Strategy for Usage
This is a strong indicator that the top is in, and it potentially being the bull run top. Because alts can vary strongly in their charts, this should be a strong warning but not necessarily a certainty that the bull run is over.

EMA 21 + MacD + RSI + Alma
Setting
EMA 21 = Green
EMA 9 = yellow
MacD = 5 35 5
RSI = 10
Alma 20 0.8 8
RULES
Long:
1. EMA 9 below 21
2. RSI above 50 from Oversold
3. Macd Solid green
4. SL @ ALMA
5. Conditional buy limit order @ top wick
6. 1:3 RR
Short:
1. EMA 9 above 21
2. RSI below 50 from Overbought
3. Macd Solid red
4. SL @ ALMA
5. Conditional sell limit order @ bottom wick
6. 1:3 RR
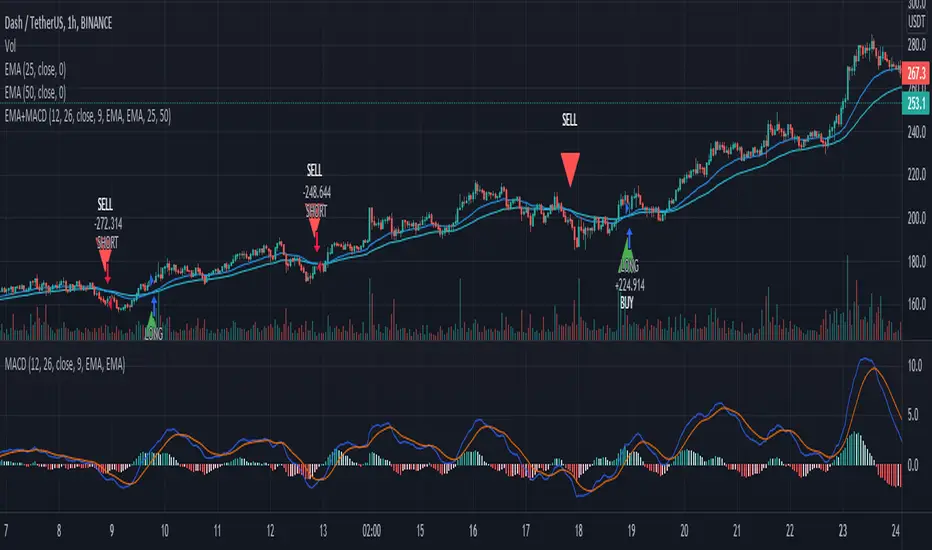
EMA+MACDA simple script using EMA 25 and EMA 50 with MACD. Enter long when EMA 25 crossover ema 50 and MACD line > 0, enter short when EMA 50 crossover ema 25 and MACD < 0
All in One StudyHere is my All in One Strategy converted into a Study with Alert Conditions you can use for whatever purpose you wish.
Each condition is set up similarly to the way I had the strategy set up, if you pick the indicators you want to base your alerts on it will alert you only if the check box is true.
You can pick one or more of the indicators if you'd like. I only suggest to pick one at a time so you don't have overlapping buy/sell alerts.
I think everyone will find the message of the market falling alert amusing :-)

kurdistan MACD & RSI & EMA Hello friends
This indicator can help you to combine the three indicators together
EMA (20), MACD (12, 26, 20), RSI (14)
Apply ema20 to rsi as the signal line
Long arrival time
Price above EMA20, MACD above signal line and RSI above signal line
Short arrival time
Price below EMA20, MACD below signal line and RSI below signal line

Multiple MACD RSI simple strategySimple strategy script I've had for a while but looks like I never published.
Although it is one of my most simple it seems to have the best profitability. It is pretty rough though. the Stoch RSI has only a little weight to the trade trigger. I'll refine it more over time or you can by all means. Basically the Stoch RSI current K line has to be OVER 40 to trigger a SELL. It has no effect on buy side.
The triggers are roughly as follows:
Year - since so many assets have gone 2x, 3x, 10x+ since 2013 having a strategy that earns a 500% return from 2013 to now isn't that good if buy-and-holding would have got you 800%. This eliminates some of that noise and makes it a little easier to quickly gauge success. So buy/sell trigger need a value of greater or equal to 2018 (default)
MACD 1 - First MACD (short) needs to indicate greater than 0 to buy or less than 0 to sell.
MACD 2 - Same as MACD1 but for second MACD set (long)
Uptrend - Latest close + high divided by last periods close + high needs to be grater than 1. So if latest is 34.30 close and 34.60 high and previous interval is 34.80 close and 34.82 high, that is 0.99 and will not trigger a buy trade.
Downtrend - Same thing but close + low and less than 1.
This script/strategy is pretty rough but if there is interest I'll polish it more since it is a pretty solid but simple strategy for most assets.

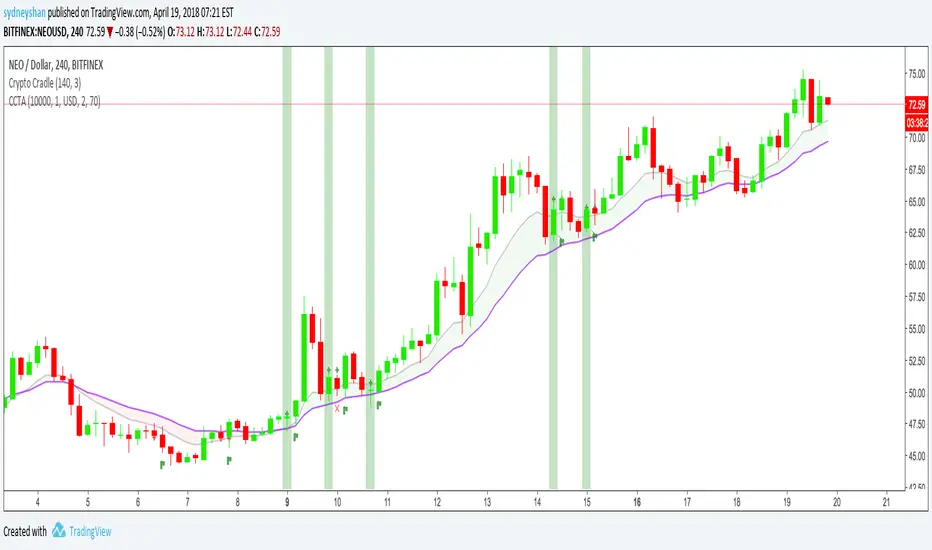
Crypto Cradle Trade AssistantThis indicator compliments the Crypto Cradle indicator by providing your entry, stop, 1:1 scale-out price, trade amount, and potential profit based on your target and scale-out strategy.
1. Ensure you have added the Crypto Cradle and Crypto Cradle Trade Assistant indicators to your chart
2. Click the cog icon to configure this indicator
3. Enter in your account balance and the % you are willing to risk on this trade (default: 1%).
3. Set your target price
4. Tweak the Trade Pair and Precision (Decimals) if required (USD/USDT only BTC & ETH coming soon)
5. Click on the 'Data Window' icon on the right-hand side of the screen and scroll down to CCTA
6. Hover over a highlighted crypto cradle candle (green for long, red for short) and a series of values will appear
Entry price
Stop price
1:1 scale out price
Amount to buy/sell (ie NEO)
Amount in traded currency (ie USD)
Target price (that you set)
Profit based on selling 50% of your bought amount when your reward equals your risk (1:1 scale-out)
Profit based on risking 1% of your portfolio
For more about the Crypto Cradle strategy, visit www.tradercobb.com
Elder Impulse System with AutoEnvelope combined by iduThe idea is to combine Elder Impulse System with AutoEnvelope. It's usefull for free accounts to have more indicators on chart.
So what would on chart:
- fast ema
- slow ema
- AutoEnvelope
- Bar colour changed after signals of upcending/discending fast ema + upcending/discending macd
I've used Elder Impulse System by samuel16 and Elder's AutoEnvelope indicator by jamiespips. Thanks to both of them.

EMARCOThis is the study of the ratio of the MACD exponential moving averages, 0.993 and 1.003 were used to define the overextended positions since this is the highest the oscillator usually goes, price tends to reverse when overextended. RE1 (ratio equation 1) = the fast Exponential Moving Average (12 points) divided by the slow Exponential Moving Average (26 points) and RE2 is reciprocal. Here we see that when the RE1 is greater than RE2 price tends to drop and so when the opposite is true

Indicator: Elder Impulse SystemAccording to Elder, "The Impulse System encourages you to enter a trade cautiously but exit fast, by identifying inflection points where a trend speeds up or slows down. This is the professional approach to trading, the total opposite of the amateur's style. Beginners jump into trades without thinking too much and take forever to get out, hoping and waiting for the market to turn their way."
The Impulse System is based on two indicators, a 13-day exponential moving average and the MACD-Histogram. The moving average identifies the trend, while the MACD-Histogram measures momentum. As a result, the Impulse System combines trend following and momentum to identify impulses that can be traded.
By default it uses your chart's time frame, but you can set it to any custom time frame via options page. Optionally, price bars can be color coded too.
More info:
stockcharts.com
Steps to import / use custom indicators from this chart:
PDF: drive.google.com
