Tariq Supertrend StrategyThis Strategy which points out the best time to enter in Long Trade or Short Trade
Enter

Bollinger Band Layer Entry (BBLE) The Bollinger Band Layer Entry Indicator uses plenty of Bollinger Bands to create an onion-looking layered indicator to help with layered entries. It is similar to a Ribbon but better. This indicator is best used with any volume-related indicator so you can recede from entering into any position with too much momentum to rebound off of any line. Note that this indicator is best used with another strategy like pair trading. It is not recommended to trade based on this indicator only. Please stay aware of any news about the stock you are trading because some events may have a big impact and force the market to go bullish/bearish by a lot. This indicator can be used with all chart types and works well with many other indicators. It allows for complete customization and offers easy-to-understand settings which can be designated to a certain individual. You can modify every single factor of the BBs which allows for an even more personalized and adapted Indicator that reflects your trading/ investing needs. You also have the option to choose which type of MAs will be used to create the Bollinger Bands , a few of which include: EMA, SMA, WMA, HMA, RMA, DMA, LSMA, VAMA, TMA, MF.
Bollinger Bands are a way to measure and visualize volatility. As volatility increases, the wider the bands become, and the more they deviate from the basis. Vice versa, when volatility decreases, the gap between the bands and basis decreases. Yet a big advantage for not only this but many other indicators is created due to the ample count of different settings that are widely used, it is difficult to view the market through the eyes of all types of investors/traders. This indicator manages to counter exactly this issue, you will be able to see all of these settings on one chart and at one time and enter/exit positions accordingly.
Using this indicator will allow you to visualize entries with ease and make order layering (buying/selling in layers) much more simple. You can choose a certain amount of Bollinger Bands you would like displayed and customize all technical and style-related settings related to each of the BBs separately.
A few of the technical settings you can change for each Bollinger Band are:
Bollinger Band count (Select how many BBs you want to be displayed.)
MA type used to make the Bollinger Bands (EMA, SMA, WMA, etc.)
Source (close, open, high, low.)
BB length (The length of each Bollinger Band, its lookback. How many previous candles should it be based on? Choose each Bollinger Band's lookback length.)
BB deviator (The standard Deviator applied for the BB for both the upper and lower line.)
Offset
A few of the style settings you can change for each Bollinger Band are:
Upper, Lower, Basis line opacity % (separate for each)
Upper, Lower, Basis line color (separate for each)
Fill (the color used to fill from the upper to the lower band) (separate for each)
Fill opacity % (the opacity used when filling the upper line to the lower line) (separate for each)
This indicator is unique because it can be used for all strategies and all trading styles, for example, day trading or long-term investing, really anything if used correctly. The reason it can be used in so many instances is a result of the detailed and in-depth settings tab that allows complete customization of each separate Bollinger Band. This allows the indicator to be used and to be useful in various situations and allows you to dominate the market. Integrated alerts also enhance your efficiency while using this indicator because you can choose to be notified at the crossing of any of the Bollinger Bands.
The technical part of this indicator plots the selected amount of Bollinger Bands using custom-built specified Bollinger Bands accordingly. Then it uses the style settings and styles it as you selected.

CDub's BolBands SetupUses a set of Bollinger Bands (user defined deviation, user defined deviation * 2) to determine possible entry set ups.
Signals are triggered when price crosses the first band (closest to the baseline MA) in the desired direction.
baseline can be your take profit 1 target
The inside band determines entry and can be used as a take profit 2 target (Opposite side of baseline)
The outside band is a suggested stop loss target (Same side of baseline) and can be used as a take profit 3 target (Opposite side of baseline)
Suggestions are welcome!
-CDub

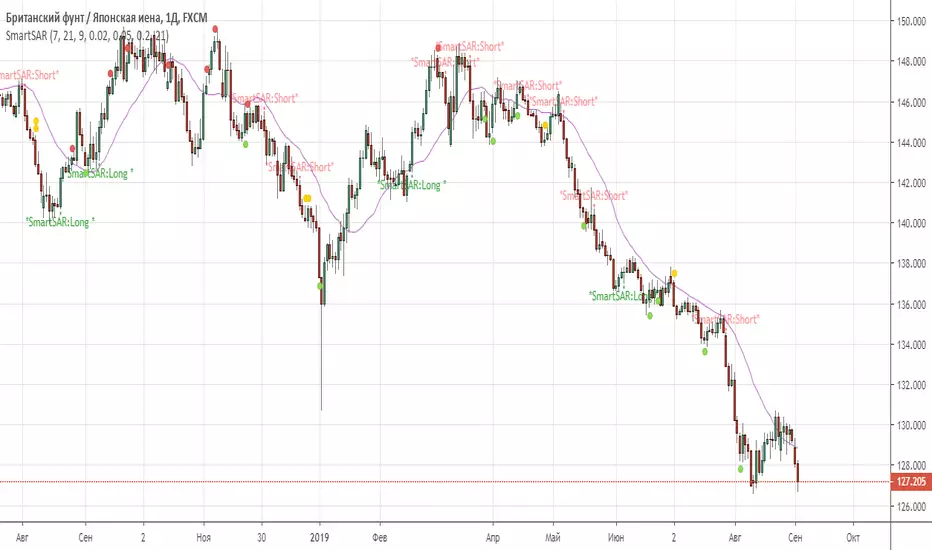
SmartSARSAR signal filtered by 3 indicators: MACD, AC, RVI.
This combination of trend indicator(SAR), 2 oscillators (MACD, RVI) , and 1 Bill Williams (AC) give us good Enter point.
Recommended timeframes: from 30 min and higher.
MPT - MEDIAN PRICE TRADING - custom forex indicator
MPT is a unique custom indicator i created to enter a trade with the right timing
This indicator catches the momentum of a Forex pair and tells you when to enter
It's based on the idea that when the median price in the current timeframe is crossing the median price of the higher timeframe, the momentum is changing and that is an opportunity to trade
red line is median line of current timeframe (default is 1D)
aqua line is projection of past median line on higher timeframe (default is 1W)
white crosses can be used as a trail stop values to follow a trend
when red cross aqua up the background is green and so momentum of the pair is up
when red cross aqua down no background color and momentum down
You can try this indicator for a limited period, just ask for access in comments
If you want unlimited access you can PM me
Trading is a risky business, use it at your own risk. I'm not responsible for any profit or loss
