Scallop Pattern built for scalping NQ & MNQ
The Scallop Pattern identifies momentum reversal.
The pattern consists of two candles and the direction to trade is confirmed in the following candle.
An example trade is shown in the picture. s3.tradingview.com
A Stop Limit order is generally used to enter the long position.
S&P 500 E-Mini Futures

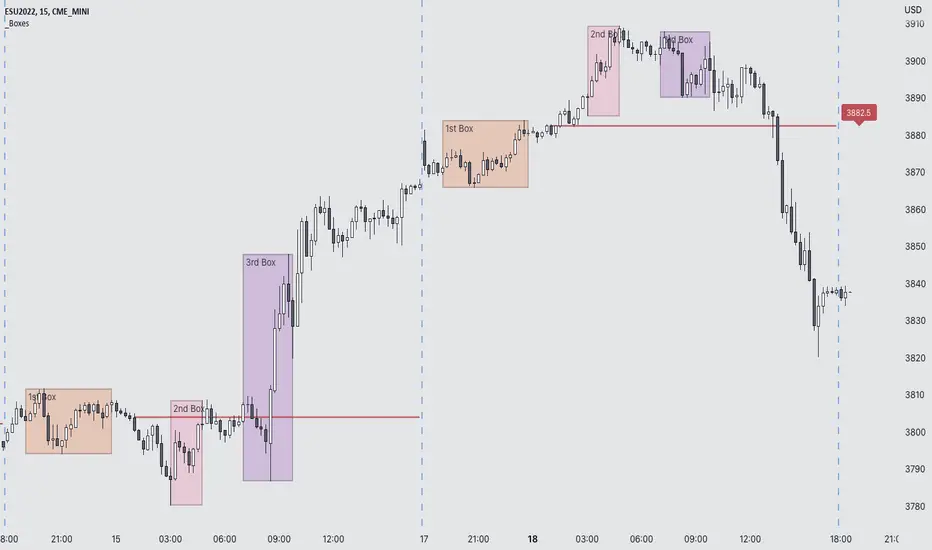
Futures Exchange Sessions 3.0Description
The ultimate conclusion to the Futures Exchange Sessions 2.0 indicator. In version 3.0 the user gets full control of the start and end times of three separate dynamic boxes and one horizontal line. If the user wants to visually keep track of killzones, lunches, or any other time span in a trading day, version 3.0 will dynamically expand and keep track of price within the time specified by the user.
Inputs and Style
Everything about the three dynamic boxes and one horizontal line can but independently configured. Color, style, border, width can all be adjusted. In the Settings each box has a text box so the user can give each one a unique name.
Timezone
All of the start and end times are in EST. Additionally, each box and line need a dependent start of each day. This is controlled by a setting where the user can specify a timezone called Start Day Timezone which would be midnight of the respective timezone. In general if a box or line resides within a particular Session pick the corresponding timezone. If the users box/line fits in the Asian Session then choose Asia/Shanghai. If the box/line is within the London Session then choose Europe/London. And the same goes for the New York Session.
Special Notes
If start time is within one period of the Start Day Timezone in the Settings, then the line/box won't display
Boxes and time lines only display when timeframe is <= 30 minute
To turn off box text label set opacity to 0%
Pre Market \ Opening Range High LowGreen vertical lines are showing pre market open and then the opening range as the first hour of market NYSE market open
Pre market high and low are blue lines | intraday opening range high low are in white
Trades are taken in the current direction above | below range breaks with the direction of price action using the moving averages
Price breaking through moving averages and a range is the optimal trade to enter - exit at next range for target - stop loss below the lower | higher moving average depending on short or long
A break above or below the intraday high or low and pre market high or low can give massive profits trailing your stop loss as price runs
Using MA 5 and 12 to filter out entries and exits above or below the ranges short or long is also another strategy to implement
BEST TIME FRAME TO USE IS 5 MINUTE

LVOLA MODELAnother variant of the VOLA Model Range.
To use this script which focusses on vol on the given equity/commodity/price pair its focussed on at its core methodology. We use NQ1 here as an example on how this indicator can be used. Note the red lines indicate where buy signals occurred an example listed below. Note the best timeframes to use this indicator include (intraday - 1d trades) 7min, 30min, 1hr and Daily for multi day trades. This can be used in conjunction with MVEX VOLA, VOLA & ZVOLA (especially so) when looking to trade $NQ/$ES QQQ / SPY use this in conjunction with the other VOLA models to confirm whether a buy/sell signal. This can also be used on equities since total flows in the bond market can help dictate movement in equities.
This is distilled into a simple method where you can use this indicator to gauge a potential buy or sell signal. The red shows a sell signal and a green which is a buy i.e. when the blue line short term signal (blue line) has a major divergence vs the mid and long term then this is typically a sell signal. This is shown in the chart above.
The green lines indicate where buy signals occurred with an example listed below.
The same goes for the reverse where the short term signal (blue line) is higher then we have a view of a potential buy signal.
Once again when the VVS (Short term signal) is flattened out then we have a slowing done in the movement of price action and a reversion has the potential to occur. The greater the divergence and when the line blue line flat lines i.e. stops going up or down and is separate from the green and the red, you then have a view to take a long (if above green and red with a large gap) and a sell (when blue is below green and red with a large gap).
Once again there are times where the signal will not work, as with every indicator, model etc nothing hits 100% and I doubt there ever will be such an indicator to exist. As with everything please manage your risk.

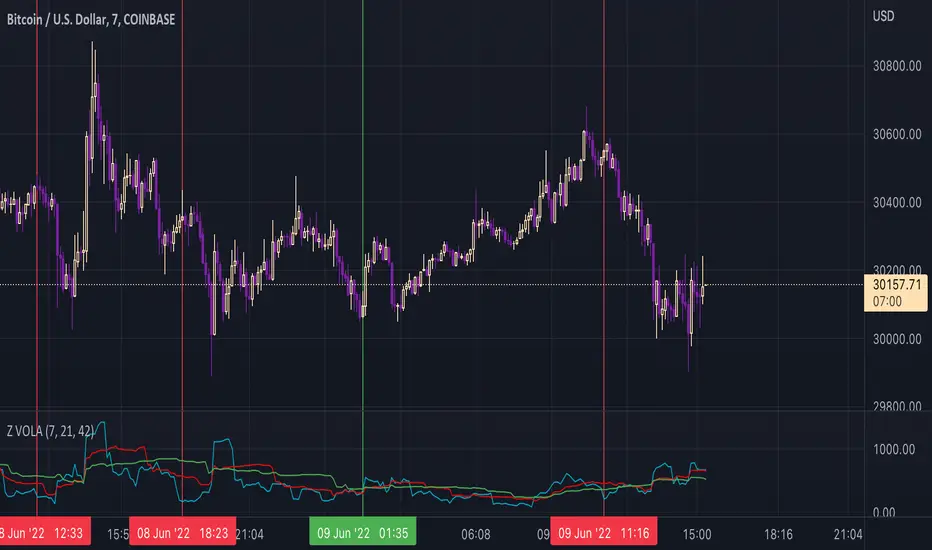
ZVOLA MODELAnother variant of the VOLA Model Range.
To use this script which focusses on vol on the given equity/commodity/price pair its focussed on at its core methodology. We use ES1 here as an example on how this indicator can be used. Note the red lines indicate where buy signals occurred an example listed below. Note the best timeframes to use this indicator include (intraday - 1d trades) 30min, 1hr and Daily for multi day trades. This can be used in conjunction with MVEX VOLA & VOLA in particular when looking to trade $NQ/$ES QQQ / SPY as MVEX VOLA/VOLA can confirm whether a buy/sell signal is in line with the VOLA MODELs move.
This is distilled into a simple method where you can use this indicator to gauge a potential buy or sell signal. The red shows a sell signal and a green which is a buy i.e. when the blue line short term signal (blue line) has a major divergence vs the mid and long term then this is typically a sell signal. This is shown in the chart above.
The green lines indicate where buy signals occurred with an example listed below.
The same goes for the reverse where the short term signal (blue line) is higher then we have a view of a potential buy signal.
Once again when the VVS (Short term signal) is flattened out then we have a slowing done in the movement of price action and a reversion has the potential to occur.
Once again there are times where the signal will not work, as with every indicator, model etc nothing hits 100% and I doubt there ever will be such an indicator to exist. As with everything please manage your risk.
Futures Exchange Sessions 2.0Description
Successor to Futures Exchange Sessions indicator. Completely rebuilt code from the ground up. Every feature has been redesigned and refactored to be the most beneficial while allowing for complete configuration by the user.
This indicator displays Futures Sessions as live boxes that expand dynamically as price moves over the time interval. These boxes make liquidity levels extremely easy to spot and visualize. It helps the user identify market structure and develop their own bias of price action. Everything about the Session boxes can be configured. Box color, border color, border style, and border width are all individually controllable. Each Future Session can be turned on or off at any time. Also, each box has their own text label (Asian Session, London Session, New York Session) and this text can be moved around the box, change color, and change size.
Previous days highs and lows (major liquidity levels) are always important to the futures trader. This indicator now allows the user to individually display the three previous days highs and low levels as lines with optional label. Each line can be independently toggled on or off and like always, every conceivable customization option is available to the user. And the labels can be moved to the right (via the Input Settings) to allow unobstructed views of candles.
The midnight EST open and 8:30 AM EST open horizontal lines (developed by the Inner Circle Trader) are returning in this indicator. But the biggest improvement is that the lines stop at the current bar or the last bar of the trading day. Additionally, the time lines are displayed on previous days so the user can easily see how the candles reacted to these important times of the day.
The Session boxes and the horizontal time lines now can be set to only display a certain number of day back. If the user wants just to see Session boxes for the previous day only, they can do that. If the user wants to see the last 15 days of boxes or lines it is very easy to increase the days back in the settings. Currently, the max days back is 80 calendar days.
Additional Images
Easily visualize and understand price action across time
Everything is customizable so the user can easily match this indicator to their color preferences
Special Notes
To turn off box session text set opacity to 0%
Boxes and horizontal time lines only display when timeframe is <= 30 minute

MVEX VOLA MODELTo use this script which focusses on vol on the given equity/commodity/price pair its focussed on at its core methodology. We use ES1 here as an example on how this indicator can be used. This indicator is mainly for ES/NQ and its constituents (except consumer staples, energy etc) which lack the same correlations.
Note the red lines indicate where buy signals occurred an example listed below. Note the best timeframes to use this indicator include (intraday - 1d trades) 30min, 1hr and Daily for multi day trades.
This is distilled into a simple method where you can use this indicator to gauge a potential buy or sell signal. The red shows a sell signal and a green which is a buy i.e. when the blue line short term signal (blue line) has a major divergence vs the mid and long term then this is typically a sell signal. This is shown in the chart above.
The green lines indicate where buy signals occurred with an example listed below.
The same goes for the reverse where the short term signal (blue line) is higher then we have a view of a potential buy signal.
Once again when the VVS (Short term signal) is flattened out then we have a slowing done in the movement of price action and a reversion has the potential to occur.
Once again there are times where the signal will not work, as with every indicator, model etc nothing hits 100% and I doubt there ever will be such an indicator to exist. As with everything please manage your risk.
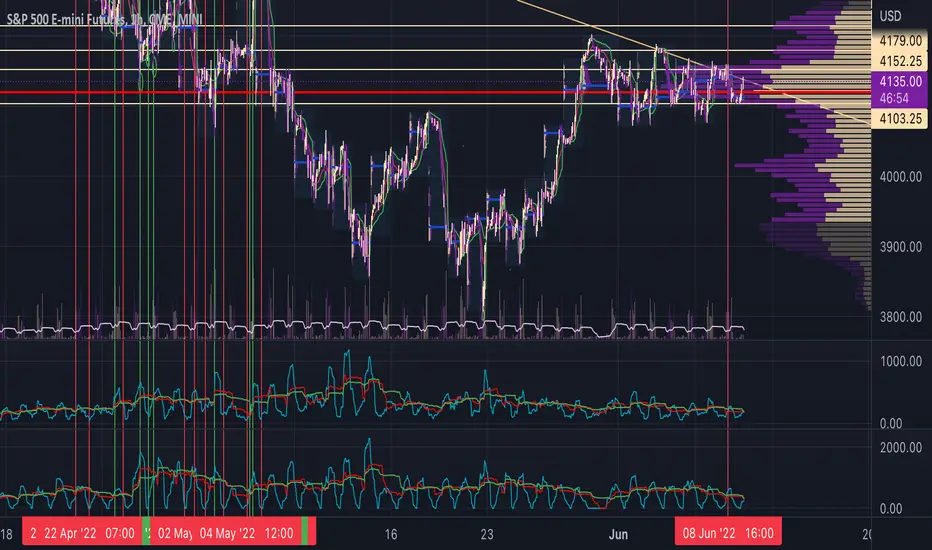
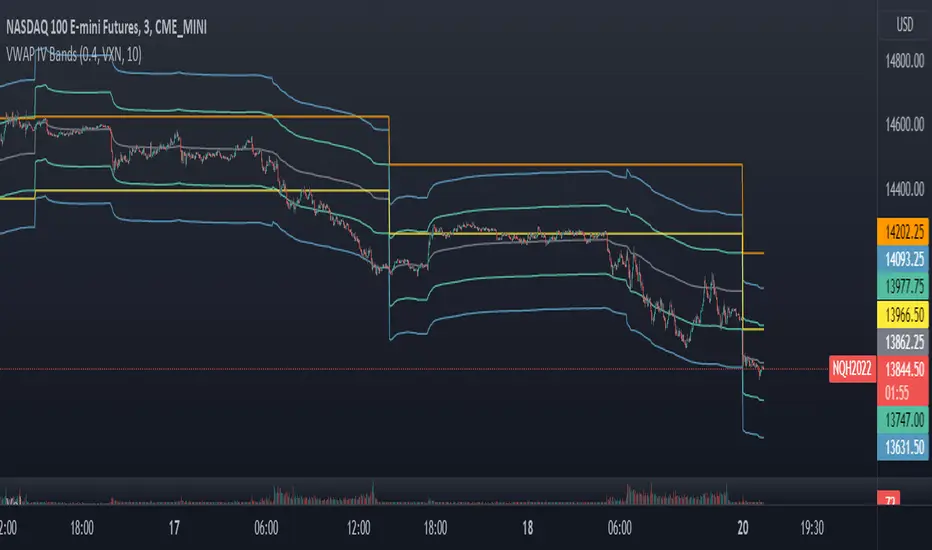
VWAP Implied Volatility BandsThis script takes the built in VWAP function and creates bands using various Volatility Indexes from the CBOE. The script plots the bands at desired multiples, as well as the closing value of the prior day's first set of bands. Users can choose from the following:
VIX(ES), VXN(NQ), RVX(RTY), OVX(CL), GVX(GC), SIV(ZS), CIV(ZC), TYVIX(ZN), EUVIX(EURUSD), BPVIX(GBPUSD)
Upon selecting the desired volatility index, users must change the multiplier to fit the underlying product since the indexes are all calculated differently.
The goal with this script was to use market generated information (IV) to highlight potential trade locations.
VIX Implied Move Bands for ES/Emini futuresThis script uses the close of the VIX on a daily resolution to provide the 'implied move' for the E-mini SP500 futures. While it can be applied to any equity index, it's crucial to know that the VIX is calculated using SPX options, and may not reflect the implied volatility of other indices. The user can adjust the length of the moving average used to calculate the bands, the window of days used to calculate the implied move, and the multiplier that effects the width of the bands.

Equity Index Extended HoursHighlights the extended hours/Globex session for US Equity Index Futures.

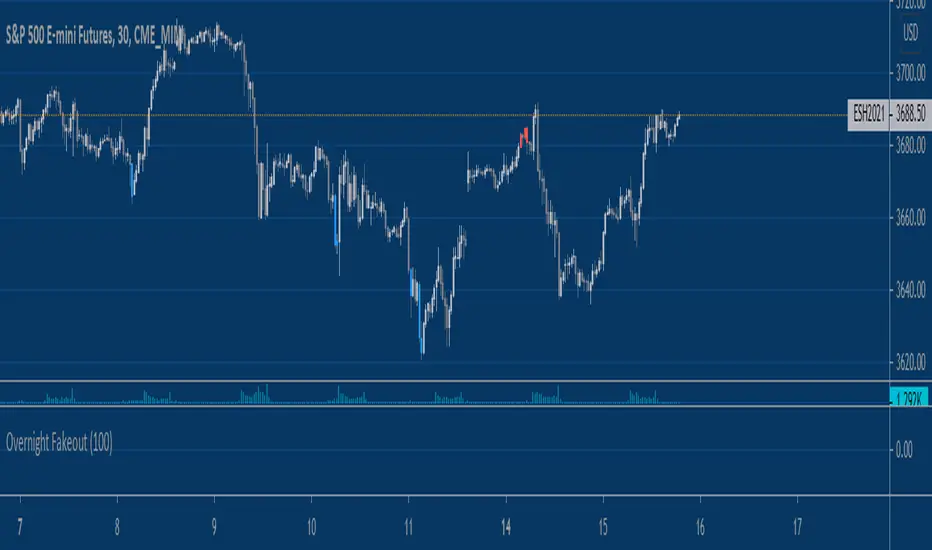
Overnight Bollinger Band ExtremesThis script is a combination of my overnight fakeout script and bollinger band color bars. It's designed to be used on CME/CBOT Equity Indexes during their GLOBEX session. It uses the built in Bollinger Band script and highlights bars that exceed the upper/lower bands during the overnight session.

Keltner Channels Color BarsAnother tweak to a classic built-in script. Simply replacing the Keltner Channels overlay plot with color bars.

Equity Index Overnight FakeoutThis script highlights when price violates the highest high or lowest low within the user's selected lookback period, with the caveat that it occurs during the GLOBEX session. The script is designed to work exclusively with the trading hours for CME and CBOT Equity Index futures. I'm planning to make a more customizable version down the line.
My reasoning behind this very simple script is that the low liquidity and participation of the overnight session creates a tendency for moves at extremes to mean revert. Let me know what you think.
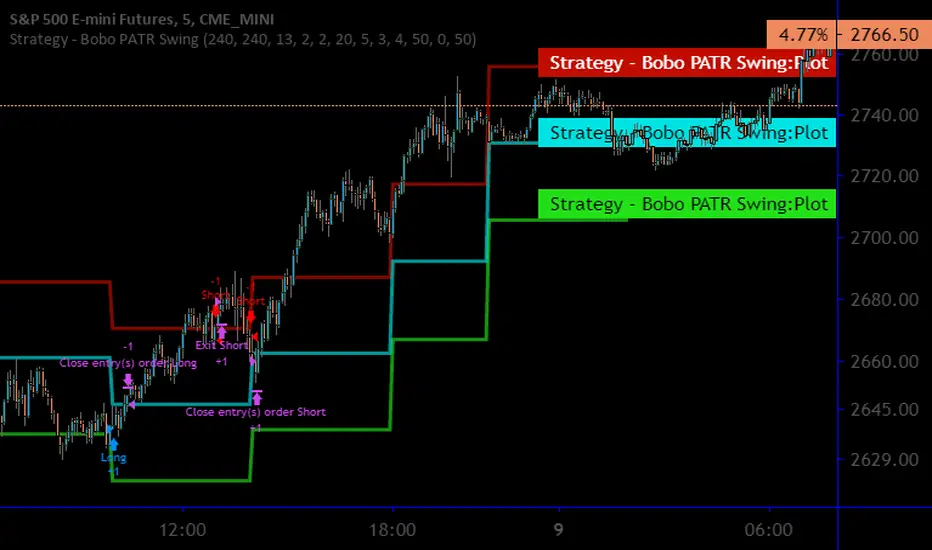
Strategy - Bobo PAPATRHi I've revamped this bot mentioned in the linked idea to make it work with v4 of pine. In doing so there are some very significant changes to how it works. The main one is that it no longer uses traditional daily pivot calculations to calculate the bands. It creates a more dynamic intraday set of pivot points based on recent price action rather than yesterday's ohlc. As published, the bot is tuned for a 15 min time frame. But it actually works well on lower time frames you just need to adjust the lookback periods in settings a bit to re tune it. It's also tuned to ES really but will need tweaking for a different instrument at the very least.
The basic concept is recent price action is used to calculate a 'middle' around which red and green bands are located. Their position or width is largely determined by recent volatility. The middle line is again calculated from recent price action. The three lines from that form a tradeable range with green at the top and red at the bottom. The strategy is simple enough, it shorts as it sinks from outside red, and longs when rising above green. The basic principle being that once you enter that range you have a high probability of hitting the middle before you hit your stop loss. So the basic principle is you are trying to capture the inherent ranginess of liquid indices like S&P 500. That back and forth movement that happens. The bot is capturing this by fading extremes of a recent range but the problem with that is you'dd get murdered in a strong trend. To mitigate that there is a trend calculation running in the background the will prevent trading against firm trends mostly. So the bot should trade mostly in rangy conditions because that is what it is trying to do.
Bot will close issue close signals automatically upon crossing the middle, it also will close automatically at predefined stops or limits. These values are denominated in market mintick values. For example the CFD SPX500 has a mintick of 0.1. Therefore a stop value of 100 will equate to 10 points on the index. If trading the same market via ES1! the mintick value is different - 0.25. So in this case a value of 40 is required to set the stop at 10 points.
Anyway shout if you have questions. Hope it's useful.
TVC:SPX OANDA:SPX500USD

Strategy - Bobo Intraday Swing Bot with filtersThis is an adapted version of my swing bot with additional filters that mean it works quite well on lower timeframes like 1min, 5 mins as long as you adjust the setting accordingly (reduce pivot timescale, band width)
Entry conditions are filtered by an invisible trend calculation running in the background so the bot doesn't repeatedly try and fail to fade a strong trend. It has just about everything you should need for basic use, stop losses and targets, automatically close trade at pivot.
I get good results on rangey instruments like major indices such as SPX / ES that kind of thing. Make sure you understand the minmum tick value of an index so the stop setting on the bot work properly
Hope it's useful!
TradersAI - Test 3**** This is a TEST script only! Do NOT use on real money accounts! *****
***** Intended to be used in testing by invited_only members *****
***** If you want to participate in our testing using your paper trading account(s), send me a private message *****

TradersAI Test Script 1This is a script to test trading flows from an invite only script to one's trading view chart and then possibly to one of the connected brokers.
**** Do NOT use on real funds - this randomly triggers trades. Do NOT use on real money accounts. ******

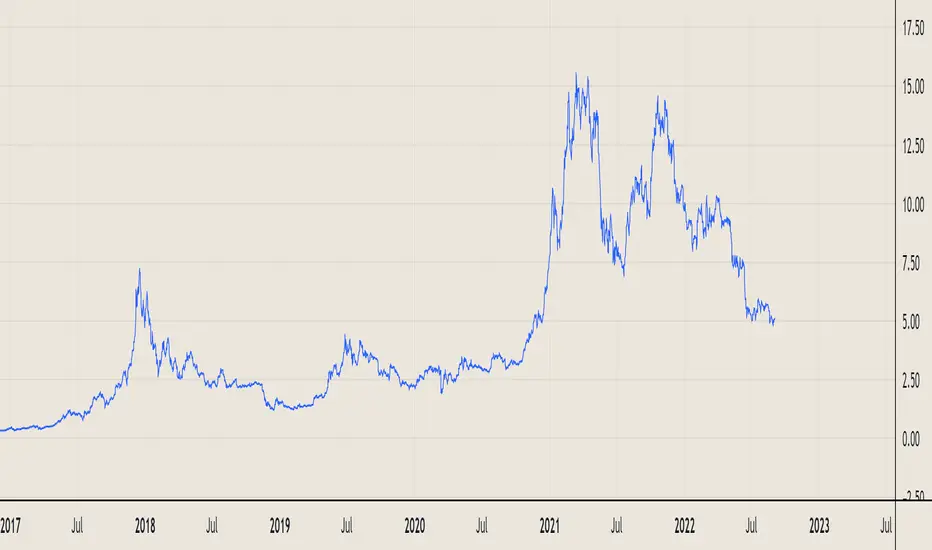
@WACC Volatility Weighted PUT/CALL Positions [SPX]This indicator is based on Volatility and Market Sentiment. When volatility is high, and market sentiment is positive, the indicator is in a low or 'buy state'. When volatility is low and market sentiment is poor, the indicator is high.
The indicator uses the VIX as it's volatility input.
The indicator uses the spread between the Call Volume on SPX/SPY and the Put Volume.
This is pulled from CVSPX and PVSPX.
When volatility and put/call reaches a critical level, such as the levels present in a crisis or a sell off, the line will be green. See Sept 2015, 2008, and Feb 2018.
This level can be edited in the source code.
As the indicator is based on Put/Call, the indicator works best on larger time frames as the put/call ratio becomes a more discernible measure of sentiment over time.

(JS) S&P 500 Volatility Oscillator For OptionsThe idea for this started here: www.tradingview.com with the user @dime
This should only be used on SPX or SPY (though you could use it on other things for correlation I suppose) given that the instrument used to create this calculation is derived from the S&P 500 (thank you VIX). There's a lot of moving parts here though, so allow me to explain...
First: The main signal is when Implied Volatility (from VIX) drops beneath Historical Volatility - which is what you want to see so you aren't purchasing a ton of premium on long options. Green and above 0 means that IV% has dropped lower than Historical Volatility. (this signal, for example, would suggest using a Long Call or Put depending on your sentiment)
Second: The green line running underneath zero is the bottom portion of the "Average True Range" derived from the values used to create the oscillator. the closer the bottom histogram is to the green line, the more "normal" IV% is. Obviously, if this gets far away from the line then it could be setting up nicely to short options and sell the IV premium to someone else. (this signal, for example, would suggest using something like a Bull Put Spread)
Third: The red background along with the white line that drops down below zero signals when (and how far) the IV% from 3 months out (from VIX3M) is less than the current IV%. This would signal the current environment has IV way too high, a signal to short options once again (and don't take any long option positions!).
Tried to make this simple, yet effective. If you trade options on SPX, SPY, even ES1! futures - this is a tool tailored specifically for you! As I said before, if you want you can use it for correlation on other securities. Any other ideas or suggestions surrounding this, please let me know! Enjoy!

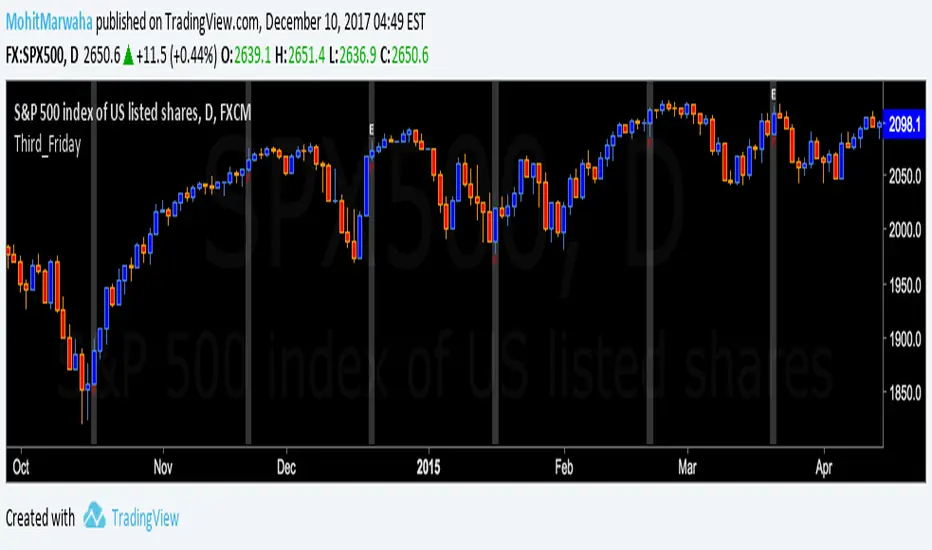
Third_Friday_with_ES1!_ExpiryThe Script Plots a background color on each third friday and also plots the letter E above the fridays on which the ES1! Futures expire.