Quatro SMA Strategy [4h]Hello, I would like to present to you The "Quatro SMA" strategy
Strategy is based on four simple moving averages of different lengths and monitoring trading volume. The key idea is to identify strong market trends by comparing short-term moving averages with the long-term SMA. The strategy generates buy signals when all short-term SMAs are above the SMA(200) and the volume confirms the strength of the move. Similarly, sell signals are generated when all short-term SMAs are below the SMA(200), and the volume is sufficiently high.
The strategy manages risk by applying a stop loss and three different Take Profit levels (TP1, TP2, TP3), with varying percentages of the position closed at each level.
Each Take Profit level is triggered at a specific percentage gain, with the position being closed gradually depending on the achieved targets. The percentage of the position closed at each TP level is also defined by the user.
Indicators and Parameters:
Simple Moving Averages (SMA):
The script utilizes four simple moving averages with different lengths (4, 16, 32, 200). The first three SMAs (SMA1, SMA2, SMA3) are used to determine the trend direction, while the fourth SMA (with a length of 200) serves as a support/resistance line.
Volume:
The script monitors trading volume and checks if the current volume exceeds 2.5 times the average volume of the last 40 candles. High volume is considered as confirmation of trend strength.
Entry Conditions:
- Long Position: Triggered when SMA1 > SMA2 > SMA3, the closing price is above SMA(200), and the volume condition is met.
- Short Position: Triggered when SMA1 < SMA2 < SMA3, the closing price is below SMA(200), and the volume condition is met.
Exit Conditions:
- Long Position: Closed when SMA1 < SMA2 < SMA3 and the closing price is above SMA(200).
- Short Position: Closed when SMA1 > SMA2 > SMA3 and the closing price is below SMA(200).
to determine the level of stop loss and target point I used a piece of code by RafaelZioni, here is the script from which a piece of code was taken
I hope the strategy will be helpful, as always, best regards and safe trades
;)
ETHUSD

BTC outperform atrategy### Code Description
This Pine Script™ code implements a simple trading strategy based on the relative prices of Bitcoin (BTC) on a weekly and a three-month basis. The script plots the weekly and three-month closing prices of Bitcoin on the chart and generates trading signals based on the comparison of these prices. The code can also be applied to Ethereum (ETH) with similar effectiveness.
### Explanation
1. **Inputs and Variables**:
- The user selects the trading symbol (default is "BINANCE:BTCUSDT").
- `weeklyPrice` retrieves the closing price of the selected symbol on a weekly interval.
- `monthlyPrice` retrieves the closing price of the selected symbol on a three-month interval.
2. **Plotting Data**:
- The weekly price is plotted in blue.
- The three-month price is plotted in red.
3. **Trading Conditions**:
- A long position is suggested if the weekly price is greater than the three-month price.
- A short position is suggested if the three-month price is greater than the weekly price.
4. **Strategy Execution**:
- If the long condition is met, the strategy enters a long position.
- If the short condition is met, the strategy enters a short position.
This script works equally well for Ethereum (ETH) by changing the symbol input to "BINANCE:ETHUSDT" or any other desired Ethereum trading pair.

Aroon and ASH strategy - ETHERIUM [IkkeOmar]Intro:
This post introduces a Pine Script strategy, as an example if anyone needs a push to get started. This example is a strategy on ETH, obviously it isn't a good strategy, and I wouldn't share my own good strategies because of alpha decay. This strategy combines two technical indicators: Aroon and Absolute Strength Histogram (ASH).
Overview:
The strategy employs the Aroon indicator alongside the Absolute Strength Histogram (ASH) to determine market trends and potential trade setups. Aroon helps identify the strength and direction of a trend, while ASH provides insights into the strength of momentum. By combining these indicators, the strategy aims to capture profitable trading opportunities in Ethereum markets. Normally when developing strats using indicators, you want to find some good indicators, but you NEED to understand their strengths and weaknesses, other indicators can be incorporated to minimize the downs of another indicator. Try to look for synergy in your indicators!
Indicator settings:
Aroon Indicator:
- Two sets of parameters are used for the Aroon indicator:
- For Long Positions: Aroon periods are set to 56 (upper) and 20 (lower).
- For Short Positions: Aroon periods are set to 17 (upper) and 55 (lower).
Absolute Strength Histogram (ASH):
ASH is calculated with a length of 9 bars using the closing price as the data source.
Trading Conditions:
The strategy incorporates specific conditions to initiate and exit trades:
Start Date:
Traders can specify the start date for backtesting purposes.
Trade Direction:
Traders can select the desired trade direction: Long, Short, or Both.
Entry and Exit Conditions:
1. Long Position Entry: A long position is initiated when the Aroon indicator crosses over (crossover) the lower Aroon threshold, indicating a potential uptrend.
2. Long Position Exit: A long position is closed when the Aroon indicator crosses under (crossunder) the lower Aroon threshold.
3. Short Position Entry: A short position is initiated when the Aroon indicator crosses under (crossunder) the upper Aroon threshold, signaling a potential downtrend.
4. Short Position Exit: A short position is closed when the Aroon indicator crosses over (crossover) the upper Aroon threshold.
Disclaimer:
THIS ISN'T AN OPTIMAL STRATEGY AT ALL! It was just an old project from when I started learning pine script!
The backtest doesn't promise the same results in the future, always do both in-sample and out-of-sample testing when backtesting a strategy. And make sure you forward test it as well before implementing it!

Trend Following based on Trend ConfidenceThis is a Trend Following strategy based on the Trend Confidence indicator.
The goal of this strategy is to be a simple Trend Following strategy, but also to be as precise as possible when it comes to the question 'how confident are we that a linear trend is ongoing?'. For this we calculate the 'confidence' of a linear trend in the past number of closing prices. The idea of this strategy is that past a certain confidence, the ongoing linear trend is more likely to continue than not.
Trend Confidence:
The Trend Confidence shows us how strong of a linear trend the price has made in the past number (given by Length parameter) of closing prices. The steepness of the price change makes the Trend Confidence more extreme (more positive for an uptrend or more negative for a downtrend), and the deviation from a straight line makes the Trend Confidence less extreme (brings the confidence closer to 0). This way we can filter out signals by wild/sudden price moves that don't follow a clear linear trend.
Math behind the Trend Confidence:
A linear fit is made on the past number of closing prices, using Ordinary Linear Regression. We have the steepness of the linear fit: b in y=a+bx . And we have the standard deviation of the distances from the closing prices to the linear fit: sd . The Trend Confidence is the ratio b/sd .
Entries and Exits:
For entry and exit points we look at how extreme the Trend Confidence is. The strategy is based on the assumption that past a certain confidence level, the ongoing linear trend is more likely to continue than not.
So when the Trend Confidence passes above the 'Long entry" threshold, we go Long. After that when the Trend Confidence passes under the 'Long exit' threshold, we exit. The Long entry should be a positive value so that we go Long once a linear uptrend with enough confidence has been detected.
When the Trend Confidence passes below the 'Short entry' threshold, we go Short. After that when the Trend Confidence passes above the 'Short exit' threshold, we exit. The Short entry should be a negative value so that we go Short once a linear downtrend with enough confidence has been detected.
Default Parameters:
The strategy is intended for BTC-USD market, 4 hour timeframe. The strategy also works on ETH-USD with similar parameters.
The Length is arbitrarily set at 30, this means we look at the past 30 closing prices to determine a linear trend. Note that changing the length will change the range of Trend Confidence values encountered.
The default entry and exit thresholds for Longs and Shorts do not mirror each other. This is because the BTC-USD market goes up more heavily and more often than it goes down. So the ideal parameters for Longs and Shorts are not the same.
The positive results of the strategy remain when the parameters are slightly changed (robustness check).
The strategy uses 100% equity per trade, but has a 10% stop loss so that a maximum of 10% is risked per trade.
Commission is set at 0.1% as is the highest commission for most crypto exchanges.
Slippage is set at 5 ticks, source for this is theblock.co.

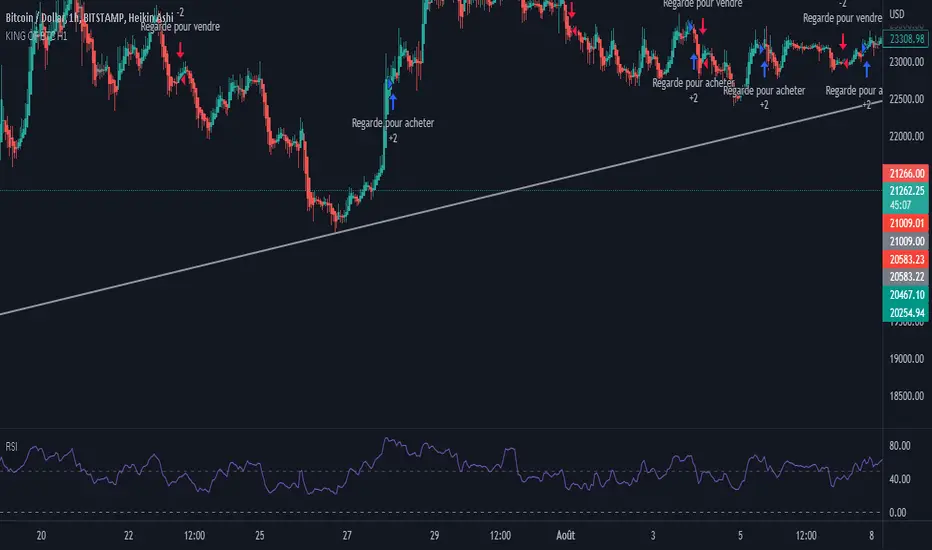
Ultimate Bitcoin StrategyThis is my masterpiece.
I recommend using it following strict rules:
Buy = Wait for the next green Heikein Ashi candle and RSI above 50
Sell: Wait for the next red Heikein Ashi candle and RSI below 50
Use it in H1
Enjoy.
GMMAs v2.0 CRYPTO [badshah_e_alam]Hello Traders ,
The GMMAs v2.0 CRYPTO strategy stands for gap modified moving averages designed for cryptos. This is a non Repainting Indicator.
This strategy version is a advanced and modified to one of my previously published indicator named as "gap modified moving average".
I am using my Modified Moving Average indicator for a while. I always wanted to add some more information to moving
averages and made some modification to Moving averages.
The additional Information I have added to the Moving Average helps it to act more quickly based on the price of that
particular asset.
How is strategy gives signals?
when the GMMA'w cross over or cross under the GMMA'y than a trade is taken depending on the filter status.
Info about the settings :
The default setting is for 11m ETHUSD , it works with other cryptos and other timeframe as well . For other timeframes it need to be fine tuned and need little change.
The first category is for the selection of Moving average to be modified and the source to be used for that moving average .
I have added seven moving averages to choose between. SMA works good for me , you can choose and play with other MAs.
following are the option to choose MAs
1.EMA
2.SMA
3.HMA
4.RMA
5.WMA
6.VWMA
7.SWMA
Next option in setting is GMMA'y and GMMA'w :
these two settings define the length and lookback period of the MA you have choosed above.
The length is similar to the length of the moving average chosen to be modified.
The lookback option will look for that number of bars for the modification.
GMMA'w is more sensitive than the GMMA'y. So make sure that the setting input of the GMMA'y is significantly larger than the
GMMA'w.
FILTER:
I have added TradingView inbuilt SUPERTREND as a filter in the strategy, it works very good in filtering out false trades
you can enable/disable it in the settings.
EXIT strategy:
The exit Strategy is based on ATR, Take profit and SL are decided by the ATR in the SL/TP setting option. You can change the RR ratio in the setting.
The backtest settings are as follow:
Initial capital:10k
Initial Commission = 0.000
Initial Pyramiding = 0
Reference :
Thanks to pinecoders and Tradingview community.
my previous gap modified moving average version is :https://in.tradingview.com/script/e3WestBa-Gap-Modified-Moving-Average/
watermark added from:
color gradient framework picked from :https://in.tradingview.com/script/hqH4YIFa-Color-Gradient-Framework-PineCoders/
DISCLAIMER
Any and all liability for risks resulting from investment transactions or other asset dispositions carried out by the user based on information received or a market analysis is expressly excluded by me.
All the information made available here is generally provided to serve as an example only, without obligation and without specific recommendations for action. It does not constitute and cannot replace investment advice. We therefore recommend that you contact your personal financial advisor before carrying out specific transactions and investments.
Do your own research and Risk management before taking any trade.

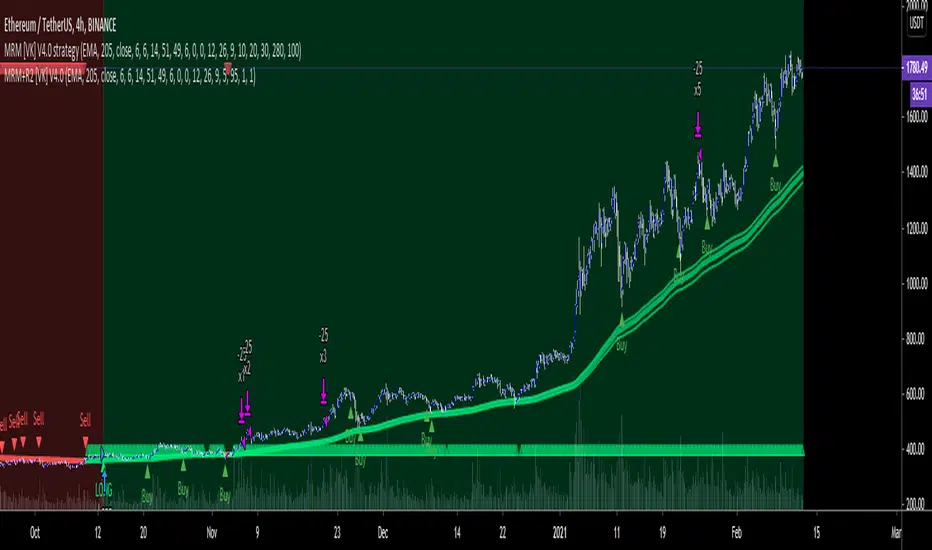
MRM [VK] V4.0 strategyMRM VK strategy
This strategy uses MA, RSI , MACD combined.
MACD and RSI can be used multi time frame to filter trend.
It is a very simple strategy which goes long/short when MACD , RSI and MA Trend Changes in higher Time Frame.
OBV_RMA_CRYPTO Buy and Hold Destroyer free versionThis is a free version which use part of the logic that I am applying on my destroyer/annihilation series of strategies.
This version its made for 8-12h and works amazingly on the ETH pairs. Can be adapted to others as well
For this example, I used an initial 1$ account, using always full capital on each trade(without using any leverage), together with a 0.1% commission/fees for each deal, on Coinbase broker.
For risk management, we have a hard stop loss on the equity of 25%.
The components for the inside of the strategy are the next one :
1. OBV- SoftKill Version adapted to cryptos
2. ATR - SoftKill Version adapted to cryptos
3. RMA Rolling moving average
The rules here are simple we check for the trend direction with ATR and then we check for cross up or above on OBV and RMA moving average. Based on this we enter long or short.
RISK WARNING
Trading on any financial market involves a risk of loss. Please consider carefully if such trading is appropriate for you. Past performance is not indicative of future results.
If you have any questions or you are interested in trying it, private message me and I will give you as soon as I see the message a trial for it.

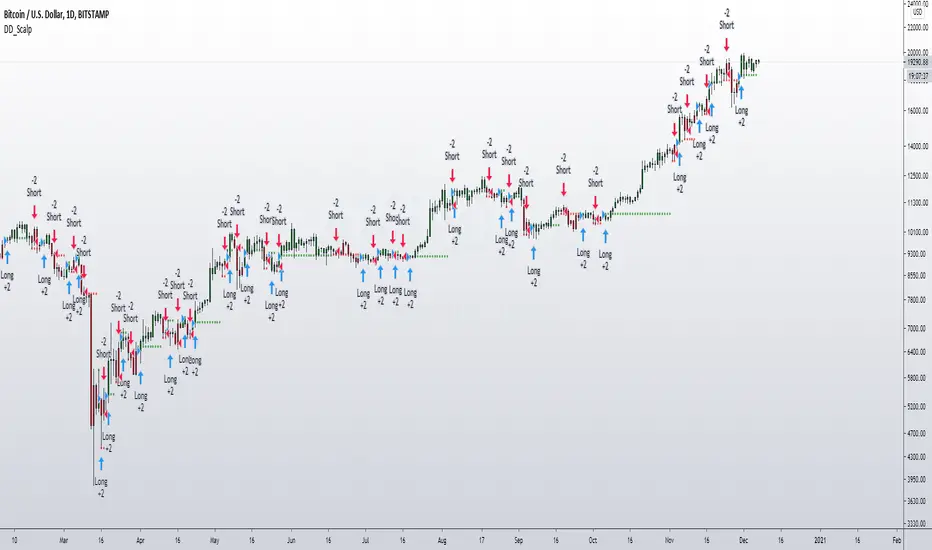
DD_ScalpDD_Scalp is a buy/sell trading strategy based on momentum from breakout levels. It works well on 1D and 4H timeframes. It is a helpful indicator for scalping short range profits on a daily basis or for booking profits in a high time frame setups such as those given by my DD_Echo indicator. It works for all major cryptos such as BTC, ETH, LINK, and other alts. It also works for forex.
If you want to access this, please DM me.
Crypto ZigZag RSI strategy 15minThis strategy is designed for crypto markets like ETHUSD/T, BTCUSD/T and so on.
It works amazingly with 15 min time frames.
Its idea consists in :
We have the RSI indicator, and with it we check for the crossover with overbought and oversold levels. At the same time we have the zigzag which is made from the higher highs and the lower lows between a specific price movement in %.
For entries, they are going to be based on the crossover of rsi with overbought or oversold levels , combined together with cross over 0 line from the the zigzag.
At the same time the strategy has the posibility to go only long, only short or both.
Let me know if you have any questions.

Multi Time Frame Buy&Sell V4.0 [BACKTEST]Hi guys,this indicator Developed for Intraday and multi Time Frame Trading. Note: Invite only Script.Request to me Access permission to test this.
*** THIS IS STUDY VERSION ***
Time Frame : can use for 15 min / 30 min / 1h / 4h time
15 min configuration is best result for bitcoin and ethereum .
This can be used : Crypto Currency/ Bitcoins / ethereum ,Forex,currencies ,Index ,Commodity Gold / silver , Oil Market and in Equity / Futures
ETHUSDT Futures 15min
BTCUSDT Futures 15min:
GOLD /USD FOREX 15min:
HOW IT WORKS:
this indicator analyze EMA&SMA support and resistance then combine with pivot point and fibo levels is used to calculate the signals.and finally show entry label on
chart with target point and stop loss
HOW TO USE:
Creating a signal is as simple as adding the indicator called to your chart(buy or sell)label and background color change ( green=buy / red = sell)
green line is target and black line is stop loss.
in top of setting page you can see noise filter option . that can change it to get better result and reduce noise. in setting can set 3 target level and stoploss
NOT:all information show to info panel in chart.
strategy tester : enabled .All you can test this in live market in any segment.
NOT: can to change noise filter in setting setup until to get best result.
Choose any Date Month Year to Current Date and check the results below in the Strategy Tester.
REPAINT/NO REPAINT : No Repaint ,entery labal(buy or sell) and Background Color wont change. In the current candle position wait for the candle to close to see the
stability.
"Set alert": Select "Once per bar close" for your alert options.
There are 5 alerts:
- BUY
- SELL
- BUY OR SELL (for free TV users)
- take profit
- stop loss
Review and Feedback.Thank you!
Any issues report to me to Fix.Thank you!
how To Get access : Use the link below to obtain access to this indicator or PM us to obtain access.

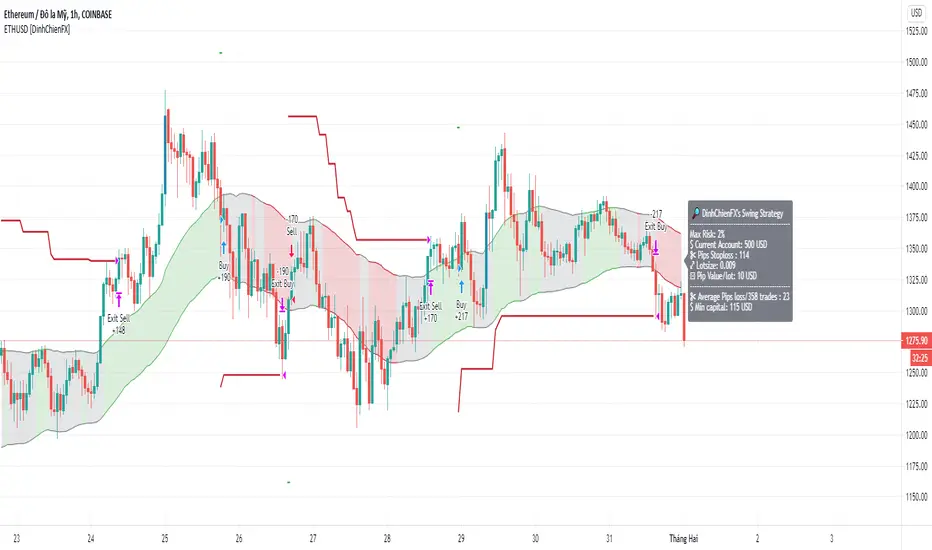
ETHUSD signal [DinhChienFX Corner] Ver 1.01. How to use Keltner Channel
a_ Length of Keltner's basis line is 50. It gives the best result in finding rule of ETHUSD.
b_ How to confirms a trend.
- Upper 1 is used to confirm Keltner channel at Uptrend to give Buy_1.
- Lower 1 is used to confirm Keltner channel at Downtrend to give Sell_1.
c. How to determine a swing Entry.
- Upper 1 is used to buy when the market make a corrective.
- Lower 1 is used to sell when the market make a corrective.
d. Color count calculate
- Color count = Green + Red
- If Color count > 0 is Uptrend to give Buy_2
- If Color count < 0 is Downtrend to give Sell_2
2. Long signal is confirmed when Closed of candle crossover the Upper 1 & Color count for Uptrend.
3. Short signal is confirmed when Closed of candle crossunder the Lower 1 & Color count for Downtrend.
4. Stoploss is calculated by the price closed candle +/- the value of Average true range (length=20 bars)
Stoploss = previous Close +/- atr(20)x2x0.9
-> To move the stoploss every 1 hour.
5. Filter the Candle is over 93% for Not Entry.
6. Report the result at Backtest:
a. Longterm result 2018-23/9/2020:
b. Midterm result (every year)
_ 2018-2019:
_ 2019-2020:
c. Shortterm 01/01/2020 to 09/23/2020
--------------
"Use the link below to obtain access to this indicator" or "PM us to obtain access"
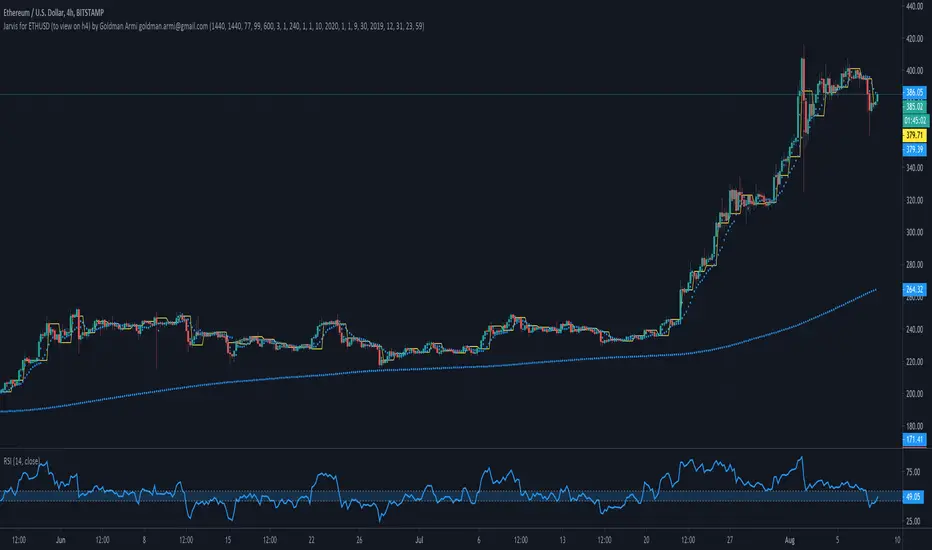
Jarvis for ETHUSD by Goldman ArmiThis strategy is called JARVIS after the famous AI from the MARVEL movie Iron Man.
It is an improvement of the Copernicus Strategy to get better results. More exactly I was aiming to obtain over 50% of the number of trades profitable, for every pair provided (see the title).
The strategy tester does not include leverage trading, please keep that in mind and feel free to change the parameters of the volume for the position in the strategy settings to see the closer to reality results.
The setup for this strategy is more complicated because it includes 3 averages, all of them calculated with prices obtain by various formulas for each one of them and I call this: Sophisticated Moving Average (Copyright). Each of the 3 averages are applied to different timeframes and have different values. All of these parameters are configured separately for every trading pair and this is why I am publishing them separately.
There are not a lot of trades in this strategy, the average is around 1/month.
You can use the Tradingview alert services to configure this to execute (webhook) on your exchange/broker, because strategies have now the possibility to send alerts.
For other questions please send me a message.
VK trend scalper 30mThis strategy is designed to be used on the 30 minute time frame
In this strategy, I actually implemented my own scalping style into building the strategy. Having to replicate my own trading strategy into an algorithm, I can't make it exactly perfect to how I would trade, but what I can do is try and program the parameters that give it the absolute best chance of making a big move with a small drawdown- which replicates part of my trend trading style. Here I am using VWMA , EMA and trend filtering values to find trend change and best entries.
you can also try it on any cryptocurrency/forex/commodity/stocks
*This script is currently experimental you can try it if you want.

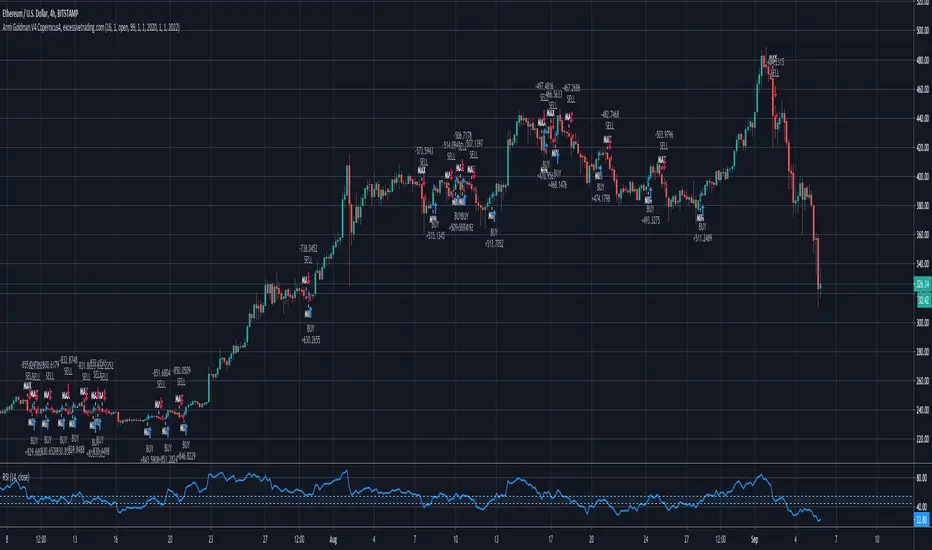
Armi Goldman V1.7 CopernicusScript uses an EMA (Exponential Moving Average) as an indicator. When the price crosses (breakout/breakdown) the EMA, the trigger is activated. Script does the breakout and breakdown calculations. It considers one candle close above or below the EMA.
It is used only in trending markets like bullish trends and/or bearish trends and never in flat. It can get very bad results so pay attention!
Feel free to test it and add comments.
I am open to answer any questions.
I would like to know what you think and how can we improve this strategy.
Thank you & enjoy!
Takashi Bows Autopilot | 2nd Gen | [Strategy]This is a strategy tester for Takashi Bows Autopilot indicator. Please check for more details and instructions at our website.
Takashi Bows Autopilot is the ultimate trading tool. Effortless, its signals put traders inside strong trends, locking big profits that cover all loss generated during sideways trends.
An upgrade version of Takashi Bows v1, this script is the result of some operations developed by us, it can easily adapt to different markets and time frames. Now ranging from level 1 to 20, traders can select the amount of signals to be displayed on the chart. Based on price movement, it signals entries after strong movement up or down.
Take Profit included. If a position is opened in one direction, it should be closed at take profit levels or when a position in the opposite direction is opened.
Inputs
Level
Integer input. Sets a level for signals generated up and down. The higher the level, more signals on chart, and vice-versa.
Take Profit %
Float input. Sets a percent of take profit for exiting previous open position.
Rule
Float input. Sets a ruler for more accuracy on less volatile markets. Standard value 1 for high volatile markets, higher values for low volatile markets.
Disclaimer:
Back-tests do not guarantee performance on the future. Even if a trading setup is profitable in historical data. it could be unprofitable in the future.
To get access to this and other scripts check links below.

Super Algorithm Strategy (Joy Bangla)This is the strategy tester for the
Below are the performance results
Starting with $10,000
Net Profit: 88%
66% profitable trades
34% losing trades. Do look at the losing trades. If one did careful moment management, some of those may end up profitable as well.
4.158 Profit factor.
16.1% drawdown. I would go a bit more and say if I am using this, my risk management should ensure for a stop loss of 20%.
66 bars on average (aka it holds for a long time. So, one needs to look into the funding factor in money management)
Sharpe Ratio: 0.291
Only 7 trades done (with 6 closed) in 2 and a half years. So this absolutely reduces noise as much as possible.
In short, if I had $10000 of BTC beginning of 2018, I would be having $18,878 worth of btc right now.
With 4x leverage, this could be a huge potential.
For info on gaining access see the ⬇ link below ⬇ in our signature field & direct message me. I have a busy schedule at my own workplace. Trading is my hobby. Hence, please be kind to me if I am late in replying.

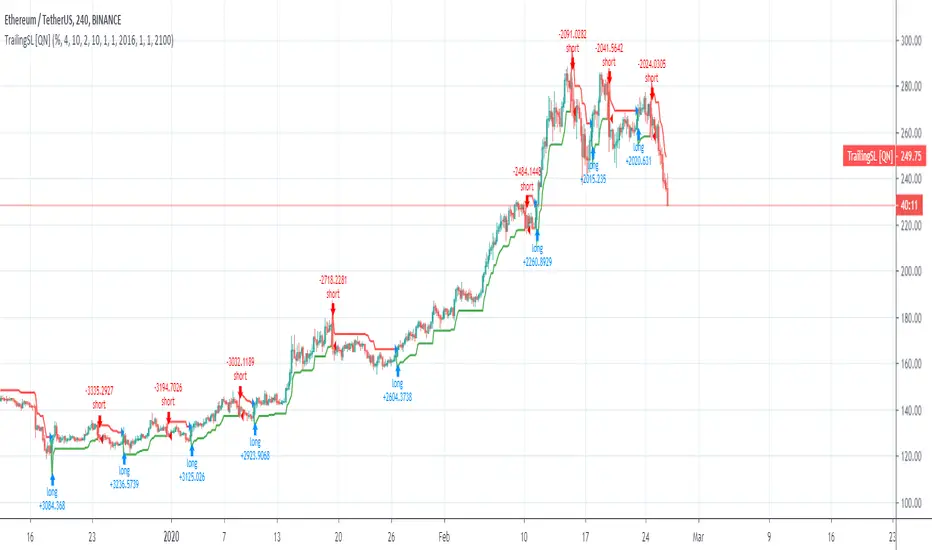
Trailing SL Strategy [QuantNomad]I'm a big fan of simple strategies.
This one is a very simple one. So it consists only from one Trailing SL. When SL is hit, the position is reversed and SL is tracked for a new position.
You can choose one of 3 types of SL:
% of your price
ATR - it is calculated as current ATR * multiplier
Absolute
As you can see even this simple strategy can show pretty good results.
TheEvilPeanutStrategy'The Evil Peanut Strategy'
Description:
This is a strategy that use breakout for entry and exits. It will close the trade in any direction (long or short) if the indicators are through the roof.
How to use :
Simply follow the signals as confirmations for your trades.
It will take time, but we will make money peanut by peanut with it. =D
Don't hesitate to contact me if you find anything wrong with it or if you have suggestions too add to it.
Happy Trading!

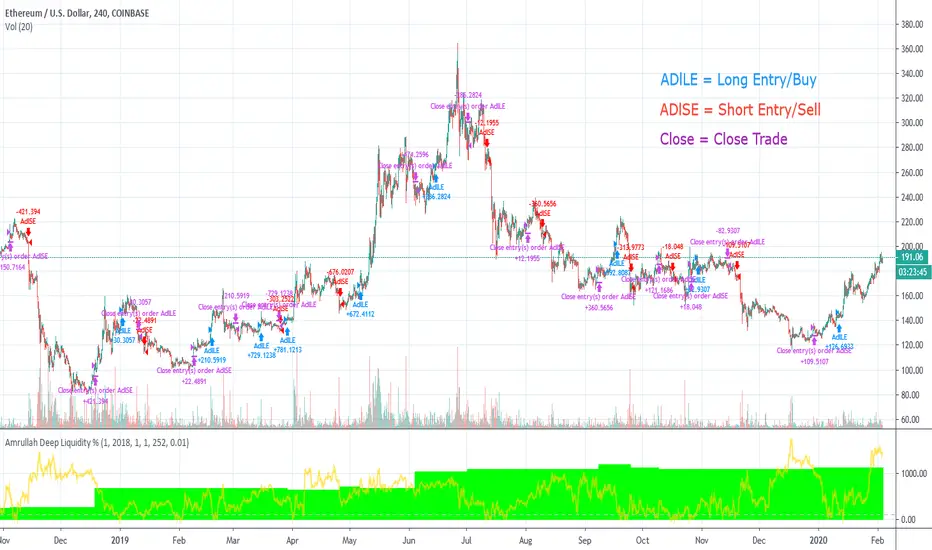
Amrullah Deep Liquidity for ETHUSDAmrullah Deep Liquidity (ADL)
Amrullah Deep Liquidity (ADL) is a high profit factor strategy based on models designed by Muhd Amrullah.
Choosing your trading pair that you are planning to backtest
Check that you have been given access to Amrullah Deep Liquidity (ADL). Select ETHUSD with the default 4H time frame. Once done, open Indicators > Invite-Only Scripts > Amrullah Deep Liquidity %.
Choosing your initial capital that you want to begin backtesting
Go to Settings > Properties > Initial Capital and type in the amount of capital you're starting with. For the ETHUSD trading pair, the initial capital is denominated in USD.
Adjusting your equity at risk until the trades match your risk profile and comfort level
Go to Inputs > Equity Risk and adjust the value you are comfortable with. To analyse performance, you also want to choose the Start Year, Start Month and Start Date. Select lower equity risk for trades that you intend to take without the use of leverage. You can select an equity risk from 0.001 to 0.05 or all the way to 1.
Finding the time frame with the highest profit factor
Profit factor is defined as the gross profit a strategy makes across a defined period of time divided by its gross loss. You may choose to scroll through other time frames to find better models. You can select a different time frame from 1 min to 1H or all the way to 1M. Once you find the model you desire, you are encouraged to check that the model has a backtested profit factor of >3.5. You can then begin looking through the Performance Summary to find other detailed statistics.
Analysing the equity curve from the Amrullah Deep Liquidity (ADL) strategy
A green equity curve indicates that the trades are accumulating profits. A red equity curve indicates that the trades are accumulating losses. A healthy equity curve is one that is green and grows steadily to the right and upward direction.
Analysing the display arrows on the chart
Amrullah Deep Liquidity (ADL) tells you when to take a trade and how much to put in a trade. ADL can do this as the model identifies inventory risk in traders and market makers in the chosen market. On your Tradingview chart, ADL will display an arrow that tells you when to enter a trade. You can also see the amount to trade beside the arrow.
Opting for a trial
Yes you may opt for a trial which has limited availability.
The author's background and experience
My career in software and deep learning development spans across more than 5 years. At work, I lead a team to solve core computer vision tasks for large companies. I continually read all kinds of computer science books and papers, and follows progress on tools used in financial markets.
Hermes v1.0Hello
Today, I'm releasing Hermès my Eth Trading Script.
Hermès is a variation of my BTCUSDT Script Hadès.
It's looking for specific money/price patterns and compares the results with the "retails sentiment" then, the potential signals are filtered out with an advance/exclusive trend detector. ("Apóllôn" module).
Because this script is expected to be used with Bitmex, you should have a solid trading knowledge(money/Risk Management) .
On the last 4 Months:
* High Profits (~242% fees included)
* Extreme Accuracy (~92.86%)
* Very Low drawdown (-6%)
* About 4-5 Trades a month.
This indicator has been developed for BITMEX:ETHUSD /15Mins/Candles only.
As usual with my scripts:
- No repaint.
- Two Weeks of trial. (Minimum 1 Full trade/nothing to lose!)
Don't hesitate to claim your trial to check on its performance.
More information in my signature.(again don't hesitate to send me a message if you have questions)
Have a Good Day!

Crypto Ingenius Breakout w AlertsThis is a breakout strategy designed for crypto currency markets with alerts for buy and sell entries as well as buy and sell exits. It is designed primarily to work on 1 hour and 4 hour charts. Message me for a free 7-day trial and for pricing
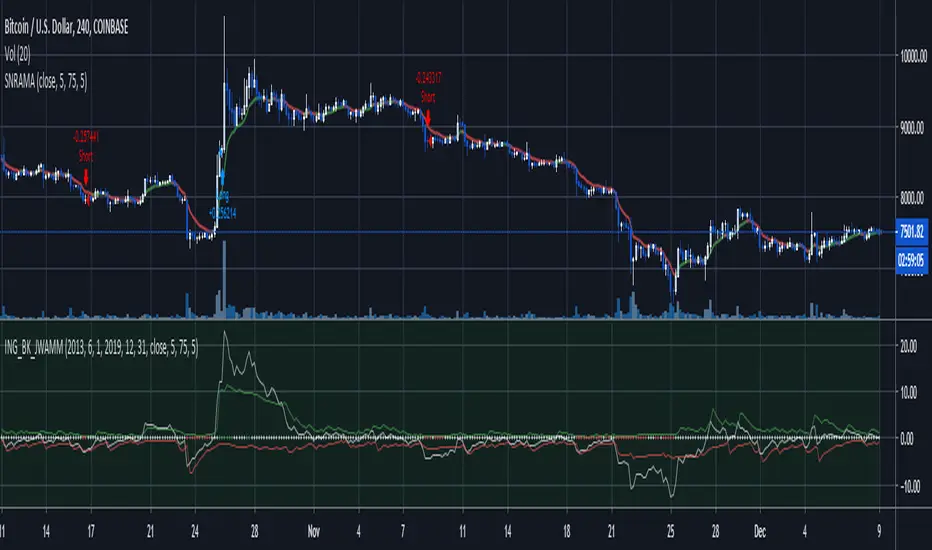
Pro CryptoSolver Strategy [Jwammo12]This is a pro strategy for trading crypto pairs. It trades both long and short and includes an adjustable stop loss.
Lowering the activity parameter increases the number of trades and is not bounded by zero.
Message me for a free 7-day trial and pricing for lifetime access.
