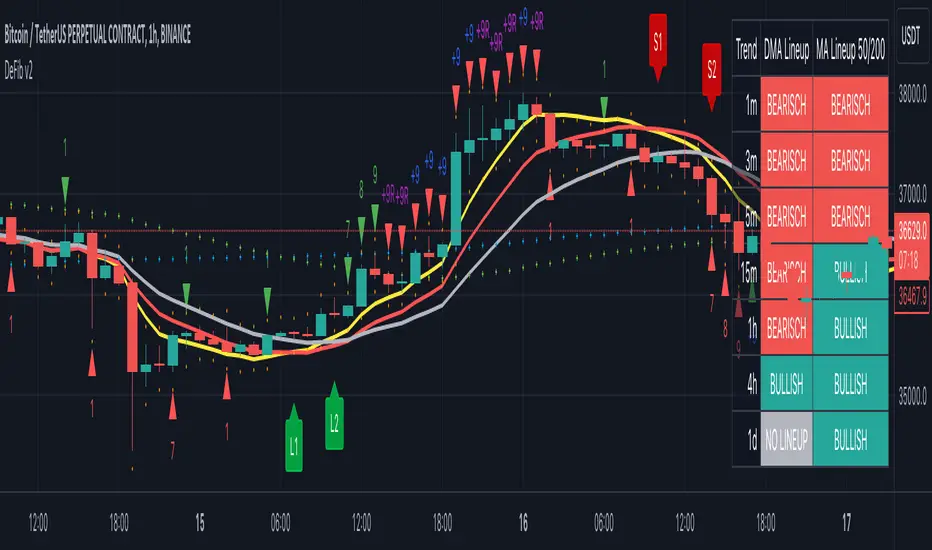
CryptoSignalScanner - DeFib v2 indicatorDESCRIPTION:
The DeFib indicator combines Moving Averages data points, Fibonacci sequence calculations and other methods to help traders make better decisions when it comes to entering and exiting trades at different time intervals. By analyzing these data points, the indicator provides valuable insights into the market trends and helps traders determine optimal moments to enter or exit a trade. Moving Averages helps smooth out price fluctuations over a specified period, providing a clearer picture of the overall market direction. The DeFib indicator uses a mix of these averages and Fibonacci methods to increase its chances of finding good trade opportunities. Whether analyzing short-term trends or longer-term patterns, this indicator assists traders in identifying favorable entry and exit points, thereby supporting more informed and strategic trading decisions.
By using Moving Averages data points based on the Fibonacci Sequence (+ some extra calculations we don't wish to share), we incorporate a unique perspective into the analysis. It helps to identify key levels of interest, potential trend reversals, and areas where price action may align with Fibonacci retracement levels. The Fibonacci Sequence is a mathematical sequence in which each number is the sum of the two preceding numbers (e.g., 0, 1, 1, 2, 3, 5, 8, 13, 21, and so on).
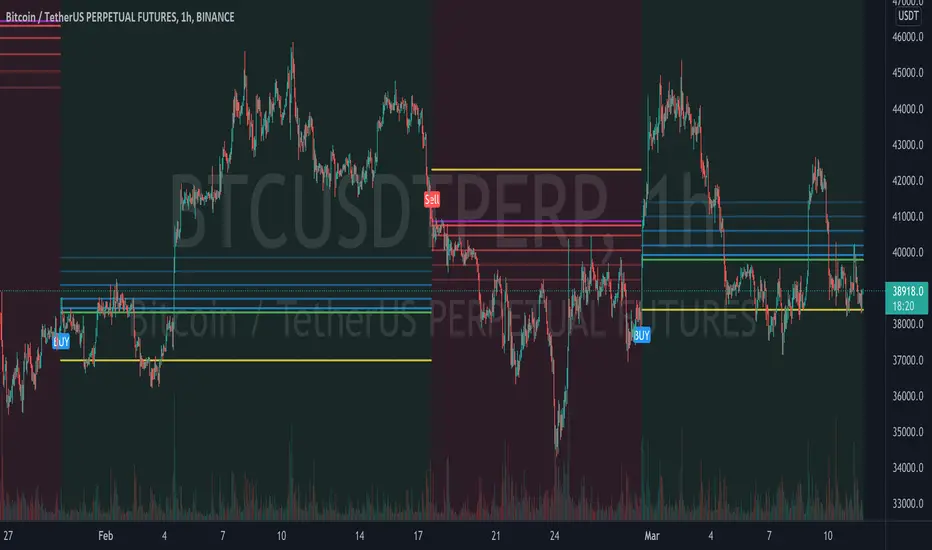
As a result of this information some L1, L2, S1 and S2 labels are printed on the chart. The labels are printed when a candle has been closed. Those labels are an indication when to enter or exit a trade. How to use those labels is described in the section "HOW TO USE" below.
This indicator is versatile and can be used on any timeframe, offering a wide range of features to support traders in their decision-making process. Here are some key aspects of this indicator:
User-Friendly:
Traders can easily customize all the settings according to their preferences, ensuring a personalized trading experience.
Long Signals:
The indicator provides both normal and strong long signals, which assist traders in identifying potential reversals in the market. These signals act as confirmation for traders to consider entering a long position.
Short Signals:
Similarly, the indicator offers normal and strong short signals, helping traders identify and confirm potential market reversals for short positions.
Fibonacci Sequence Calculation:
The calculation of the Long and Short labels is based on the Fibonacci Sequence, a mathematical pattern widely used in technical analysis. This adds a reliable and systematic approach to the indicator's signal generation.
Stop Loss:
When initiating a trade, it is our standard practice to implement a stop loss order based on the stop loss signal derived from the current or preceding candle. These stop loss signals are generated using the Average True Range (ATR) indicator.
Overlays:
The indicator includes overlays that visually represent market trends. These overlays identifying support and resistance levels, and providing valuable insights into the overall market behaviour.
Trend Table Box:
Traders can access a trend table box that displays the prevailing trend across different timeframes. This feature allows traders to assess the trend's strength and consistency. Additionally, users have the flexibility to adjust the timeframes based on their trading preferences.
Long/Short Alerts:
The indicator offers the functionality to add alerts for both long and short positions. Traders can set up notifications to be alerted when specific conditions are met, ensuring they stay informed even when they're not actively monitoring the charts.
Overall, this indicator provides traders with a comprehensive set of tools and features to enhance their trading decisions. Its user-friendly nature, combined with the inclusion of various signals, overlays, trend analysis, and alerts, enables traders to make informed choices and adapt to different market conditions effectively.
HOW TO USE:
This indicator incorporates specific signals that provide valuable insights into potential trend reversals in the market. Here's how each signal type is interpreted:
L1 (Long) Signal:
When an L1 signal appears, it suggests a potential uptrend reversal. Traders should pay attention to this signal as it indicates a possible shift from a downtrend to an uptrend. It serves as an early indication of a potential upward movement in prices. This is the fist point where we can take a long position. If we want to invest $100 into this trade we invest a maximum of $50 at this point. Don't forget to put a stop loss as described below in the "STOP LOSS" section.
L2 (Long) Signal:
An L2 signal acts as confirmation of the potential uptrend reversal identified by the L1 signal. When an L2 signal emerges, it strengthens the case for an upcoming uptrend. Traders may consider this signal as a stronger indication to support their decision to enter a long position. This is the point where we can invest another $50 if we already invested on the L1 signal. If we did not invested yet and we still see a clear reversal we enter the trade here with $100. Don't forget to put a stop loss as described below in the "STOP LOSS" section.
S1 (Short) Signal:
When an S1 signal is generated, it suggests a potential downtrend reversal. Traders should take note of this signal as it indicates a possible shift from an uptrend to a downtrend. It serves as an early indication of a potential downward movement in prices. This is the fist point where we can take a short position. If we want to invest $100 into this trade we invest a maximum of $50 at this point. Don't forget to put a stop loss as described below in the "STOP LOSS" section.
S2 (Short) Signal:
An S2 signal confirms the potential downtrend reversal identified by the S1 signal. When an S2 signal emerges, it reinforces the likelihood of an upcoming downtrend. Traders may consider this signal as a stronger indication to support their decision to enter a short position. This is the point where we can invest another $50 if we already invested on the S1 signal. If we did not invested yet and we still see a clear reversal we enter the trade here with $100. Don't forget to put a stop loss as described below in the "STOP LOSS" section.
These signals provide traders with a systematic framework to identify and evaluate potential reversals in market trends. By combining the information provided by both the L1 and L2 signals (for uptrends) or the S1 and S2 signals (for downtrends), traders can gain more confidence in their assessments of trend reversals. This indicator offers traders a valuable tool to capitalize on these reversal opportunities and make more informed trading decisions.
It is important to exercise caution and avoid blindly following the signals generated by the indicator. Instead, it is recommended to seek additional confirmations from other technical indicators such as the RSI (Relative Strength Index), MACD (Moving Average Convergence Divergence), or any other indicators that you are familiar with and trust.
While the signals provided by the indicator can be a useful starting point, relying solely on them may not always guarantee accurate predictions. By considering other technical indicators, traders can gain a more comprehensive view of the market conditions and validate the signals received from the indicator.
The RSI is a popular momentum oscillator that measures the speed and change of price movements. It helps traders identify overbought and oversold conditions, giving insights into potential trend reversals. The MACD, on the other hand, combines moving averages to provide signals for trend identification, as well as momentum and divergence analysis.
By utilizing these additional indicators or any others that you are familiar with, you can confirm the signals generated by the indicator under consideration. This approach enhances the reliability of your trading decisions by adding another layer of analysis and reducing the potential for false signals.
Each trader may have their preferred set of technical indicators based on their trading style and experience. It is important to select indicators that align with your trading strategy and complement the signals received from the indicator in question. This way, you can make more informed and well-rounded trading decisions, increasing the probability of successful trades and minimizing potential risks.
Stop Loss:
When initiating a trade, it is our standard practice to implement a stop loss order based on the stop loss signal derived from the current or preceding candle. These stop loss signals are generated using the Average True Range (ATR) indicator.
By employing a stop loss order, we aim to limit potential losses in case the trade moves against our anticipated direction. The stop loss signal, determined from the current or previous candle, provides a specific level at which the stop loss order is placed.
The Average True Range indicator is utilized to gauge the volatility of the market and determine an appropriate stop loss level. It takes into account the price range of the asset over a defined period, considering both high and low price points. By using the ATR, we can identify an optimal stop loss level that accounts for the asset's recent price fluctuations.
Implementing a stop loss based on the ATR-derived signal adds a layer of risk management to our trading strategy. It helps mitigate potential losses by automatically triggering the stop loss order if the price reaches or exceeds the predetermined level. This approach allows us to protect our capital and minimize the impact of adverse price movements.
It is important to note that the ATR-based stop loss signals should be used in conjunction with other analysis techniques and indicators. They serve as a dynamic reference point that considers market volatility, ensuring the stop loss level is adjusted accordingly.
By incorporating stop loss orders based on the stop loss signals derived from the current or previous candle using the ATR indicator, we aim to safeguard our trades and manage risk effectively. However, it is important to continually monitor and adjust the stop loss level as market conditions evolve, adhering to our risk management strategy throughout the duration of the trade.
Candlestick Sequence:
The Candlestick Sequence is a calculation used to identify potential trend reversal points in the financial markets. It consists of two main components, the Candlestick Sequence and the Candlestick Reversal. The Candlestick Sequence and Candlestick Reversal offer a structured way to identify potential reversals in the market.
WARNING:
• It is not advisable to engage in Leverage Trading unless you possess chart reading skills.
• It is not advisable to engage in Leverage Trading unless you are capable of interpreting technical indicators such as RSI, Moving Average, MACD, and others.
• It is crucial not to blindly follow trading signals without conducting your own analysis (DYOR - Do Your Own Research).
• Avoid succumbing to FOMO (Fear Of Missing Out) and impulsively entering trades. If you miss an entry point, it is important to let it go and patiently wait for the next potential entry point.
Leverage trading involves trading with borrowed funds, which amplifies both potential profits and losses. To participate in this form of trading, it is imperative to possess a certain level of expertise and knowledge. One key requirement is the ability to read and analyze charts effectively. Chart reading involves understanding various chart patterns, price movements, and support and resistance levels, among other factors. Without this skill, it can be challenging to make informed decisions and manage risk appropriately.
Additionally, leverage trading relies on technical indicators to identify potential trading opportunities and gauge market conditions. It is essential to have the ability to interpret indicators such as RSI, Moving Average, MACD, and others, as they provide valuable insights into market trends, momentum, and potential reversals. Ignoring or misunderstanding these indicators can lead to incorrect trading decisions and increased risk exposure.
Moreover, it is crucial not to blindly rely solely on trading signals, including those generated by indicators or other sources. While signals can be helpful, they should always be complemented by conducting one's own analysis. This entails conducting thorough research, considering multiple factors, and validating the signals with additional indicators or technical analysis techniques. This approach helps in making more informed and well-rounded trading decisions.
Finally, FOMO can be a detrimental emotion that drives impulsive and irrational trading behavior. It is important to avoid entering trades solely because of the fear of missing out on potential profits. If an entry point is missed, it is recommended to exercise patience and discipline by waiting for the next suitable opportunity. This approach helps to avoid unnecessary risks and maintain a more strategic and calculated trading approach.
By adhering to these warnings and taking the necessary precautions, traders can approach leverage trading more responsibly and increase their chances of success while mitigating potential losses.
REMARKS:
• It is important to emphasize that any information or content you encounter here is not intended as financial advice. We want to make it clear that we are not authorized or qualified to provide personalized investment advice. Our content, including ideas, opinions, views, predictions, forecasts, commentaries, suggestions, or stock picks, should be viewed strictly as informational, entertaining, or educational material.
• We emphasize that you should not construe the information provided here as personal investment advice or as a recommendation to take specific investment actions. It is crucial to conduct your own research, consider your individual financial circumstances, and consult with a qualified financial professional before making any investment decisions.
• While we aim to provide accurate and reliable information, we cannot guarantee the absence of errors or inaccuracies. Therefore, it is recommended to independently verify any information provided and exercise your own judgment when using it for decision-making purposes.
• Please be aware that any actions you take based on the information found here are done so at your own risk. We disclaim any liability for the consequences of your actions or decisions stemming from the information presented.
• Our intention is to provide helpful information that can contribute to your overall understanding and assist you in making better-informed decisions. However, it is essential to exercise caution, seek professional advice, and take responsibility for your investment choices.
Cheers & Good luck.
ETHUSDT
Crypto Uptrend Script + Pullback//Volume CandlesDescription: his is an adaption of my Pullback candle - This works on all timeframes and Markets (Forex//Stocks//)
Crypto Uptrend Script with Pullback Candle allows traders to get into a trend when the price is at end of a pullback and entering a balance phase in the market (works on all markets). The use of Moving averages to help identify a Trends and the use of Key levels to help traders be aware of where strong areas are in the market.
This script can work really well in Crypto Bull Runs when used on HTF and with confluences
The script has key support and resistance zones which are made up of quarterly data. Price reacts to these areas but patience is required as price will take time to come into these areas
I have updated the Pullback Candle with the use of Volume to filter out the weak Pullback Candles -
There are new candles to the script.
The First candle is the Bullish Volume Candle - This candle is set to a multiplier of 2x with a crossover of 50/100 on Volume - this then will paint a purple candle.
Uses of the Bullish Volume Candle:
Breakthrough of key areas // special chart patterns
Rejection of key areas
End of a impulse wave (Profit Takers)
The second candle is a Hammer - I prefer using the Hammers on Higher Timeframes however they do work on all timeframes. .
The third candle is a Exhaustion of impulse downward move.
Uses of this candle - can denote a new trend but has to be with confluence to a demand area // support area or with any use of technical analysis - using this alone is not advised
The fourth candle is a indecision candle in the shape of a Doji - this candle can help identify if the trend is in a continuation or a reversal
This script can work really well in Crypto Bull Runs
Disclaimer: There will be Pullbacks with High Volume (Breakouts) and not go the way as intended but this script is to allow traders to get into trends at good price levels. The script can paint signals in areas where price is too expensive so please do your own due diligence on the markets as this script is to help get into good areas of price
Please leave a thumbs up if you like this script and message me for information on how to use the script.

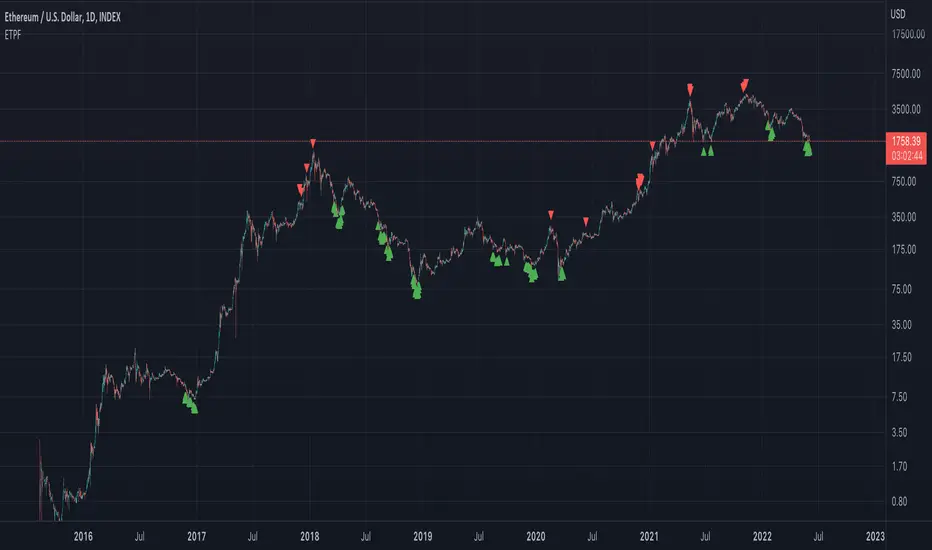
Exponential Top and Bottom FinderThis is an indicator to identify possible tops and bottoms after exponential price surges and drops, it works best on ETH 1D, but you can also use it for bitcoin and altcoins.
It's based on stochastic first and second derivatives of a close moving average
customConfluenceSimplifiedThis indicator is intended to automatically search for confluence on a variety of indicators and conditions, highly customizable parameters, including Take profits, stop losses and classic indicator adjustments.
Best results in BTCUSDT 15m and 1H, but feel free to optimize it on any pair and timeframe. I don't recommend using it in non crypto assets.
Alerts are fully customizable too. You can put any alert() (buy/sell) to any pair.
I intended to maximize quality of signals over quantity. But anyway you can customize a lot of parameters to make it more frequent.
DM me for access.
Saper Aude [Alerts]Sapere Aude Strategy - Alerts
Trend based scalping strategy, to work on lower timeframes (15Minute - 1 Hour)
Calculations on ATR, strategy uses extra conditions to help filter out bad trades.
How to use the Indicator?
Simple as when green line shows below, that can be either a good entry point or a signal to start building limit orders on the plot.
I use the ATR as a trailing stop loss for exit.
vica versa for entering shorts. The strategy is only set up to take long positions though.
This is a great scalping strategy for bots in Ranging or up trending markets.
This scripts has 5 variations built within it which are fitted for certain coins & their timeframes
The coins included are
BTC /USDT 1 Hour
ETH/USDT 1 Hour
ADA/USDT 30 Minutes
DOGE/USDT 15 Minutes
LUNA/USDT/15 Minutes
You should find the preset alerts for these when you click "Add aler" on this indicator
You will see in the settings what default Stop losses I used
The script is written in Version 4
The strategy performs best on the Binance listings

Order Blocks V2 [MensaTrader]Lines are Strong Support and resistance , Used to help find buy/sell or take profit zones.
When the lines turn green, these prices are suggest good limit entry prices for longs and shorts.
Default settings are left for scalping on short timeframes
Please note that this is experimental and far from perfect. feel free to play about with the variables in the settings.
feel free to comment any suggestions I hope to update this in the near future
The script is written in version 4

Carpe Diem [Alerts]Carpe Diem Alerts, a wave cycle strategy that only enters when markets are up trending.
The script uses 3 different trend detection indicators including volume which helps with confirmation.
This script has 10 variations built within it which are fitted for the coins differnt coinditions
Alertconditions for longs and long Exits are added for these coins
The coins included are
BTC /USDT 4H
ETH/USDT 4H
LTC/USDT 4H
ADA/USDT 4H
BNB/USDT 2H
BAND/USDT 4H
BAT/USDT 3H
OGN/USDT 4H
ZIL/USDT 4H
BZRX/USDT 2H
How to use the Indicator
You can change what plots are shown in the settings Cog
When the wave lines are green, the market is up trending and will be looking for a trade whereas when they are red, the market is in a sideways or downtrend.
The buy signal is given by the fast wave either crossing over the slow wave line, or crossing over the value of 25.
The exit signal is when the wave crosses back under the 75 value
There is NO Repaint. The script is written in version 4
This strategy performs best on the Binance listings

OracleWhere to use?
Oracle gives the best performance on ETH/USD but also works for BTC/USD and some other charts like XAU/USD ( Gold ). Fails for almost all other cryptocurrencies.
Use 1d or 4h time frames only. 2h and 3h also work in some cases. Use Heikin Ashi candles for the best results.
The strategy is still being tested. Use at your own risk.
How to use?
Arrows start pointing upwards and candle closes above the Orange line - Price is likely to go up
Arrows start pointing downwards and candle closes below the Orange line - Price is likely to go down
Also, the orange line can be used as a mental stop loss point.

Pivot Point Reversal + RSI AlertsThese are alerts for previously published strategy:
This strategy joins the Pivot Reversal strategy with the RSI indicator.
We check RSI level at the pivot point level and only if RSI condition is satisfied we update levels for stop orders.

Welles Wilder MAHow to trade:
Recommended for longer timeframes at least 4H.
Buy when the green dot appears.
Sell when the yellow dot appears.
Welles Wilder moving average by XOOOOOO

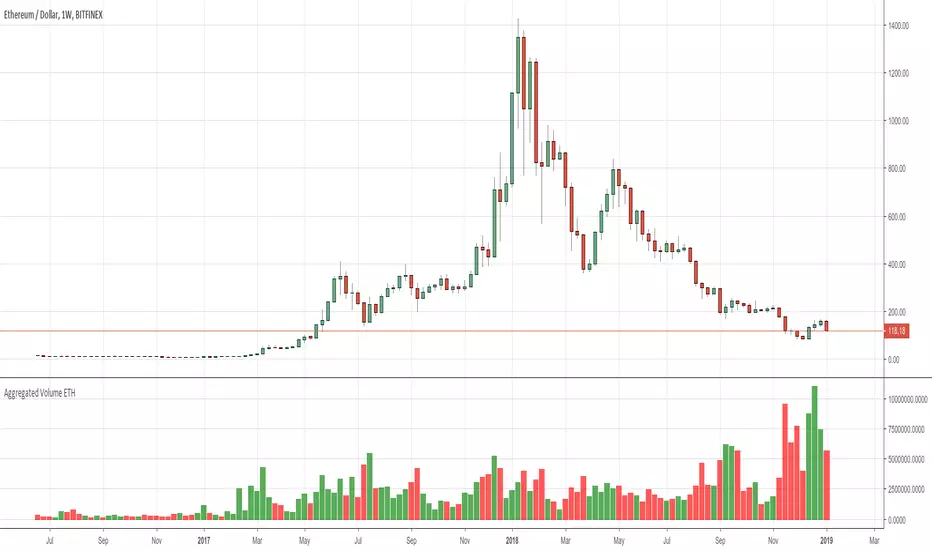
ETH HawkEye Aggregated Volume IndicatorThis is combined Aggregated ETH Exchange Volume by Neobutane with HawkEye volume clone indicator by LazyBear.
Indicator includes aggregated raw ETH volume from 7 user selectable fiat and tether exchanges on USD, USDT, BTC, EUR, GBP, JPY pairs + Exponential MA + hawkeye bar coloring where: green is bullish volume , red - bearish and white - volume neutral to the market:
Bitfinex
Coinbase
Bitstamp
Kraken
Binance
Poloniex
Bittrex
*There is a TV bug that doesn't display a whole volume history if some pair was added later than date intended to be analysed by operator eg, if you want to watch older data you should exclude all secondary pairs that were added later and switch off "newer" exchanges like Binance.

Aggregated Volume ETHAggregates the ETH/fiat volume from multiple exchanges into a single indicator.
# Exchanges and Pairs
Included are only exchanges supported by TradingView:
* Binance
* Bitstamp
* Bittrex
* Coinbase
* Gemini
* itBit
* Bitfinex
* Kraken
* Poloniex
* BitMEX
Excluded low volume exchanges (not in CMC Top):
* CEX . IO
* Coinfloor
Excluded exchange due to volume calculation by TV:
* HitBTC
Many other top exchanges are not included, because they are not supported by TradingView.
# Inputs
By default the spot exchanges are selected. You can select also the other margin trading and derivatives exchanges.
# Contribute
Feel free to share any ideas and issues you have.
# Open Source
The code is open source @ github.com and uses the commonpine library github.com