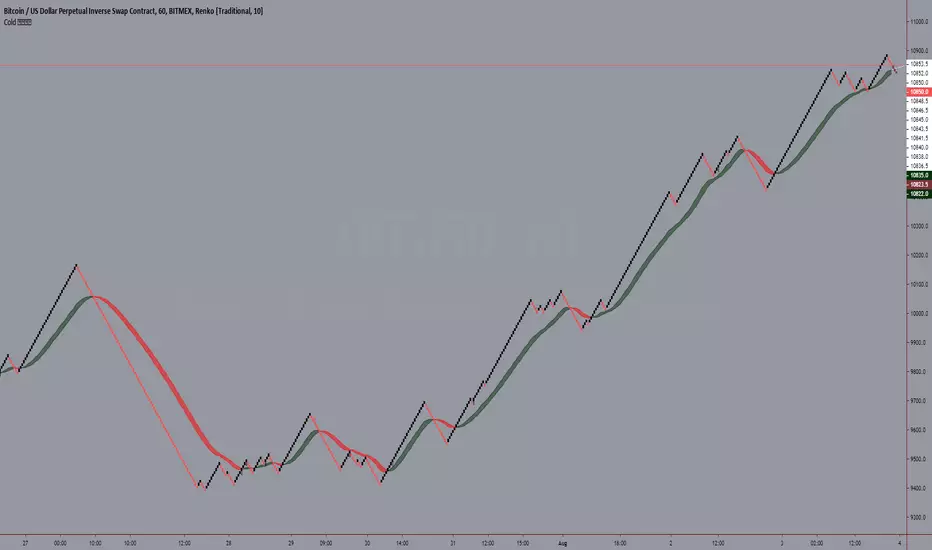
Cold 𝕃𝔼𝔾𝕆MA Ribbon
An Attempt For Smoother trend
Optional next candle forecaster for ma and its signal
Optional MA from coloring experimentation
Experimental
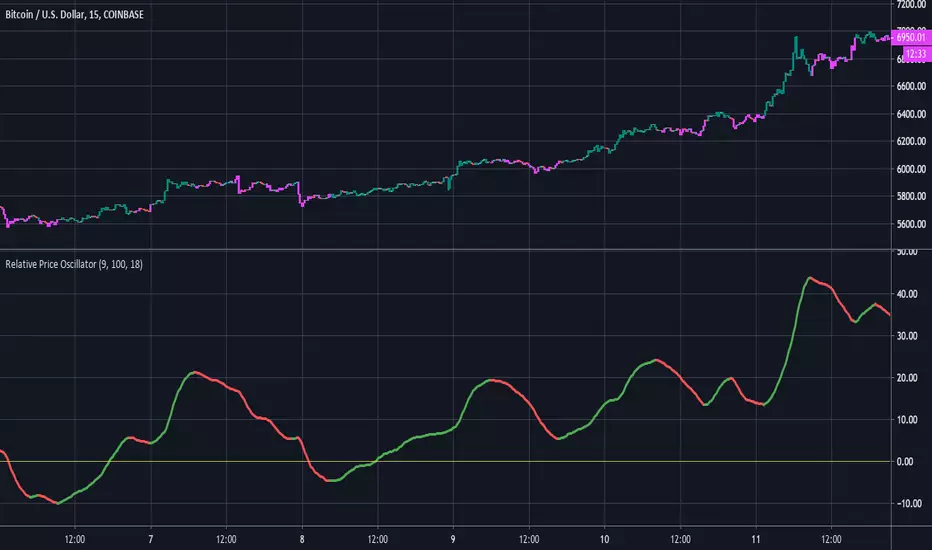
Relative Price OscillatorHere is a new experimental indicator we've been working on. The idea was to compare two EMA's of period midpoints to the actual closing price. The steps that were taken are listed below:
1.Calculate an EMA based on each period's midpoint ((High * Low) /2) for the last 9 periods.
2.Calculate an EMA based on each period's midpoint for the last 100 periods.
3. Divide the difference of the two EMA's by the closing price. ((EMA1 - EMA2) / Close).
4. Smooth the value from step #3 with an 18 period EMA. Multiply by 1000 for better scaling/visibility.
Using:
Bullish when line is green, bearish when line is red. Buy on first green, then sell on first red.
There is also an option to color the candles based on the RPO line.
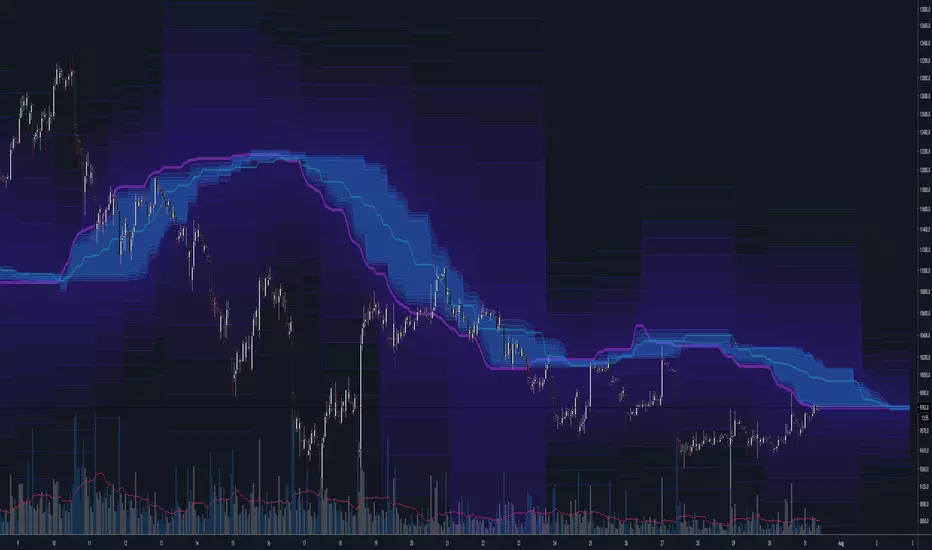
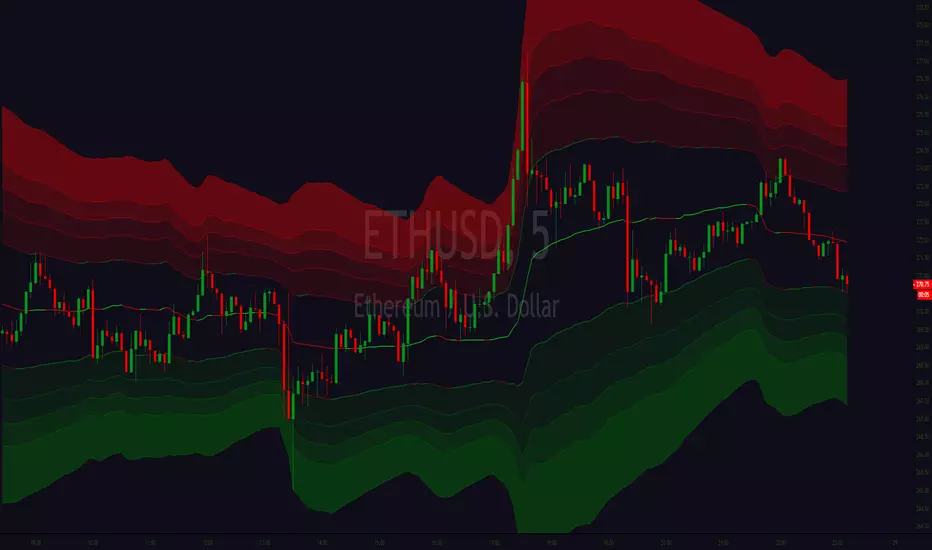
The Rumpy CloudSimilar basic principle to Ichimoku cloud, more sophisticated implementation.
I've exposed cloud width multipliers in the setting in case anyone wants to experiment with them, there are likely to be other widths of significance.
Lots of lines so settings includes easy batch way of altering color settings.
--------------------------------------
If you find it useful please consider a tip/donation :
BTC - 3BMEXEDyWJ58eXUEALYPadbn1wwWKmf6sA
--------------------------------------

Adaptive BB Triple Layer Adaptive BB SD
Band based pullback and pivoting signals ♘♝
Macro Trend sentiment - Outer deviations coloring
Micro trend - Mean Value and normal +/- st.dev colors
Candle Colors - Median Trend
Col Coded Primitive(Basic) Squeeze detection
Sensitive micro break out/down signals derived from basic Mean line crossing (Added some Whipsaw Protection)
Basic Squeeze
Extreme deviations can be turned off for "compact" view
Basic break out/down signals
Indicator needs TESTING
Signal sensitivity and trend recognition need testing/tuning before even considering to use this BB for trading purposes

CrayonsCrayons Grayons
Derived from -
Its messy and experimental until stable version is released , now for testing purposes only
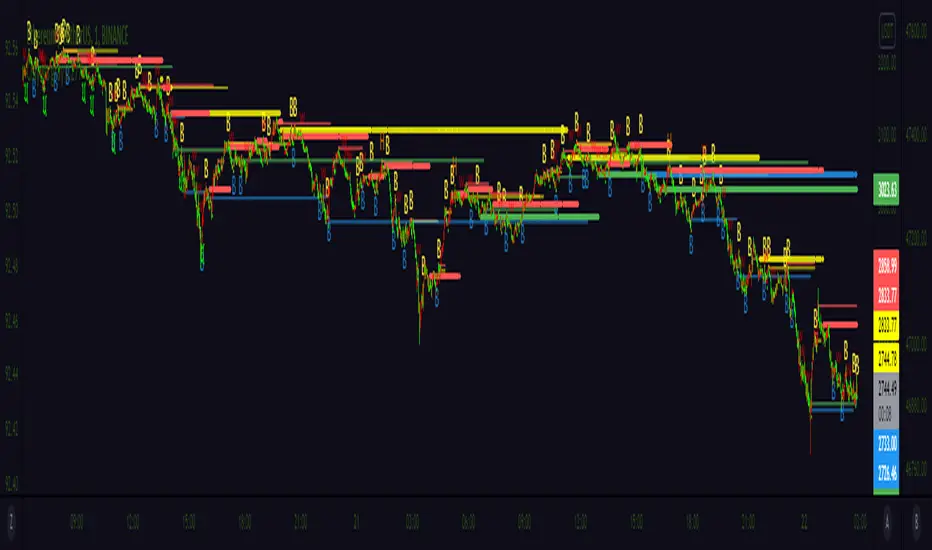
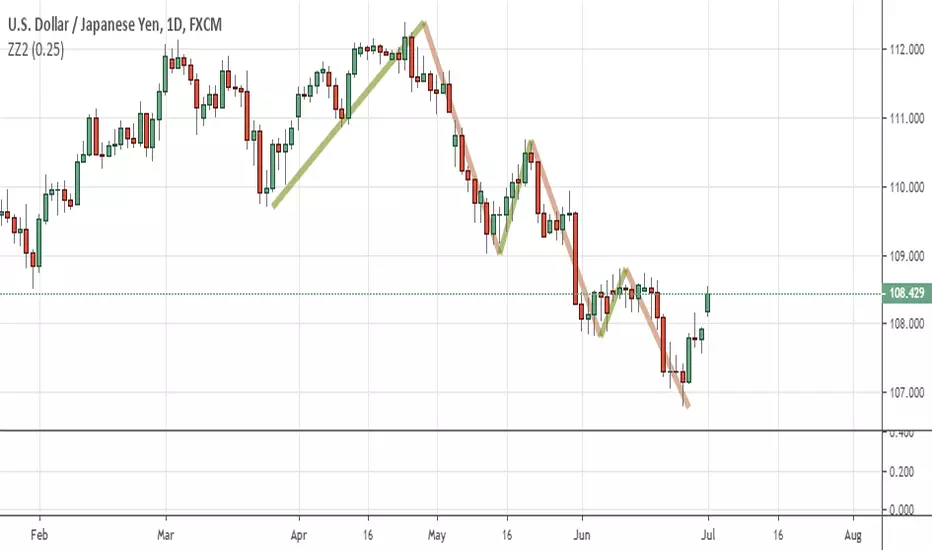
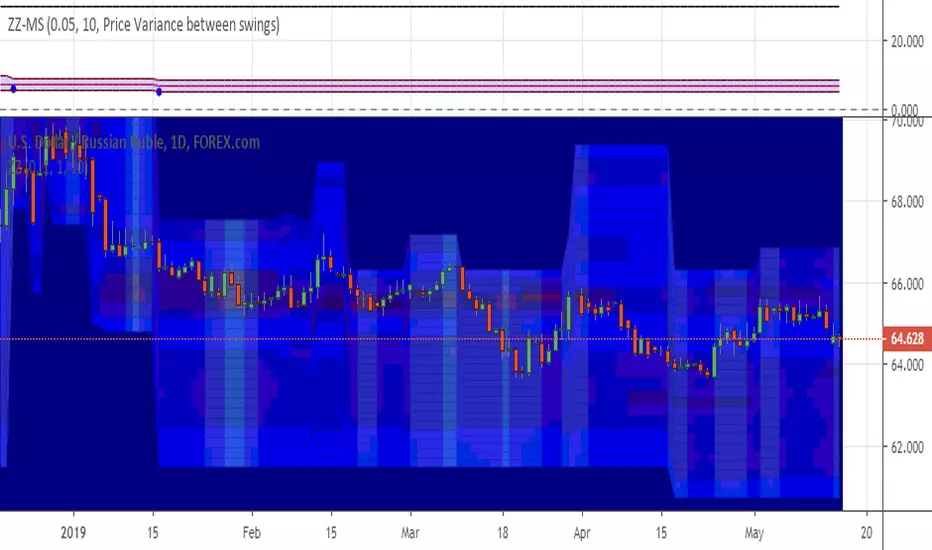
[RS]ZigZag Percent Reversal(Multiple) - Forecast Areasnaive level forecasting of multiple zigzag's
based on this principle:
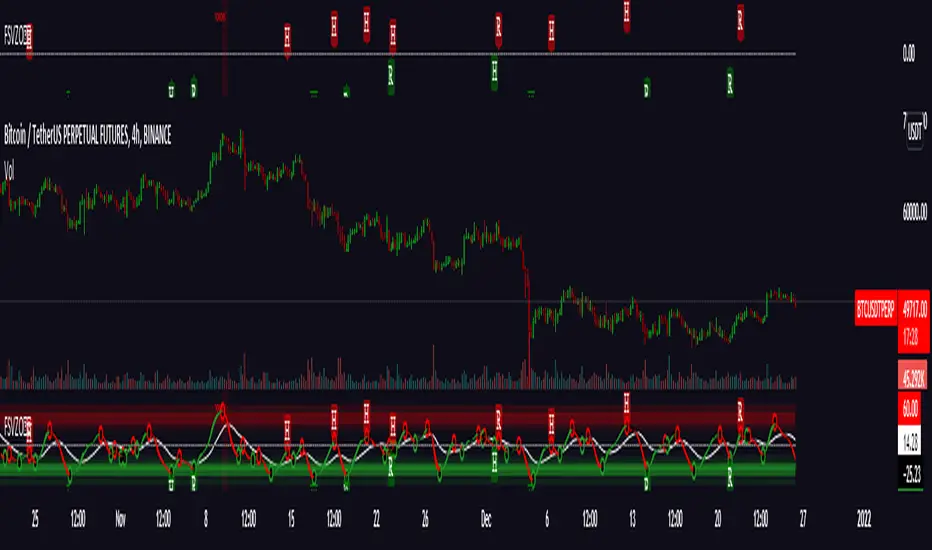
Regularized Volume Zone Oscillator FSVZORegularized VZO
Vanilla in link below
White noise and 1 confirm auto divs included
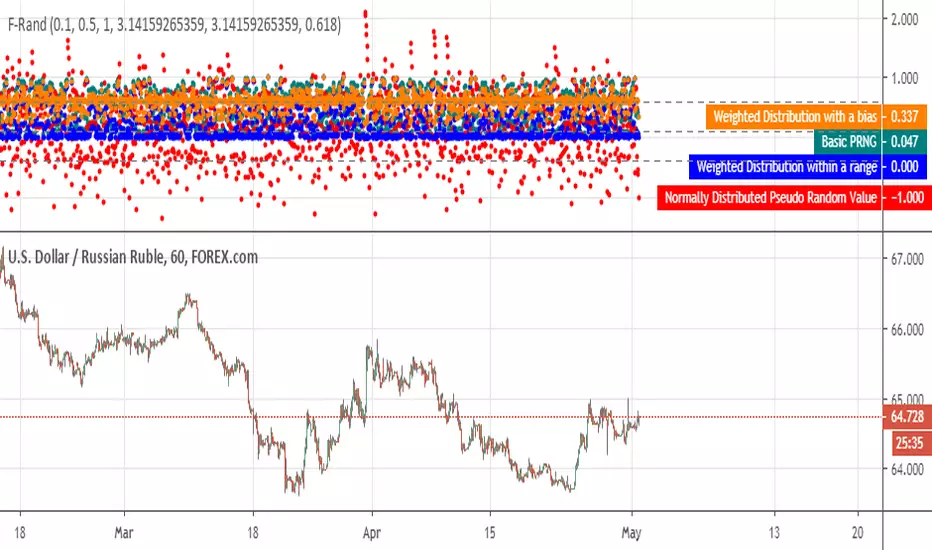
[RS]Function - Normaly Distributed Pseudo Random GeneratorEXPERIMENTAL:
Function to generate a normally distributed pseudo random value.
if you find that something doesn't add up, please leave a message bellow.

GuppyAdded over 20 ma types to experiment with ,while avoiding the traditional list and keeping compiling time adequate.
Its purely experimental ,published spontaneously for friend use and not as trading indicator.

Zero Phase Filtering [Repaint] - ExperimentalImportant !
The indicator is for experimental purpose only, it must not be used as a decisional tool but only as a visual one (like Zig-Zag, Fractal etc). The information this indicator display is uncertain and subject to drastic changes over time. If you have further question feel free to pm me.
Introduction
Most of the filters you will find are causal, this mean that they depend on present and past input values, this explain the lag they produce. Non causal filters however will use future input values. A well know way to get a zero-phase filter is by using the forward backward method, but this is not possible in pinescript as i recall. So we have to use some kind of function that will display future values, this is possible using the security function in version 2 or the one in version 3 using barmerge.lookahead_on .
The Use Of A Repainting Indicator
Its always better to filter data in order to have a clearer view of what is happening, this can be useful when doing some forecasting or doing less formal kind of analysis. However since it repaint you cant use it as a signal provider or use signals of other indicators using this filter as source.
For example if you want to forecast a smooth indicator, the forecast of this indicator under normal circumstances could still have lag associated with it, so you would have to react before your forecast, this wont happen if you apply this filter as your indicator source.
The Filter
We smooth with a simple moving average the price provided by the security function twice, length control the smoothing level. Since security depend on the time frame you are in you must select your time frame in the indicator parameter selection window.
Filtering using 45 minutes time frame close price in a 5 minutes chart, we fix this by selecting our time frame.
Consider the fact that the input of the indicator is just periodic price, so sometimes the lag can sometimes be less or more than 0 and the estimation not centered.
The indicator can work on time frames up to 1h, after that the filter have some lag, i tried fixing this and i ended up having data errors.
Applying our filter as source for the rsi oscillator.
Conclusion
It is possible to have a kind of zero-phase filters, but it would be better if pinescript could support backward indexing thus making us able to do forward backward filtering.
Since noise can affect our analysis, applying smoothing without having to use offset in plot can be considered useful.

Momentum Oscillator Momentum Oscillator
Concept for this leading indicator presented in IFTA by By M.Fawzy.
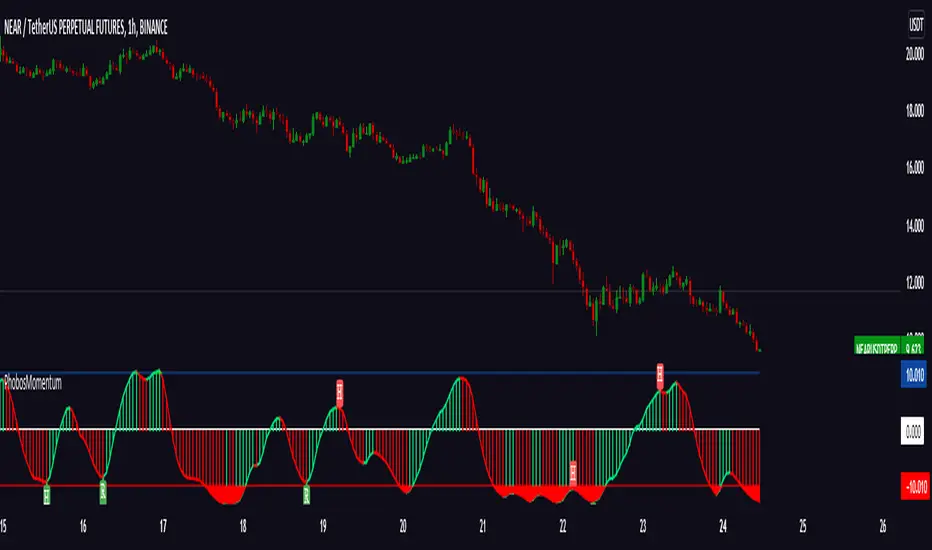
Momentum SkiiesMomentum Oscillator derived from RSI.
Indicator concept for now have simple visualization of momentum slopes and decay,experimental divergences, horizontal bands for overbought/oversold conditions.
By leaving/touching horizontal band or stimulated by divergence, oscillator show enough generated momentum to help capture multiple moves in a row.
Will be updated
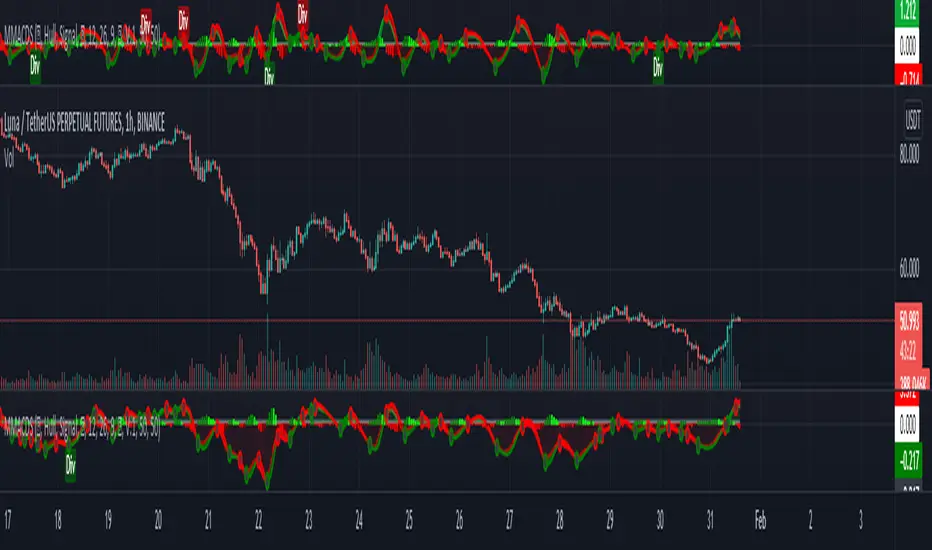
Improved MACDImproved MACD with 12 filter to chose from including sine wave , zero lag, hull ,regression and similar . Designed for better and smoother signal generation and flexibility
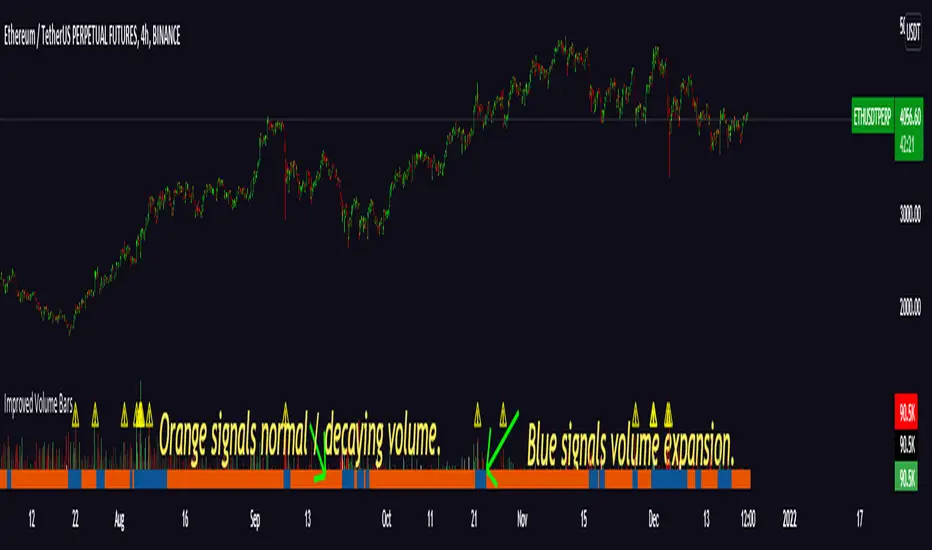
Improved Volume Bars IVB"IVB" is an attempt to improve volume analyze using classical volume bars , focusing on market cycle phase recognition and noticing cycle onset/peak points
V.01
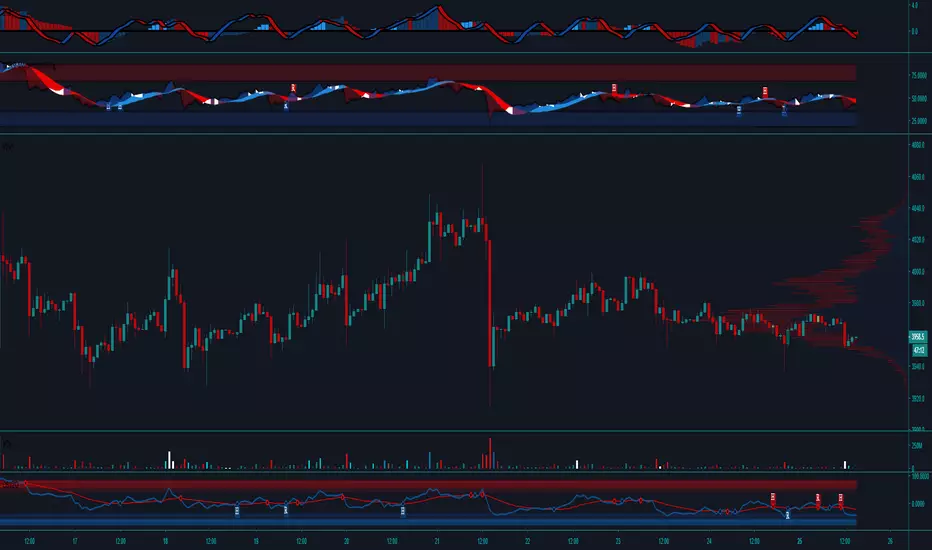
Janus ƩRSI An overhaul to classical RSI
First version have 12 lag types to chose from, extreme conditions are highlighted with horizontal bands to be more intuitive.
Dynamics and signals vastly depend on filter used.
Main signals for current modes variate from self explanatory oscillators color change while moving out of extreme condition zone (overbought/oversold) to a brownish tint forming on impulse edges and representing S/R
Previous version hosted in tradingview bellow

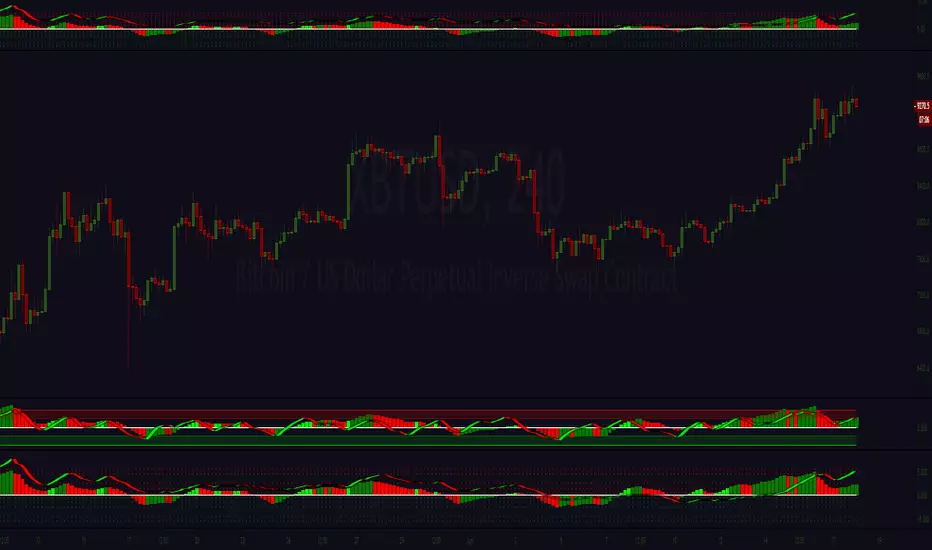
Volume Zone OscillatorOscillator is build on Walid Khalil's and David Steckler's concept for leading volume oscillator
All indicators core's dynamics is fully explained it two articles bellow , written by concepts fathers
Stocks & Commodities V. 29:5 (16-23, 28): In The Volume Zone by Walid Khalil and David Steckler
edmond.mires.co/GES816/14-In%20The%20Volume%20Zone.pdf
2008-IFTA journal-Volume Zone Oscillator (VZO) ~by Waleed Aly Khalil
capitalsynergy.com/resources/IFTA09VZO.pdf
//
Extreme conditions are visually intuitive
Momentum shift alerts
Candle printer for H/R Divergence pockets and confirmed divergences
Ehlers white noise indicator "branch" have wonderful confluences with VZO so its included as optional feature, its toggle button and settings are market with ⚠️to remind that its still heavily experimental
Every visual object group in script can be turned off separately from each other for customization freedom
V0.5

Self-Weighted Moving AverageThis type of moving average was originally developed by Alex Orekhov at his home. This WMA uses previous prices as weights for the new ones. At the moment, this is a highly experimental approach, so don't use it in real trading.
The weighting scheme is presented on the chart.

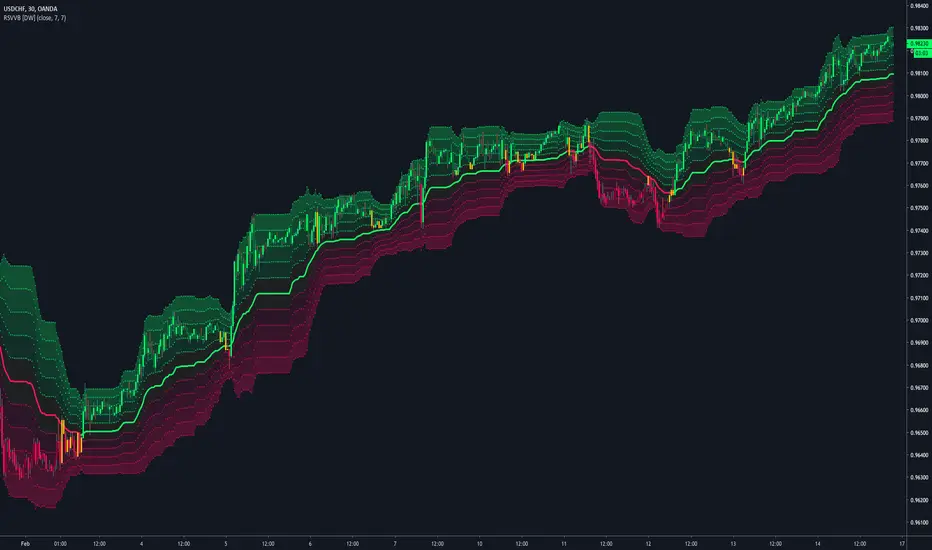
Relative Strength Volatility Variable Bands [DW]This is an experimental adaptive trend following study inspired by Giorgos Siligardos's Reverse Engineering RSI and Tushar S. Chande's Variable Moving Average.
In this study, reverse engineered RSI levels are calculated and used to generate a volatility index for VMA calculation.
First, price levels are calculated for when RSI will equal 70 and 30. The difference between the levels is taken and normalized to create the volatility index.
Next, an initial VMA is calculated using the created volatility index. The moving average is an exponential calculation that adjusts the sampling length as volatility changes.
Then, upper and lower VMAs are calculated by taking a VMA of prices above and below the initial VMA. The midline is produced by taking the median of the upper and lower VMAs.
Lastly, the band levels are calculated by multiplying the distance from the midline to the upper and lower VMAs by 1, 2, 3, 4, and 5.
Bar colors are included. They're based on the midline trend and price action relative to the upper and lower VMAs.