EMA Buy/Sell & Smart Zones(5Min TF only)### **Indicator Title:**
**EMA Buy/Sell & Smart Zones**
---
### **Description:**
**EMA Buy/Sell & Smart Zones** is a specialized intraday trading tool designed to combine trend analysis with precise market structure zones. This script utilizes a custom tracking algorithm to identify the **specific candle** that formed the previous session's high or low, allowing it to plot accurate Supply and Demand zones for the current trading day.
This indicator has been rigorously tested on the **Nifty Index** and is optimized for use on the **5-minute timeframe**.
### **Key Features**
**1. Smart Session Wick Zones ("True Wick" Logic)**
The indicator automatically scans every candle of the previous session to locate the exact price action that formed the day's extremes.
* **Smart High Zone:** Identifies the specific candle that made yesterday's High and plots a zone from that High down to that candle's Open or Close (based on body direction).
* **Smart Low Zone:** Identifies the specific candle that made yesterday's Low and plots a zone from that Low up to that candle's Open or Close.
* **Close Range:** Highlights the High-Low range of the very last candle of the previous session to show the closing sentiment.
*All zones automatically stop extending at the end of the current session, ensuring the chart remains clean and historically accurate.*
**2. EMA Trend System**
The script plots three key Exponential Moving Averages to define market direction:
* **EMA 21:** Captures short-term momentum.
* **EMA 63:** Defines the medium-term trend.
* **EMA 1575:** Establishes the long-term baseline.
**3. Buy/Sell Signals**
Clear signals are generated on the chart based on specific criteria:
* **BUY Signal:** Generated when a green candle closes above the EMA 21 and EMA 63.
* **SELL Signal:** Generated when a red candle closes below the EMA 21 and EMA 63.
* *Note: The logic includes a filter to alternate signals (Buy -> Sell -> Buy), preventing clutter during choppy markets.*
### **How to Use**
* **Recommended Timeframe:** **5 Minutes**.
* **Recommended Markets:** Indices (Nifty, Bank Nifty) and high-volume stocks.
* **Workflow:**
* Use the **Smart Zones** (Red/Green boxes) to identify potential rejection areas or breakout targets.
* Use the **Buy/Sell Labels** as confirmation triggers when price is reacting near these zones or trending strongly above/below the EMAs.
### **Settings & Customization**
* **Visibility Control:** Toggle each box type (High, Low, Close) and text labels on or off individually.
* **Color Customization:** Fully adjustable colors for all EMAs, Zone Backgrounds, Borders, and Text Labels to suit your chart theme.
* **Label Size:** Adjust the text size of the zone labels directly from the settings menu.
---
**Disclaimer:** This tool is for educational purposes and should be used to assist your analysis. Always manage your risk appropriately.
Fakeout

Spring & Upthrust Trap (Zeiierman)█ Overview
Spring & Upthrust Trap (Zeiierman) is a Wyckoff-style “range sweep” indicator that highlights liquidity traps using a simple ZigZag pivot structure. It’s designed to catch the moment price briefly breaks a range boundary to trigger stops, then quickly snaps back into the range (rejection).
⚪ What It Detects
A Spring (Bull) is a downside fakeout. Price sweeps below the range boundary (taking liquidity), then rejects and returns back above the opposite boundary. In other words, it looks bearish for a moment, then flips bullish as the sweep fails.
An Upthrust (Bear) is the upside version. Price sweeps above the range boundary, then rejects and falls back through the opposite boundary. It looks bullish briefly, then flips bearish when that breakout fails.
█ How It Works
⚪ 1) Pivot Extraction (ZigZag Structure)
The script first compresses price into a small set of swing pivots using a ZigZag-style method driven by ZigZag Length. A bar becomes a pivot when it is the highest/lowest point inside the lookback window.
⚪ 2) Pattern Framing (X → A → B → C)
When there are at least four pivots available, the script maps the most recent pivot sequence into four labeled points:
X and A define the range boundaries (the box height is based on |A − X|)
B is the sweep pivot (the “fakeout” that breaks a boundary)
C is the rejection/snapback pivot that confirms the sweep failed
This is the minimum structure needed to define a trap without overfitting.
⚪ 3) Sweep Sizing (Filtering Noise vs Real Sweeps)
Not all boundary breaks are meaningful. The script measures sweep magnitude relative to the range size:
Sweep Fraction: |B − X| / |A − X|
This does two things:
Filters tiny pokes through a boundary (often random noise)
Filters extremely large breaks that are more likely to be true trend continuation rather than a trap
This is controlled by:
Min Sweep (minimum required violation)
Max Sweep (maximum allowed violation)
⚪ 4) Spring vs Upthrust Logic (Directional Trap Detection)
The script then decides which trap is forming:
Spring (Bull)
A downside sweep that fails: price breaks below the boundary, then returns strongly back through the opposite side.
Upthrust (Bear)
An upside sweep that fails: price breaks above the boundary, then returns strongly back through the opposite side.
█ How to Use
⚪ Interpreting a Spring (Bull)
A Spring is best treated as a failed breakdown. The sweep suggests stops were taken under the range, but the snapback implies that the market rejected lower prices.
Common behaviors after a good Spring:
fast reclaim back into the range
retest of the boundary from above (acceptance test)
continuation away from the sweep area if buyers remain in control
⚪ Interpreting an Upthrust (Bear)
An Upthrust is a failed breakout. Stops get taken above the range, but the price cannot hold outside and collapses back into/through the structure.
Common behaviors after a good Upthrust:
rejection wick and rapid return
retest of the boundary from below
continuation downward if sellers remain in control
█ Settings
ZigZag Length – pivot sensitivity. Higher = smoother, fewer signals. Lower = more pivots, more traps.
Show Patterns – detect Springs only, Upthrusts only, or both.
Min Sweep – minimum sweep size relative to range height (filters micro sweeps).
Max Sweep – maximum sweep size relative to range height (filters “real breaks”).
Confirm Pad – extra snapback requirement beyond the boundary (adds confirmation).
-----------------
Disclaimer
The content provided in my scripts, indicators, ideas, algorithms, and systems is for educational and informational purposes only. It does not constitute financial advice, investment recommendations, or a solicitation to buy or sell any financial instruments. I will not accept liability for any loss or damage, including without limitation any loss of profit, which may arise directly or indirectly from the use of or reliance on such information.
All investments involve risk, and the past performance of a security, industry, sector, market, financial product, trading strategy, backtest, or individual's trading does not guarantee future results or returns. Investors are fully responsible for any investment decisions they make. Such decisions should be based solely on an evaluation of their financial circumstances, investment objectives, risk tolerance, and liquidity needs.

Session Open Range, Breakout & Trap Framework - TrendPredator OBSession Open Range, Breakout & Trap Framework — TrendPredator Open Box
Stacey Burke’s trading approach combines concepts from George Douglas Taylor, Tony Crabel, Steve Mauro, and Robert Schabacker. His framework focuses on reading price behaviour across daily templates and identifying how markets move through recurring cycles of expansion, contraction, and reversal. While effective, much of this analysis requires real-time interpretation of session-based behaviour, which can be demanding for traders working on lower intraday timeframes.
The TrendPredator indicators formalize parts of this methodology by introducing mechanical rules for multi-timeframe bias tracking and session structure analysis. They aim to present the key elements of the system—bias, breakouts, fakeouts, and range behaviour—in a consistent and objective way that reduces discretionary interpretation.
The Open Box indicator focuses specifically on the opening behaviour of major trading sessions. It builds on principles found in classical Open Range Breakout (ORB) techniques described by Tony Crabel, where a defined time window around the session open forms a structural reference range. Price behaviour relative to this range—breaking out, failing back inside, or expanding—can highlight developing session bias, potential trap formation, and directional conviction.
This indicator applies these concepts throughout the major equity sessions. It automatically maps the session’s initial range (“Open Box”) and tracks how price interacts with it as liquidity and volatility increase. It also incorporates related structural references such as:
* the first-hour high and low of the futures session
* the exact session open level
* an anchored VWAP starting at the session open
* automated expansion levels projected from the Open Box
In combination, these components provide a unified view of early session activity, including breakout attempts, fakeouts, VWAP reactions, and liquidity targeting. The Open Box offers a structured lens for observing how price transitions through the major sessions (Asia → London → New York) and how these behaviours relate to higher-timeframe bias defined in the broader TrendPredator framework.
Core Features
Open Box (Session Structure)
The indicator defines an initial session range beginning at the selected session open. This “Open Box” represents a fixed time window—commonly the first 30 minutes, or any user-defined duration—that serves as a structural reference for analysing early session behaviour.
The range highlights whether price remains inside the box, breaks out, or rejects the boundaries, providing a consistent foundation for interpreting early directional tendencies and recognising breakout, continuation, or fakeout characteristics.
How it works:
* At the session open, the indicator calculates the high and low over the specified time window.
* This range is plotted as the initial structure of the session.
* Price behaviour at the boundaries can illustrate emerging bias or potential trap formation.
* An optional secondary range (e.g., 15-minute high/low) can be enabled to capture early volatility with additional precision.
Inputs / Options:
* Session specifications (Tokyo, London, New York)
* Open Box start and end times (e.g., equity open + first 30 minutes, or any custom length)
* Open Box colour and label settings
* Formatting options for Open Box high and low lines
* Optional secondary range per session (e.g., 15-minute high/low)
* Forward extension of Open Box high/low lines
* Number of historic Open Boxes to display
Session VWAPs
The indicator plots VWAPs for each major trading session—Asia, London, and New York—anchored to their respective session opens. These session-specific VWAPs assist in tracking how value develops through the day and how price interacts with session-based volume distributions.
How it works:
* At each session open, a VWAP is anchored to the open price.
* The VWAP updates throughout the session as new volume and price data arrive.
* Deviations above or below the VWAP may indicate balance, imbalance, or directional control.
* Viewed together, session VWAPs help identify transitions in value across sessions.
Inputs / Options:
* Enable or disable VWAP per session
* Adjustable anchor and end times (optionally to end of day)
* Line styling and label settings
* Number of historic VWAPs to draw
First Hour High/Low Extensions
The indicator marks the high and low formed during the first hour of each session. These reference points often function as early control levels and provide context for assessing whether the session is establishing bias, consolidating, or exhibiting reversal behaviour.
How it works:
* After the session starts, the indicator records the highest and lowest prices during the first hour.
* These levels are plotted and extended across the session.
* They provide a visual reference for observing reactions, targets, or rejection zones.
Inputs / Options:
* Enable or disable for each session
* Line style, colour, and label visibility
* Number of historic sessions displayed
EQO Levels (Equity Open)
The indicator plots the opening price of each configured session. These “Equity Open” levels represent short-term reference points that can attract price early in the session.
Once the level is revisited after the Open Box has formed, it is automatically cut to avoid clutter. If not revisited, the line remains as an untested reference, similar to a naked point of control.
How it works:
* At session open, the open price is recorded.
* The level is plotted as a local reference.
* If price interacts with the level after the Open Box completes, the line is cut.
* Untested EQOs extend forward until interacted with.
Inputs / Options:
* Enable/disable per session
* Line style and label settings
* Optional extension into the next day
* Option for cutting vs. hiding on revisit
* Number of historic sessions displayed
OB Range Expansions (Automatic)
Range expansions are calculated from the height of the Open Box. These levels provide structured reference zones for identifying potential continuation or exhaustion areas within a session.
How it works:
* After the Open Box is formed, multiples of the range (e.g., 1×, 2×, 3×) are projected.
* These expansion levels are plotted above and below the range.
* Price reactions near these areas can illustrate continuation, hesitation, or potential reversal.
Inputs / Options:
* Enable or disable per session
* Select number of multiples
* Line style, colour, and label settings
* Extension length into the session
Stacey Burke 12-Candle Window Marker
The indicator can highlight the 12-candle window often referenced in Stacey Burke’s session methodology. This window represents the key active period of each session where breakout attempts, volatility shifts, and reversal signatures often occur.
How it works:
* A configurable window (default 12 candles) is highlighted from each session open.
* This window acts as a guide for observing active session behaviour.
* It remains visible throughout the session for structural context.
Inputs / Options:
* Enable/disable per session
* Configurable window duration (default: 3 hours)
* Colour and transparency controls
Concept and Integration
The Open Box is built around the same multi-timeframe logic that underpins the broader TrendPredator framework.
While higher-timeframe tools track bias and setups across the H8–D–W–M levels, the Open Box focuses on the H1–M30 domain to define session structure and observe how early intraday behaviour aligns with higher-timeframe conditions.
The indicator integrates with the TrendPredator FO (Breakout, Fakeout & Trend Switch Detector), which highlights microstructure signals on lower timeframes (M15/M5). Together they form a layered workflow:
* Higher timeframes: context, bias, and developing setups
* TrendPredator OB: intraday and intra-session structure
* TrendPredator FO: microstructure confirmation (e.g., FOL/FOH, switches)
This alignment provides a structured way to observe how daily directional context interacts with intraday behaviour.
See the public open source indicator TP FO here (click on it for access):
Practical Application
Before Session Open
* Review previous session Open Box, Open level, and VWAPs
* Assess how higher-timeframe bias aligns with potential intraday continuation or reversal
* Note untested EQO levels or VWAPs that may function as liquidity attractors
During Session Open
* Observe behaviour around the first-hour high/low and higher-timeframe reference levels
* Monitor how the M15 and 30-minute ranges close
* Track reactions relative to the session open level and the session VWAP
After the Open Box completes
* Assess price interaction with Open Box boundaries and first-hour levels
* Use microstructure signals (e.g., FOH/FOL, switches) for potential confirmation
* Refer to expansion levels as reference zones for management or target setting
After Session
* Review how price behaved relative to the Open Box, EQO levels, VWAPs, and expansion zones
* Analyse breakout attempts, fakeouts, and whether intraday structure aligned with the broader daily move
Example Workflow and Trade
1. Higher-timeframe analysis signals a Daily Fakeout Low Continuation (bullish context).
2. The New York session forms an Open Box; price breaks above and holds above the first-hour high.
3. A Fakeout Low + Switch Bar appears on M5 (via FO), after retesting the session VWAP triggering the entry.
4. 1x expansion level serves as reference targets for take profit.
Relation to the TrendPredator Ecosystem
The Open Box is part of the TrendPredator Indicator Family, designed to apply multi-timeframe logic consistently across:
* higher-timeframe context and setups
* intraday and session structure (OB)
* microstructure confirmation (FO)
Together, these modules offer a unified structure for analysing how daily and intraday cycles interact.
Disclaimer
This indicator is for educational purposes only and does not guarantee profits.
It does not provide buy or sell signals but highlights structural and behavioural areas for analysis.
Users are solely responsible for their trading decisions and outcomes.

True Breakout Pattern [TradingFinder] Breakout Signal Indicator🔵 Introduction
In many market conditions, what initially appears to be a decisive breakout often turns out to be nothing more than a false breakout or fake breakout. Price breaks through a key swing level or an important support and resistance zone, only to quickly return to its previous range.
These failed breakouts, which are often the result of liquidity traps or market manipulation, serve more as a warning sign of structural weakness than confirmation of a new trend.
This indicator is designed around the concept of the fake breakout.
The logic is simple but precise : when price breaks a swing level and returns to that level within a maximum of five candles, the move is considered a false breakout. At this point, a Fibonacci retracement is applied to the recent price swing to evaluate the pullback area.
If price, within ten candles after the return to the breakout level, enters the Fibonacci zone between 0.618 and 1.0, the setup becomes valid for a potential entry. This area is identified as a long entry zone, with the stop loss placed just beyond the 1.0 level and the take profit defined based on the desired risk-to-reward ratio.
By combining accurate detection of false breakouts, analysis of price reaction to swing levels, and alignment with Fibonacci retracement logic, this framework allows traders to identify opportunities often missed by others. In a market where failed breakouts are a common and recurring phenomenon, this indicator aims to transform these traps into measurable trading opportunities.
Long Setup :
Short Setup :
🔵 How to Use
This indicator operates based on the recognition of false breakouts from structural levels in the market, specifically swing levels, and combines that with Fibonacci retracement analysis.
In this strategy, trades are only considered when price returns to the broken level within a defined time window and reacts appropriately inside a predefined Fibonacci range. Depending on the direction of the initial breakout, the system outlines two scenarios for long and short setups.
🟣 Long Setup
In the long setup, price initially breaks below a support level or swing low. If the price returns to the broken level within a maximum of five candles, the move is identified as a fake breakout.
At this stage, a Fibonacci retracement is drawn from the recent high to the low. If price, within ten candles of returning to the level, moves into the 0.618 to 1.0 Fibonacci zone, the conditions for a long entry are met.
The stop loss is placed slightly below the 1.0 level, while the take profit is set based on the trader’s preferred risk-reward ratio. This setup aims to capture deeply discounted entries at low risk, aligned with smart money reversals.
🟣 Short Setup
In the short setup, the price breaks above a resistance level or swing high. If the price returns to that level within five candles, the move is again treated as a false breakout. Fibonacci is then drawn from the recent low to the high to observe the retracement area.
Should price enter the 0.618 to 1.0 Fibonacci range within ten candles of returning, a short entry is considered valid. In this case, the stop loss is placed just above the 1.0 level, and the take profit is adjusted based on the intended risk-reward target. This method allows traders to identify high-probability short setups by focusing on failed breakouts and deep pullbacks.
🔵 Settings
🟣 Logical settings
Swing period : You can set the swing detection period.
Valid After Trigger Bars : Limits how many candles after a fake breakout the entry zone remains valid.
Max Swing Back Method : It is in two modes "All" and "Custom". If it is in "All" mode, it will check all swings, and if it is in "Custom" mode, it will check the swings to the extent you determine.
Max Swing Back : You can set the number of swings that will go back for checking.
🟣 Display settings
Displaying or not displaying swings and setting the color of labels and lines.
🟣 Alert Settings
Alert False Breakout : Enables alerts for Breakout.
Message Frequency : Determines the frequency of alerts. Options include 'All' (every function call), 'Once Per Bar' (first call within the bar), and 'Once Per Bar Close' (final script execution of the real-time bar). Default is 'Once per Bar'.
Show Alert Time by Time Zone : Configures the time zone for alert messages. Default is 'UTC'.
🔵 Conclusion
A sound understanding of the false breakout phenomenon and its relationship to structural price behavior is essential for technical traders aiming to improve precision and consistency. Many poor trading decisions stem from misinterpreting failed breakouts and entering too early into weak signals.
A structured approach, grounded in the analysis of swing levels and validated through specific price action and timing rules, can turn these misleading moves into valuable trade opportunities.
This indicator, by combining fake breakout detection with time filters and Fibonacci-based retracement zones, helps traders only engage with the market when multiple confirming factors are in alignment. The result is a strategy that emphasizes probability, risk control, and clarity in decision-making, offering a solid edge in navigating today’s volatile markets.

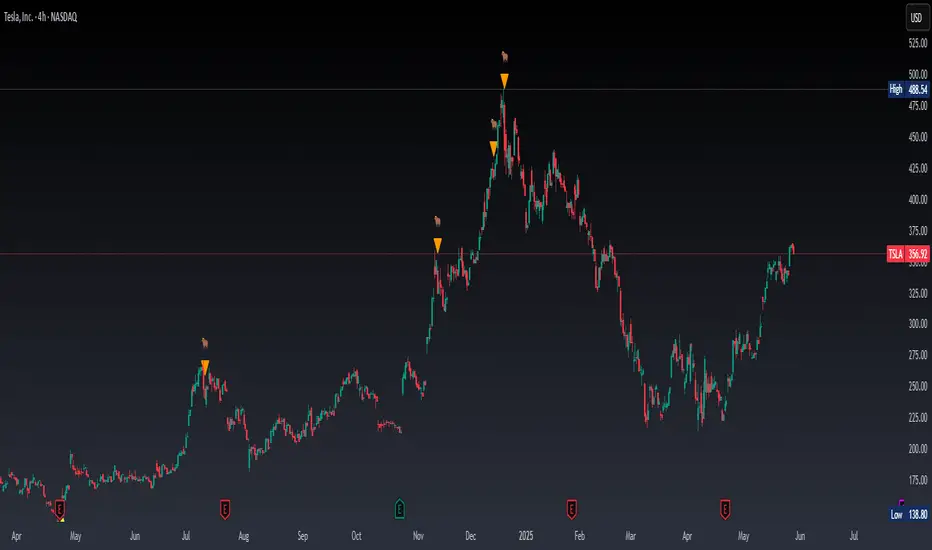
Real Time Swing Trap DetectorThe Real Time Swing Trap Detector is a minimalist, pro-grade tool for instantly spotting classic “bull traps” and “bear traps” on any chart.
This indicator identifies swing traps in real time by tracking significant swing highs and lows, then watching for fast, false breakouts (bull traps) and breakdowns (bear traps) within a user-defined window.
How it works:
Detects when price breaks a major swing high/low (using configurable lookback).
If price quickly reclaims the broken level within X bars (trap window), a trap is confirmed and a subtle icon (🐂 for bull, 🐻 for bear) is displayed on the chart—no labels, no clutter.
You can enable/disable alerts for bull/bear traps individually or together, and receive notifications the moment a trap is detected.
Use cases:
Spot and avoid classic market “fakeouts” that trap breakout traders.
Confirm SMC/ICT “Judas swing” setups, or filter for high-probability reversals.
Works on all timeframes and assets: stocks, crypto, forex, indices.
Inputs:
Swing Lookback Bars: How far back to define swing points (default: 50)
Major Swing Filter: Additional filter for only the most significant highs/lows (default: 200)
Trap Bars (Look Ahead): Window in which a trap must be confirmed (default: 10)
Enable Bull/Bear Trap Alerts: Toggle real-time alerts for each trap type.
Visuals:
🐻 icon below bar for bear trap (short squeeze/reversal)
🐂 icon above bar for bull trap (long squeeze/reversal)
How to set up alerts:
Add the indicator to your chart, open TradingView’s Alerts panel, and choose “Bear Trap Alert,” “Bull Trap Alert,” or “Any Trap Alert” for instant notifications.
Price Step Channel [BigBeluga]Price Step Channel is designed to provide a structured look at price trends through a dynamic step line channel, highlighting trend direction and volatility boundaries.
🔵 Key Features:
Step Line with Boundaries: The central step line adjusts with price movements, creating upper and lower boundaries based on price volatility. The channel is green during uptrends and red during downtrends, visually signaling the trend’s direction.
Fakeout Markers: "✖" markers identify potential fakeouts—moments when the price breaches the channel boundary without confirming a trend change. These markers help you spot possible mean reversion points.
Dynamic Boundary Labels: Labels at the end of the channel show the price levels of the upper and lower boundaries. In uptrends, the upper label turns green; in downtrends, the lower label turns red, providing an instant read on the trend's direction.
Customizable Display: You can toggle off the boundaries and labels for a cleaner view, focusing only on the step line and its color-coded trend signals.
🔵 When to Use:
Price Step Channel is ideal for traders looking to follow structured trends with defined volatility boundaries. The step line and color-coded channel provide clear trend insights, while the fakeout markers and customizable display options enhance flexibility in different market conditions. Whether you’re focusing on clean trend signals or detailed boundary interactions, this tool adapts to your style.

Half-Trend Channel [BigBeluga]Half Trend Channel is a powerful trend-following indicator designed to identify trend direction, fakeouts, and potential reversal points. The combination of upper/lower bands, midline coloring, and specific signals makes it ideal for spotting trend continuation and market reversals.
The base of the channel is calculated using smoothed half-trend logic.
// Initialize half trend on the first bar
if barstate.isfirst
hl_t := close
// Update half trend value based on conditions
switch
closeMA < hl_t and highestHigh < hl_t => hl_t := highestHigh
closeMA > hl_t and lowestLow > hl_t => hl_t := lowestLow
=> hl_t := hl_t
// Smooth
float s_hlt = ta.hma(hl_t, len)
🔵 Key Features:
Upper and Lower Bands:
The bands adapt dynamically to market volatility.
Price movements toward the bands help identify areas of overextension and potential reversal points.
Midline Trend Signal:
The midline changes color to reflect the current trend:
Green Midline: Indicates an uptrend.
Purple Midline: Signals a downtrend.
Fakeout Signals ("X"):
"X" markers appear when price briefly breaches the outer bands but fails to sustain the move.
Fakeouts help traders identify areas where price momentum weakens.
Reversal Signals (Triangles):
Triangles (▲ and ▼) mark potential tops and bottoms:
▲ Up Triangles: Suggest a potential bottom and a reversal to the upside.
▼ Down Triangles: Indicate a potential top and a reversal to the downside.
Dynamic Trend Labels:
At the last bar, the indicator displays labels like "Trend Up" or "Trend Dn" , reflecting the current trend direction.
🔵 Usage:
Use the colored midline to determine the overall trend direction.
Monitor "X" fakeout signals to spot failed breakouts or momentum exhaustion near the bands.
Watch for reversal triangles (▲ and ▼) to identify potential trend reversals at tops or bottoms.
Combine the bands and midline signals to confirm trade entries and exits:
Enter long trades when price bounces off the lower band with a green midline.
Consider short trades when price reverses from the upper band with a purple midline.
Use the trend label (e.g., "Trend Up" or "Trend Dn") for quick confirmation of the current market state.
The Half Trend Channel is an essential tool for traders who want to follow trends, avoid fakeouts, and identify reliable tops and bottoms to optimize their trading decisions.

[EmreKb] Supertrend FakeoutSupertrend Fakeout
This script is an enhanced version of the classic Supertrend indicator. It incorporates an additional feature that ensures trend reversals are more reliable by introducing a Fakeout Index Limit and a Fakeout ATR Mult. This helps avoid false trend changes that could occur due to short-term price fluctuations or market noise.
How It Works:
The Supertrend indicator uses Average True Range (ATR) and a multiplier to determine the direction of the trend. When the price is above the Supertrend line, it indicates an uptrend; when the price is below the Supertrend line, it signals a downtrend.
This version goes a step further by adding the following checks before confirming a trend reversal:
The script will monitor if the price moves "Fakeout ATR Mult" ATR away from the Supertrend line after a potential breach. This distance helps ensure that the trend change is significant and not just a minor fluctuation.
In addition, the script checks the price action for a specific number of bars, which is controlled by the Fakeout Index Limit. This limit determines how many bars the price must remain below (for a downtrend) or above (for an uptrend) the Supertrend line before the trend is officially reversed.

Fake BreakoutThis indicator detect fake breakout on previous day high/low and option previous swing high and low
Rule Detect Fake Breakout On Previous Day High/Low Or Swing high low Fake Breakout -
1) Detect previous day high/low or swing high/low
2)
A) If price revisit on previous day high/swing high look for upside breakout after input
number of candle (1-5) price came back to previous high and breakout happen downside
it show sell because its fake breakout of previous day high or swing high
B) If price revisit on previous day low/swing low look for downside breakout after input
number of candle (1-5) price came back to previous low and breakout upside of previous
day low it show Buy because its fake breakout of previous day low or swing low
Disclaimer -Traders can use this script as a starting point for further customization or as a reference for developing their own trading strategies. It's important to note that past performance is not indicative of future results, and thorough testing and validation are recommended before deploying any trading strategy.

Daily Pivots with Fakeout Protection█ OVERVIEW
The "Daily Pivots with Fakeout Protection" indicator is a powerful tool designed to help traders identify potential price breakouts and pivot levels on daily charts. This indicator calculates and displays daily pivot points along with breakout lines that are adjusted to provide a certain level of protection against fakeouts, which are false price movements that can mislead traders.
█ FEATURES
• Pivot Timeframe Selection: You can choose the timeframe for the pivot calculations. The default is set to daily (D), but you have the flexibility to select other timeframes as well.
• Fakeout Protection: A percentage-based parameter allows you to define the amount of protection you want against fakeouts. This helps filter out potentially unreliable breakouts.
• Bullish and Bearish Signals: The indicator distinguishes between bullish and bearish conditions by comparing the closing price to the daily high and low.
• Breakout Signals: Triangular symbols (upward and downward) appear below and above bars to signal potential breakout points. These are based on the closing price crossing the adjusted breakout lines.
• Visual Representation: Pivot points, daily high, and daily low are plotted on the chart, with distinctive line styles and colors for easy identification.
• Background Highlighting: The background color of the chart changes when a new period begins, helping you quickly recognize the start of a new trading day.
• Color-Coded Zones: The indicator colors the background around the closing price differently based on whether the market is bullish (green) or bearish (red).
█ HOW TO USE
1 — Apply the "Daily Pivots with Fakeout Protection" indicator to your TradingView chart.
2 — Customize the parameters like pivot timeframe and fakeout protection percentage according to your trading preferences.
3 — Watch for the triangular breakout symbols that appear above and below bars, indicating potential breakout points.
4 — Keep an eye on the pivot points, daily high, and daily low lines to understand price levels relevant to the current trading day.
5 — Use the background color changes to quickly identify the beginning of a new trading day and any potential shifts in market sentiment.
Note:
• This indicator is designed for daily charts but can be adjusted to work with other timeframes as well.
• Be cautious of relying solely on breakout signals; consider using additional technical and fundamental analysis for confirmation.
Start integrating the "Daily Pivots with Fakeout Protection" indicator into your trading strategy to enhance your ability to identify breakouts and pivot levels more effectively.

Dodge Trend [MyTradingCoder]Introducing the "Dodge Trend" indicator, an innovative variant of the Supertrend indicator designed to help traders better avoid fakeouts and maintain positions in established trends.
Like the Supertrend, the Dodge Trend uses Average True Range (ATR) but incorporates a unique adaptive adjustment feature that differentiates it from its counterparts. While the conventional Supertrend rises with the trend and only descends when the price crosses it, the Dodge Trend is designed to 'dodge' potential fakeouts.
This 'dodging' mechanism works by allowing the Dodge Trend to fall slightly during pullbacks, reducing the risk of a premature exit due to a temporary price drop. The recovery rate after the pullback is quicker but is slightly lower than the rate at which a new Dodge Trend high would be established in an uptrend. This unique adjustment feature allows the Dodge Trend to chase price action in an exponential fashion, potentially enabling a quicker exit when the trend shifts.
Key Settings:
Length: Adjust how much price action is taken into consideration for the ATR average. Lower values yield higher responsiveness to recent price action.
Size: Determines the initial deviation of the Dodge Trend when it resets after every flip/break.
Source: Specifies the data point (close, high, open, low, hl2, etc.) used for the Dodge Trend.
Dodge Intensity: Adjusts the intensity of the pullback effect. Higher values result in more intense pullbacks. Range is limited between 0 and 99, with 95 as the recommended default.
Bullish Color Setting: Sets the color for the uptrend Dodge Trend.
Bearish Color Setting: Sets the color for the downtrend Dodge Trend.
Dodge Trend is a powerful tool for traders looking to ride trends and avoid unnecessary exits due to short-term price fluctuations. While it offers a unique feature that may potentially improve trading outcomes, it should be used in conjunction with other indicators and analysis methods for a comprehensive trading strategy. As with all tools, it does not guarantee profitable trades but aims to give traders more actionable and precise information to base their decisions on.
Experience trend-following in a more adaptive and efficient manner with the Dodge Trend indicator, a tool designed to help you 'dodge' false exits and stay in line with the overall trend.

Fake breakHi Traders,
I've developed an indicator which can detect fake-breaks on the chart.
In the following you'll find the definition of the fake break candles and also you will find how to recognize it on the chart with practical examples.
What is the fake break pattern?
Sometimes support and resistance lines broke with a full body and strong candles that gives us the idea of sharp movements on the chart but suddenly the next candle returns all the path of the previous candle. in this case we can say fake break is happening on the chart.
This indicator detect fake break patterns based on two criteria:
1. It uses AverageTrueRange indicator to measure the strength of the pattern.
2. The returning candle should engulf minimum 75% of the break candle.
This indicator plot 2 terms in the name of "FB-D" and "FB-U" that are abbreviations of the "Fake Break Down" and "Fake Break Up".
You can also set alerts to get notified when fake breakout happens on the chart.
Notice: This pattern is only acceptable in valid support and resistance zones and you can not rely on it everywhere on the chart (specially in the middle of the waves).
Notice: The source code of this indicator is open and you are allowed to use it on your scripts by mentioning the name of author.
Disclaimer: This is not a financial advice or any signal to buy or sell, the goal of developing such an indicator is to use for educational purposes.

Matze BreakoutShows 2 different states of breakout:
Arrow = unusual volume, raising volume, positiv rate of change, standard deviation breakout
Bolt = very unusual volume, very high standard deviation breakout

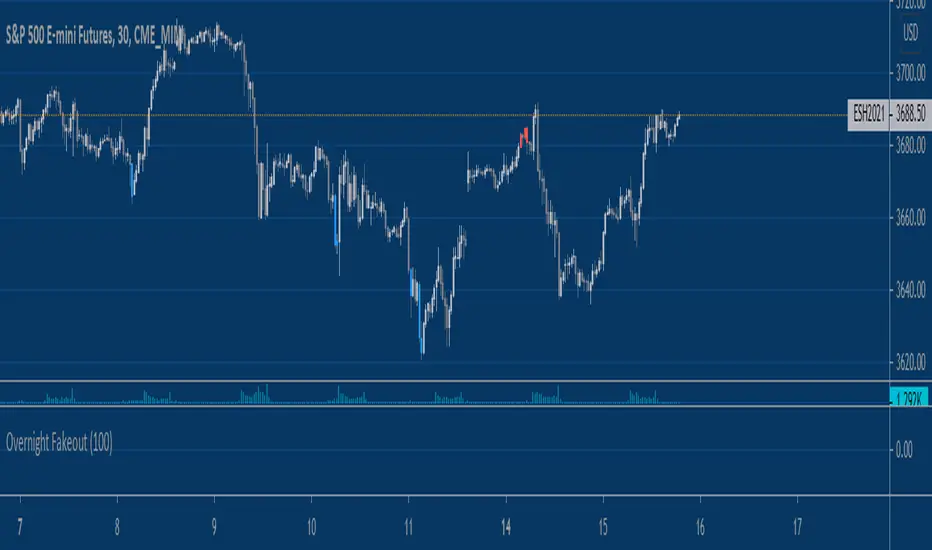
Equity Index Overnight FakeoutThis script highlights when price violates the highest high or lowest low within the user's selected lookback period, with the caveat that it occurs during the GLOBEX session. The script is designed to work exclusively with the trading hours for CME and CBOT Equity Index futures. I'm planning to make a more customizable version down the line.
My reasoning behind this very simple script is that the low liquidity and participation of the overnight session creates a tendency for moves at extremes to mean revert. Let me know what you think.
Vision VolumeAfter reading an article on how to trade volume I felt that I needed some kind of indicator using price action and volume together.
More precisely I tried to build two indicators. Bear in mind this indactor is very simple because it only evaluates each bar with its previous bar and an average.
Nr.1 Weak/fake push: Price suddenly goes up/down a lot more but without much volume being traded -> sign of a fake move or low interest
Nr 2 Price action resistance: After an up or down move price suddenly stops moving but high volumes are being traded. This means high resistance from sellers in a rally or buyers in a decline.
This is very simple and as you can see it is often not a clear signal. I will try to improve it further. If a fake move bar (purple) has a close near its new high we don't know if the fake push will continue. As you can see on the chart. some reversal signs come a little to early.
You can re-color labels and turn them off optionally.
This is built for educational purposes only. I hope you find it useful.
Design by Hook
