Smart Fear & Greed Index [MarkitTick]💡 This comprehensive technical tool is designed to quantify market sentiment on an asset-specific basis, translating complex price action into a singular, normalized gauge of "Fear" and "Greed." While traditional Fear & Greed indices rely on macro-economic data (like put/call ratios or junk bond demand) generally applied to the broad S&P 500, this script calculates a localized index for the specific chart you are viewing. It synthesizes Momentum, Volatility, Volume, and Price Positioning into a bounded 0-100 oscillator, aiming to identify psychological extremes where market reversals are statistically more likely to occur.
✨ Originality and Utility
● Asset-Specific Sentiment Analysis
Most sentiment tools are external to the chart (e.g., news sentiment or broad market indices). The Smart Fear & Greed Index is unique because it internalizes this logic, creating a bespoke psychological profile for any ticker—whether it is Crypto, Forex, or Stocks. It allows traders to see if *this specific asset* is overheated (Greed) or oversold (Fear) relative to its own recent history.
● The "Buy the Fear, Sell the Greed" Logic
The script employs a contrarian color-coding philosophy aligned with the famous investment adage: "Be fearful when others are greedy, and greedy when others are fearful."
When the indicator shows Fear (Low values), it colors the zone Green, signaling a potential buying opportunity (discount).
When the indicator shows Greed (High values), it colors the zone Red, signaling potential downside risk (premium).
● Integrated Divergence Detection
Unlike standard oscillators that leave interpretation entirely to the user, this tool includes an automated divergence engine. It detects discrepancies between the sentiment index and price action, plotting lines and labels to highlight potential exhaustion points before they become obvious on the price chart.
🔬 Methodology and Concepts
The calculation is driven by a custom User-Defined Type (UDT) called QuantEngine , which aggregates four distinct technical "pillars" to form the final Composite Index.
• Pillar 1: Momentum (RSI)
The engine utilizes the Relative Strength Index to measure the velocity and magnitude of directional price movements. High momentum contributes to the "Greed" score, while collapsing momentum contributes to "Fear."
• Pillar 2: Volatility (Inverted Normalized ATR)
This component interprets volatility through a psychological lens.
Low Volatility is interpreted as complacency or "Greed" (steady uptrends often have low vol).
High Volatility is interpreted as "Fear" (panic selling and erratic ranges often spike volatility).
The script normalizes the Average True Range (ATR) and inverts it so that stability adds to the score, and instability subtracts from it.
• Pillar 3: Volume Strength
Volume is analyzed relative to its moving average. However, raw volume isn't enough; the engine applies directional logic.
High relative volume on an Up-Close adds to the Greed score.
High relative volume on a Down-Close subtracts, adding to the Fear score.
• Pillar 4: Price Position (Stochastic)
This calculates where the current close sits relative to the recent High-Low range. Closing near the highs indicates confidence (Greed), while closing near the lows indicates pessimism (Fear).
• The Composite & Smoothing
These four metrics are averaged to create a raw composite, which is then smoothed via an Exponential Moving Average (EMA) to filter out noise and produce the final, readable "Smart Fear & Greed" line.
🎨 Visual Guide
● The Oscillator Line
This is the primary fluctuating line that moves between 0 and 100.
Values > 50 suggest positive sentiment.
Values < 50 suggest negative sentiment.
● Color-Coded Zones
The plot changes color dynamically to reflect the psychological state:
Red (70-100): Extreme Greed. The market may be irrationally exuberant.
Orange (60-70): Greed. Strong bullish conviction.
Yellow (40-60): Neutral. Indecisive or transitionary market.
Light Green (30-40): Fear. Sentiment is turning bearish.
Bright Green (0-30): Extreme Fear. Panic selling, often a precursor to a value bounce.
● Background Highlights
A semi-transparent Red Background appears when the index breaches 75, warning of a potential "Top."
A semi-transparent Green Background appears when the index drops below 25, highlighting a potential "Bottom."
● Divergence Elements
Red Lines/Labels ("Bear"): Bearish Divergence. Price makes a Higher High, but the Index makes a Lower High. This suggests momentum is waning despite rising prices.
Green Lines/Labels ("Bull"): Bullish Divergence. Price makes a Lower Low, but the Index makes a Higher Low. This suggests selling pressure is drying up.
📖 How to Use
• Identifying Reversals
Wait for the oscillator to enter "Extreme" zones. Do not trade immediately upon entry; wait for the line to exit the extreme zone to confirm the reversal. For example, if the line hits 80 (Red) and then crosses back down below 70, it signals that Greed is fading.
• Trend Continuation
In a strong trend, the indicator may hover in the Greed (Orange) or Fear (Light Green) zones for extended periods. In these cases, use the Neutral (Yellow) zone crosses as re-entry signals in the direction of the trend.
• Divergence Confirmation
Use the automated divergence lines as high-conviction triggers. If the background turns Green (Extreme Fear) AND a Bullish Divergence label appears, it provides a stronger technical case for a long position than the zone alone.
⚙️ Inputs and Settings
● Calculation Settings
Global Lookback Period (Default: 21): The core lookback window for RSI, ATR, Volume, and Stochastic calculations. Increasing this makes the index slower and less reactive; decreasing it makes it faster.
Smoothing Length (Default: 5): Determines how smooth the final line is. Higher numbers reduce "whipsaws" but add lag.
Color Main Chart Candles : Colors the chart bars based on Fear/Greed sentiment.
● Divergence Settings
Divergence Lookback (Default: 5): Determines the pivot strength required to register a high or low for divergence checks.
Show Divergence Lines/Labels: Toggles to hide visual clutter if you only want to see the oscillator.
🔍 Deconstruction of the Underlying Scientific and Academic Framework
● Normalization Theory
The core scientific principle here is Min-Max Normalization. The script takes heterogeneous data types—Price (Dollars/Cents), Volume (Shares/Contracts), and Volatility (Points)—and standardizes them into a unit-less distribution between 0 and 100. This allows for the summation of disparate market forces into a single vector.
● Mean Reversion and Oscillator Bounds
The indicator relies on the statistical concept of Mean Reversion. Markets, like elastic bands, can only stretch so far from their average valuation (represented by the 50 line) before snapping back. The "Extreme" zones (Upper and Lower deciles) represent areas of statistical improbability where the likelihood of a continuation decreases and the likelihood of a reversion increases.
● Divergence and Momentum Theory
The divergence logic is grounded in the principle that momentum precedes price. Mathematically, price is the integral of velocity. When the derivative (momentum/sentiment) approaches zero or reverses while the function (price) continues, it signals a non-sustainable anomaly in the data series, often resolved by a price correction.
⚠️ Disclaimer
All provided scripts and indicators are strictly for educational exploration and must not be interpreted as financial advice or a recommendation to execute trades. I expressly disclaim all liability for any financial losses or damages that may result, directly or indirectly, from the reliance on or application of these tools. Market participation carries inherent risk where past performance never guarantees future returns, leaving all investment decisions and due diligence solely at your own discretion.
Fear-indicator

Ticker Pulse Meter + Fear EKG StrategyDescription
The Ticker Pulse Meter + Fear EKG Strategy is a technical analysis tool designed to identify potential entry and exit points for long positions based on price action relative to historical ranges. It combines two proprietary indicators: the Ticker Pulse Meter (TPM), which measures price positioning within short- and long-term ranges, and the Fear EKG, a VIX-inspired oscillator that detects extreme market conditions. The strategy is non-repainting, ensuring signals are generated only on confirmed bars to avoid false positives. Visual enhancements, such as optional moving averages and Bollinger Bands, provide additional context but are not core to the strategy's logic. This script is suitable for traders seeking a systematic approach to capturing momentum and mean-reversion opportunities.
How It Works
The strategy evaluates price action using two key metrics:
Ticker Pulse Meter (TPM): Measures the current price's position within short- and long-term price ranges to identify momentum or overextension.
Fear EKG: Detects extreme selling pressure (akin to "irrational selling") by analyzing price behavior relative to historical lows, inspired by volatility-based oscillators.
Entry signals are generated when specific conditions align, indicating potential buying opportunities. Exits are triggered based on predefined thresholds or partial position closures to manage risk. The strategy supports customizable lookback periods, thresholds, and exit percentages, allowing flexibility across different markets and timeframes. Visual cues, such as entry/exit dots and a position table, enhance usability, while optional overlays like moving averages and Bollinger Bands provide additional chart context.
Calculation Overview
Price Range Calculations:
Short-Term Range: Uses the lowest low (min_price_short) and highest high (max_price_short) over a user-defined short lookback period (lookback_short, default 50 bars).
Long-Term Range: Uses the lowest low (min_price_long) and highest high (max_price_long) over a user-defined long lookback period (lookback_long, default 200 bars).
Percentage Metrics:
pct_above_short: Percentage of the current close above the short-term range.
pct_above_long: Percentage of the current close above the long-term range.
Combined metrics (pct_above_long_above_short, pct_below_long_below_short) normalize price action for signal generation.
Signal Generation:
Long Entry (TPM): Triggered when pct_above_long_above_short crosses above a user-defined threshold (entryThresholdhigh, default 20) and pct_below_long_below_short is below a low threshold (entryThresholdlow, default 40).
Long Entry (Fear EKG): Triggered when pct_below_long_below_short crosses under an extreme threshold (orangeEntryThreshold, default 95), indicating potential oversold conditions.
Long Exit: Triggered when pct_above_long_above_short crosses under a profit-taking level (profitTake, default 95). Partial exits are supported via a user-defined percentage (exitAmt, default 50%).
Non-Repainting Logic: Signals are calculated using data from the previous bar ( ) and only plotted on confirmed bars (barstate.isconfirmed), ensuring reliability.
Visual Enhancements:
Optional moving averages (SMA, EMA, WMA, VWMA, or SMMA) and Bollinger Bands can be enabled for trend context.
A position table displays real-time metrics, including open positions, Fear EKG, and Ticker Pulse values.
Background highlights mark periods of high selling pressure.
Entry Rules
Long Entry:
TPM Signal: Occurs when the price shows strength relative to both short- and long-term ranges, as defined by pct_above_long_above_short crossing above entryThresholdhigh and pct_below_long_below_short below entryThresholdlow.
Fear EKG Signal: Triggered by extreme selling pressure, when pct_below_long_below_short crosses under orangeEntryThreshold. This signal is optional and can be toggled via enable_yellow_signals.
Entries are executed only on confirmed bars to prevent repainting.
Exit Rules
Long Exit: Triggered when pct_above_long_above_short crosses under profitTake.
Partial exits are supported, with the strategy closing a user-defined percentage of the position (exitAmt) up to four times per position (exit_count limit).
Exits can be disabled or adjusted via enable_short_signal and exitPercentage settings.
Inputs
Backtest Start Date: Defines the start of the backtesting period (default: Jan 1, 2017).
Lookback Periods: Short (lookback_short, default 50) and long (lookback_long, default 200) periods for range calculations.
Resolution: Timeframe for price data (default: Daily).
Entry/Exit Thresholds:
entryThresholdhigh (default 20): Threshold for TPM entry.
entryThresholdlow (default 40): Secondary condition for TPM entry.
orangeEntryThreshold (default 95): Threshold for Fear EKG entry.
profitTake (default 95): Exit threshold.
exitAmt (default 50%): Percentage of position to exit.
Visual Options: Toggle for moving averages and Bollinger Bands, with customizable types and lengths.
Notes
The strategy is designed to work across various timeframes and assets, with data sourced from user-selected resolutions (i_res).
Alerts are included for long entry and exit signals, facilitating integration with TradingView's alert system.
The script avoids repainting by using confirmed bar data and shifted calculations ( ).
Visual elements (e.g., SMA, Bollinger Bands) are inspired by standard Pine Script practices and are optional, not integral to the core logic.
Usage
Apply the script to a chart, adjust input settings to suit your trading style, and use the visual cues (entry/exit dots, position table) to monitor signals. Enable alerts for real-time notifications.
Designed to work best on Daily timeframe.

Stochastic Vix Fix SVIX (Tartigradia)The Stochastic Vix or Stochastic VixFix (SVIX), just like the Williams VixFix, is a realized volatility indicator, and can help in finding market bottoms as well as tops without requiring bollinger bands or any other construct, as the SVIX is bounded between 0-100 which allows for an objective thresholding regardless of the past.
Mathematically, SVIX is the complement of the original Stochastic Oscillator, with such a simple transform reproducing Williams' VixFix and the VIX index signals of high volatility and hence of market bottoms quite accurately but within a bounded 0-100 range. Having a predefined range allows to find markets bottoms without needing to compare to past prices using a bollinger band (Chris Moody on TradingView) nor a moving average (Hesta 2015), as a simple threshold condition (by default above 80) is sufficient to reliably signal interesting entry points at bottoming prices.
Having a predefined range allows to find markets bottoms without needing to compare to past prices using a bollinger band (Chris Moody on TradingView) nor a moving average (Hesta 2015), as a simple threshold condition (by default above 80) is sufficient to reliably signal interesting entry points at bottoming prices.
Indeed, as Williams describes in his paper, markets tend to find the lowest prices during times of highest volatility, which usually accompany times of highest fear.
Although the VixFix originally only indicates market bottoms, the Stochastic VixFix can also indicate good times to exit, when SVIX is at a low value (default: below 20), but just like the original VixFix and VIX index, exit signals are as usual much less reliable than long entries signals, because: 1) mature markets such as SP500 tend to increase over the long term, 2) when market fall, retail traders panic and hence volatility skyrockets and bottom is more reliably signalled, but at market tops, no one is panicking, price action only loses momentum because of liquidity drying up.
Compared to Hesta 2015 strategy of using a moving average over Williams' VixFix to generate entry signals, SVIX generates much fewer false positives during ranging markets, which drastically reduce Hesta 2015 strategy profitability as this incurs quite a lot of losses.
This indicator goes further than the original SVIX, by restoring the smoothed D and second-level smoothed D2 oscillators from the original Stochastic Oscillator, and use a 14-period ZLMA instead of the original 20-period SMA, to generate smoother yet responsive signals compared to using just the raw SVIX (by default, this is disabled, as the original raw SVIX is used to produce more entry signals).
Usage:
Set the timescale to daily or weekly preferably, to reduce false positives.
When the background is highlighted in green or when the highlight disappears, it is usually a good time to enter a long position.
Red background highlighting can be enabled to signal good exit zones, but these generate a lot of false positives.
To further reduce false positives, the SVIX_MA can be used to generate signals instead of the raw SVIX.
For more information on Williams' Vix Fix, which is a strategy published under public domain:
The VIX Fix, Larry Williams, Active Trader magazine, December 2007, web.archive.org
Fixing the VIX: An Indicator to Beat Fear, Amber Hestla-Barnhart, Journal of Technical Analysis, March 13, 2015, ssrn.com
For more information on the Stochastic Vix Fix (SVIX), published under Creative Commons:
Replicating the CBOE VIX using a synthetic volatility index trading algorithm, Dayne Cary and Gary van Vuuren, Cogent Economics & Finance, Volume 7, 2019, Issue 1, doi.org
Note: strangely, in the paper, the authors failed to mention that the SVIX is the complement of the original Stochastic Oscillator, instead reproducing just the original equation. The correct equation for the SVIX was retroengineered by comparing charts they published in the paper with charts generated by this pinescript indicator.
For a more complete indicator, see:

FEAR & GREED INDICATORBINANCE:BTCUSDTPERP
Hello
The crypto index, which is currently only for Bitcoin, captures bearish and bullish trends by gauging investor sentiment for the coin. As the name suggests, the market trend is identified based on two emotions – fear and greed.
This configurations are set for 1D BTC charts
This is simple script, based on cheatcountry script
Enjoy ;)

VIX MTF MomentumSweet little momentum gadget to track the VIX Index.
What is the VIX?
The CBOE S&P 500 Volatility Index (VIX) is known as the 'Fear Index' which can measure how worried traders are that the S&P 500 might suddenly drop within the next 30 days.
When the VIX starts moving higher, it is telling you that traders are getting nervous. When the VIX starts moving lower, it is telling you that traders are gaining confidence.
VIX calculation?
The Chicago Board of Options Exchange Market Volatility Index (VIX) is a measure of implied volatility (Of the S&P 500 securities options), based on the prices of a basket of S&P 500 Index options with 30 days to expiration.
How to use:
If VIX Momentum is above 0 (RED) traders are getting nervous.
If VIX Momentum is below 0 (GREEN) traders are gaining confidence.
Follow to get updates and new scripts: www.tradingview.com

Fearzone (Expo) - Contrarian Indicator"Be fearful when others are greedy, and greedy when others are fearful" - Warren Buffett. Fearzone is a contrarian indicator that gives us an indication when fear begins to take over in the market. Traders should be prepared for increased volatility and good trading opportunities.
The Fearzone is visualized with red candlesticks below the price.
This version of the FearZone indicator is slightly different from the one ©kruskakli has published.
HOW TO USE
1. Use the indicator to identify when investors are fearful.
2. Use the indicator to identify potential reversal points.
INDICATOR IN ACTION
1 hour chart
5 min chart
I hope you find this indicator useful , and please comment or contact me if you like the script or have any questions/suggestions for future improvements. Thanks!
I will continually work on this indicator, so please share your experience and feedback as it will enable me to make even better improvements. Thanks to everyone that has already contacted me regarding my scripts. Your feedback is valuable for future developments!
-----------------
Disclaimer
Copyright by Zeiierman.
The information contained in my scripts/indicators/ideas does not constitute financial advice or a solicitation to buy or sell any securities of any type. I will not accept liability for any loss or damage, including without limitation any loss of profit, which may arise directly or indirectly from the use of or reliance on such information.
All investments involve risk, and the past performance of a security, industry, sector, market, financial product, trading strategy, or individual’s trading does not guarantee future results or returns. Investors are fully responsible for any investment decisions they make. Such decisions should be based solely on an evaluation of their financial circumstances, investment objectives, risk tolerance, and liquidity needs.
My scripts/indicators/ideas are only for educational purposes!

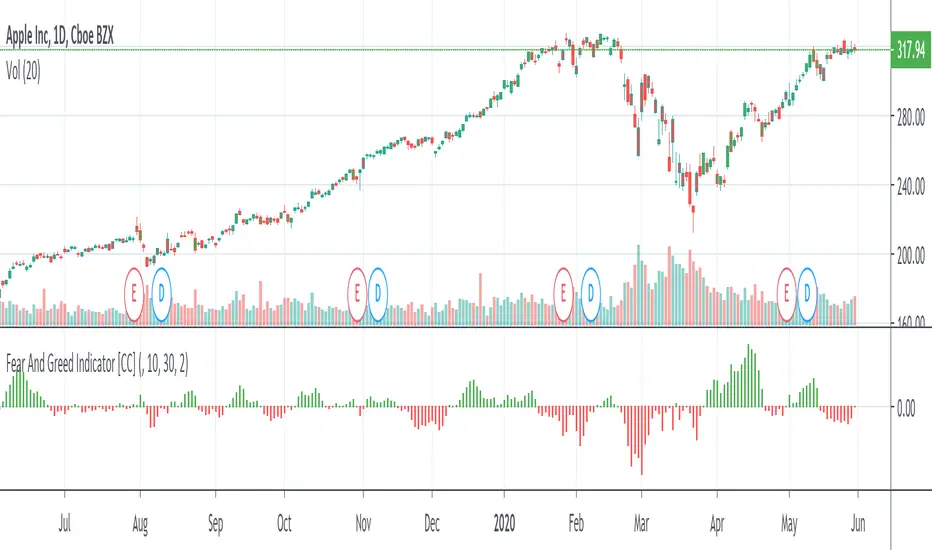
Fear And Greed IndicatorThe Fear And Greed Indicator is a very popular indicator on the Bloomberg platform and since I didn't have actual source code to work with, this is a very close approximation of that indicator. Let me know if you spot any discrepancies with the original and I will do my best to fix them.
For buy and sell signals it is pretty straightforward. Just buy when the green (greed) is in control and sell when the fear (red) is in control
This was a special request so let me know if you want to see more scripts from me or if you want something custom!