Dynamic Trend-Based Fibonacci Extension💡 This indicator is a sophisticated, automated technical analysis tool designed to identify high-probability trend continuation setups using the principles of market structure and Fibonacci geometry. By algorithmically detecting "A-B-C" price structures (Pivot -> Impulse -> Retracement), it projects dynamic Fibonacci Extension levels to forecast potential price targets for the next impulsive move (Wave C to D). Unlike static drawing tools, this script adapts to market volatility and features an advanced invalidation engine to keep your charts clean and your risk managed.
✨ Originality and Utility
Traders often struggle with the subjectivity of drawing Fibonacci extensions manually. This script solves that by standardizing the identification of market structure using a proprietary ZigZag algorithm enhanced with Average True Range (ATR) for volatility-adjusted sensitivity.
Key unique features include:
Automated Structure Detection: Instantly spots Bullish (Higher High, Higher Low) and Bearish (Lower Low, Lower High) sequences without manual input.
Dynamic Invalidation: The script monitors price action in real-time. If price breaks the invalidation point (Point A), the structure is immediately "grayed out" or deleted, preventing you from trading based on broken setups.
Golden Zone Targeting: Highlights the high-probability reversal zone between the 1.5 and 1.618 extensions, often associated with the completion of a measured move.
JSON Alerting: Built-in support for algorithmic trading with structured JSON payloads (Entry, TP, SL) ready for webhook integration.
🔬 Methodology and Concepts
The core logic operates on a three-step algorithmic sequence:
1. Pivot Identification: The script uses a "ZigZag" approach to find significant swing highs and lows. It employs an ATR-based threshold (or fixed deviation) to filter out market noise, ensuring only significant structural points are considered.
2. Geometric Validation: It evaluates the last three pivot points (A, B, C) to confirm a valid trend structure.
Bullish Setup: Point C must be higher than Point A but lower than Point B (a valid retracement).
Bearish Setup: Point C must be lower than Point A but higher than Point B.
3. Projection Mathematics: Once a valid ABC structure is locked, the script calculates extension targets using the standard formula: Target = Price C + ((Price B - Price A) * Ratio) . It also supports Logarithmic Scale calculations for assets with exponential growth, such as cryptocurrencies, ensuring proportional accuracy over large price ranges.
🎨 Visual Guide
The indicator paints a clear, detailed roadmap on your chart. Here is how to interpret the visual elements:
● Structure Lines
Solid Line (A to B): Represents the initial "Impulse" leg of the move.
Dashed Line (B to C): Represents the "Retracement" or corrective leg.
Green Structures: Indicate Bullish setups (looking for long entries).
Red Structures: Indicate Bearish setups (looking for short entries).
Gray/Dimmed Structures: These are invalidated setups where the price has breached the Stop Loss level (Point A).
● Extension Levels (Targets)
The script projects the following key Fibonacci ratios extending from Point C:
0.618 (Wave 5): An early profit-taking level, often corresponding to a truncated 5th wave.
1.0 (Measured Move): Where the extension equals the length of the initial impulse (AB = CD pattern).
1.272 (Harmonic): A common extension level for corrective structures or deep pullbacks.
Golden Zone (1.5 - 1.618): A highlighted fill area. The 1.618 level (Solid Line) is the "Golden Ratio" and is statistically one of the most significant targets in trending markets, often labeled as "Wave 3".
● Labels
Points A, B, C: Clearly marks the swing points defining the structure.
Right-Side Labels: Display the Ratio (e.g., 1.618) and the exact Price Level for easy order placement.
📖 How to Use
This tool is best used as a trend-following system.
1. Trend Identification
Wait for a new Solid Colored Structure (Green or Red) to appear. This confirms that a valid ABC retracement has occurred.
2. Entry Strategy
The "Trigger" is generally the reversal from Point C. Aggressive traders enter near C, while conservative traders may wait for a breakout above B.
Stop Loss: Place your SL just beyond Point A . If price breaks A, the script will automatically gray out the structure, signaling invalidation.
3. Profit Taking
Use the projected extension lines as dynamic Take Profit (TP) zones:
TP1: 1.0 (The Measured Move).
TP2: The Golden Zone (1.5 to 1.618). This is often the strongest target for a Wave 3 impulsive move.
4. Automation
For automated traders, create an alert using the "Any alert() function call" option. The script outputs a JSON string containing the Action, Ticker, Entry Price, TP (1.618), and SL (Point A).
⚙️ Inputs and Settings
You can fully customize the script to fit your asset class and timeframe:
● ZigZag Detection
Pivot Lookback Depth: (Default: 5) Determines how many bars to check left/right for a pivot. Higher numbers find larger, more significant structures.
Use ATR-Based Threshold: (Default: True) Adapts the sensitivity to market volatility.
ATR Multiplier: (Default: 2.0) Adjusts how much price must reverse to form a new leg.
● Structure Invalidation
Enable Structure Invalidation: (Default: True) Toggles the logic that checks if Point A is breached.
Invalidation Action: Choose "Gray Out" to keep history visible but dimmed, or "Delete" to remove failed setups entirely.
● Fibonacci Settings
Use Logarithmic Scale: Essential for crypto or long-term timeframe analysis.
Show 0.618 / 1.0 / 1.272 / 1.618: Toggles individual levels on/off to declutter the chart.
Extend Lines Right: Extends the target lines into the future for better visibility.
● Display Settings
Keep Last N Structures: Controls how many historical structures remain on the chart to prevent visual clutter.
Show Elliott Wave Labels: Adds theoretical wave counts (e.g., "Wave 3") to the ratio labels.
🔍 Deconstruction of the Underlying Scientific and Academic Framework
This indicator is grounded in Fractal Market Geometry and Elliott Wave Theory .
1. The Golden Ratio (Phi - 1.618):
Mathematically derived from the Fibonacci sequence, the 1.618 ratio is omnipresent in natural growth patterns. In financial markets, it represents the psychological "tipping point" of crowd behavior during an impulsive trend. This script emphasizes the 1.618 extension as the primary target for a "Wave 3," which is academically cited as typically the longest and strongest wave in a 5-wave motive sequence.
2. Harmonic AB=CD Patterns:
The inclusion of the 1.0 extension validates the "Measured Move" concept. Statistically, markets often move in symmetrical legs where the secondary impulse (CD) equals the magnitude of the primary impulse (AB).
3. Volatility Normalization (ATR):
By utilizing the Average True Range (ATR) for pivot detection, the script adheres to statistical volatility normalization. This ensures that the structures identified are statistically significant relative to the asset's current volatility regime, rather than relying on arbitrary percentage moves which fail across different asset classes.
⚠️ Disclaimer
All provided scripts and indicators are strictly for educational exploration and must not be interpreted as financial advice or a recommendation to execute trades. I expressly disclaim all liability for any financial losses or damages that may result, directly or indirectly, from the reliance on or application of these tools. Market participation carries inherent risk where past performance never guarantees future returns, leaving all investment decisions and due diligence solely at your own discretion.
Fiblevels

ATR Stop-Loss with Fibonacci Take-Profit [jpkxyz]ATR Stop-Loss with Fibonacci Take-Profit Indicator
This comprehensive indicator combines Average True Range (ATR) volatility analysis with Fibonacci extensions to create dynamic stop-loss and take-profit levels. It's designed to help traders set precise risk management levels and profit targets based on market volatility and mathematical ratios.
Two Operating Modes
Default Mode (Rolling Levels)
In default mode, the indicator continuously plots evolving stop-loss and take-profit levels based on real-time price action. These levels update dynamically as new bars form, creating rolling horizontal lines across the chart. I use this mode primarily to plot the rolling ATR-Level which I use to trail my Stop-Loss into profit.
Characteristics:
Levels recalculate with each new bar
All selected Fibonacci levels display simultaneously
Uses plot() functions with trackprice=true for price tracking
Custom Anchor Mode (Fixed Levels)
This is the primary mode for precision trading. You select a specific timestamp (typically your entry bar), and the indicator locks all calculations to that exact moment, creating fixed horizontal lines that represent your actual trade levels.
Characteristics:
Entry line (blue) marks your anchor point
Stop-loss calculated using ATR from the anchor bar
Fibonacci levels projected from entry-to-stop distance
Lines terminate when price breaks through them
Includes comprehensive alert system
Core Calculation Logic
ATR Stop-Loss Calculation:
Stop Loss = Entry Price ± (ATR × Multiplier)
Long positions: SL = Entry - (ATR × Multiplier)
Short positions: SL = Entry + (ATR × Multiplier)
ATR uses your chosen smoothing method (RMA, SMA, EMA, or WMA)
Default multiplier is 1.5, adjustable to your risk tolerance
Fibonacci Take-Profit Projection:
The distance from entry to stop-loss becomes the base unit (1.0) for Fibonacci extensions:
TP Level = Entry + (Entry-to-SL Distance × Fibonacci Ratio)
Available Fibonacci Levels:
Conservative: 0.618, 1.0, 1.618
Extended: 2.618, 3.618, 4.618
Complete range: 0.0 to 4.764 (23 levels total)
Multi-Timeframe Functionality
One of the indicator's most powerful features is timeframe flexibility. You can analyze on one timeframe while using stop-loss and take-profit calculations from another.
Best Practices:
Identify your entry point on execution timeframe
Enable "Custom Anchor" mode
Set anchor timestamp to your entry bar
Select appropriate analysis timeframe
Choose relevant Fibonacci levels
Enable alerts for automated notifications
Example Scenario:
Analyse trend on 4-hour chart
Execute entry on 5-minute chart for precision
Set custom anchor to your 5-minute entry bar
Configure timeframe setting to "4h" for swing-level targets
Select appropriate Fibonacci Extension levels
Result: Precise entry with larger timeframe risk management
Visual Intelligence System
Line Behaviour in Custom Anchor Mode:
Active levels: Lines extend to the right edge
Hit levels: Lines terminate at the breaking bar
Entry line: Always visible in blue
Stop-loss: Red line, terminates when hit
Take-profits: Green lines (1.618 level in gold for emphasis)
Customisation Options:
Line width (1-4 pixels)
Show/hide individual Fibonacci levels
ATR length and smoothing method
ATR multiplier for stop-loss distance

AbdulLibraryLibrary "AbdulLibrary"
The library consists of three sections:
Technical Analysis Functions - A collection of tools commonly used by day traders
Trading Setup Filters Functions - A number of filters that help day traders to screen trading signals
Candlestick Pattern Detection Functions - To detect different candlestick patterns that are used in day trading setups
Note that this would have been possible without the help of @ZenAndTheArtOfTrading as I build-up this library after completing his pine script mastery course so big thanks to him
The content of the library are:-
fibLevels(preDayClose, preDayHigh, preDayLow) Calculates Daily Pivot Point and Fibonacci Key Levels
Parameters:
preDayClose : The previous day candle close
preDayHigh : The previous day candle high
preDayLow : The previous day candle low
Returns: Returns Daily Pivot Point and Fibonacci Key Levels as a tuple
bullishFib(canHigh, canLow, fibLevel) Calculates Fibonacci Levels in Bullish move
Parameters:
canHigh : The high of the move
canLow : The low of the move
fibLevel : The Fib level as % you want to calculate
Returns: Returns The Fib level for the Bullish move
bearishFib(canHigh, canLow, fibLevel) Calculates Fibonacci Levels in Bearish move
Parameters:
canHigh : The high of the move
canLow : The low of the move
fibLevel : The Fib level as % you want to calculate
Returns: Returns The Fib level for the Bearish move
getCandleSize() Calculates the size of candle (high - low) in points
Returns: Returns candle size in points
getCandleBodySize() Calculates the size of candle (close - open) in points
Returns: Returns candle body size in points
getHighWickSize() Calculates the high wick size of candle in points
Returns: Returns The high wick size of candle in points
getLowWickSize() Calculates the low wick size of candle in points
Returns: Returns The low wick size of candle in points
getBodyPercentage() Calculates the candle body size as % of overall candle size
Returns: Returns The candle body size as % of overall candle size
isSwingHigh(period) Checks if the price has created new swing high over a period of time
Parameters:
period : The lookback time we want to check for swing high
Returns: Returns True if the current candle or the previous candle is a swing high
isSwingLow(period) Checks if the price has created new swing low over a period of time
Parameters:
period : The lookback time we want to check for swing low
Returns: Returns True if the current candle or the previous candle is a swing low
isDojiSwingHigh(period) Checks if a doji is a swing high over a period of time
Parameters:
period : The lookback time we want to check for swing high
Returns: Returns True if the doji is a swing high
isDojiSwingLow(period) Checks if a doji is a swing low over a period of time
Parameters:
period : The lookback time we want to check for swing low
Returns: Returns True if the doji is a swing low
isBigBody(atrFilter, atr, candleBodySize, multiplier) Checks if a candle has big body compared to ATR
Parameters:
atrFilter : Check if user wants to use ATR to filter candle-setup signals
atr : The ATR value to be used to compare candle body size
candleBodySize : The candle body size
multiplier : The multiplier to be used to compare candle body size
Returns: Returns Boolean true if the candle setup is big
isSmallBody(atrFilter, atr, candleBodySize, multiplier) Checks if a candle has small body compared to ATR
Parameters:
atrFilter : Check if user wants to use ATR to filter candle-setup signals
atr : The ATR value to be used to compare candle body size
candleBodySize : The candle body size
multiplier : The multiplier to be used to compare candle body size
Returns: Returns Boolean true if the candle setup is small
isHammer(fibLevel, colorMatch) Checks if a candle is a hammer based on user input parameters and candle conditions
Parameters:
fibLevel : Fib level to base candle body on
colorMatch : Checks if user needs for the candel to be green
Returns: Returns Boolean - True if the candle setup is hammer
isShootingStar(fibLevel, colorMatch) Checks if a candle is a shooting star based on user input parameters and candle conditions
Parameters:
fibLevel : Fib level to base candle body on
colorMatch : Checks if user needs for the candel to be red
Returns: Returns Boolean - True if the candle setup is star
isBullEngCan(allowance, period) Check if a candle is a bullish engulfing candle
Parameters:
allowance : How many points the candle open is allowed to be off (To allow for gaps)
period : The lookback period for swing low check
Returns: Boolean - True only if the candle is a bullish engulfing candle
isBearEngCan(allowance, period) Check if a candle is a bearish engulfing candle
Parameters:
allowance : How many points the candle open is allowed to be off (To allow for gaps)
period : The lookback period for swing high check
Returns: Boolean - True only if the candle is a bearish engulfing candle
isBullDoji(maxSize, wickLimit, colorFilter) Check if a candle is a bullish doji candle
Parameters:
maxSize : Maximum candle body size as % of total candle size to be considered as doji
wickLimit : Maximum wick size of one wick compared to the other wick
colorFilter : Checks if the doji is green
Returns: Boolean - True if the candle is a bullish doji
isBearDoji(maxSize, wickLimit, colorFilter) Check if a candle is a bearish doji candle
Parameters:
maxSize : Maximum candle body size as % of total candle size to be considered as doji
wickLimit : Maximum wick size of one wick compared to the other wick
colorFilter : Checks if the doji is red
Returns: Boolean - True if the candle is a bearish doji
isBullOutBar() Check if a candle is a bullish outside bar
Returns: Boolean - True if the candle is a bullish outside bar
isInsideBar() Check if a candle is an inside bar
Returns: Returns Boolean - True if a candle is an inside bar

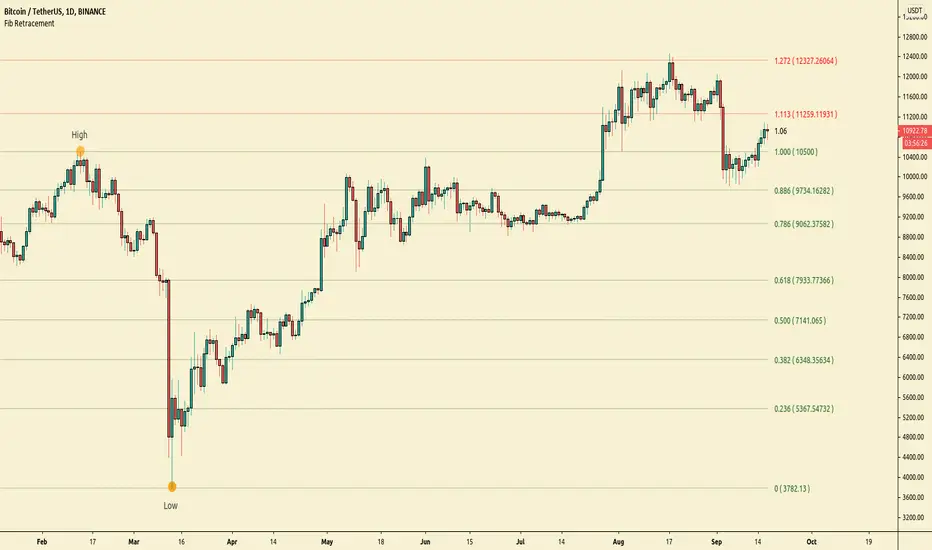
All time Fibonacci RetracementThis script calculates and plots the All time Fibonacci Retracement of the chart.
It's based on the ATH (All Time High) and the ATL (All Time Low).
Made simple, you can choose which levels you wanna plot in the parameters menu.
Enjoy !

Simple Fibonacci RetracementSimple Fibonacci Retracement is a free and easy to use script to plot Fibonacci levels, for any assets like Stocks, Forex, Commodities , Cryptocurrencies etc. on any time frame chart.
Fibonacci Levels can be plotted using Lookback or manual Price input from the settings.
1. Lookback type - Candles
Determines the High and Low price of the user input number of Candles back (100 default) and plots Fibonacci Levels based on the calculated High and Low for the number of candles in the past from the current candle. The levels stay intact on any time frame as long as no new Highs or Lows are formed.
2. Lookback type - Days
Determines the High and Low price of the user input number of Days back (100 default) and plots Fibonacci Levels based on the calculated High and Low for the number of days in the past from the day of the current bar. The levels stay intact on any time frame as long as no new Highs or Lows are formed.
3. Manual Price Input
Plots Fibonacci Levels based on the user specified High and Low Price in the settings input fields. The levels stay intact on any time frame irrespective of new Highs or Lows being formed. Manual Price Input will enable the trader to keep the Levels intact and visually see the higher Fibonacci Retracement levels, when the price crosses beyond 100% retracement. On the other two lookback types, the Fibonacci levels are displayed only upto 100% retracement.
The Fibonacci levels can also be reversed by enabling 'Reverse' option from the settings.