FOMC Federal Fund Rate Tracker [MHA Finverse]The FOMC Rate Tracker is a comprehensive indicator that visualizes Federal Reserve interest rate decisions and tracks market behavior during FOMC meeting periods. This tool helps traders analyze historical rate changes and anticipate market movements around Federal Open Market Committee announcements.
Key Features:
• Visual FOMC Periods - Automatically highlights each FOMC meeting period with colored boxes spanning from announcement to the next meeting
• Complete Rate Data - Displays actual rates, forecasts, previous rates, and rate differences for every meeting from 2021-2026
• Multiple Color Modes - Choose between cycle colors for visual distinction or rate difference colors (green for hikes, red for cuts, gray for holds)
• Smart Filtering - Filter periods by rate hikes only, cuts only, no change, or surprise moves to focus on specific market conditions
• Performance Metrics - Track average returns during rate hikes, cuts, and holds to identify historical patterns
• Volatility Analysis - Measure and compare price volatility across different FOMC periods
• Statistical Dashboard - View total hikes, cuts, holds, surprises, and longest hold streaks at a glance
• Built-in Alerts - Get notified 1 day before FOMC meetings, on meeting day, or when rates change
How It Works:
The indicator divides your chart into distinct periods between FOMC meetings, with each period showing a labeled box containing the meeting date, actual rate, forecast, previous rate, and rate difference. Future meetings are marked as "UPCOMING" to help you prepare for scheduled announcements.
Use Cases:
- Analyze how markets typically react to rate hikes vs. cuts
- Identify volatility patterns around FOMC announcements
- Backtest strategies based on monetary policy cycles
- Plan trades around upcoming Federal Reserve meetings
- Study the impact of surprise rate decisions on price action
Customization Options:
- Adjustable box transparency and outlines
- Customizable label sizes and colors
- Toggle individual dashboards on/off
- Filter specific types of rate decisions
- Configure alert preferences
This indicator is ideal for traders who incorporate fundamental analysis and monetary policy into their trading decisions. The historical data provides context for understanding market reactions to Federal Reserve actions.
FOMC

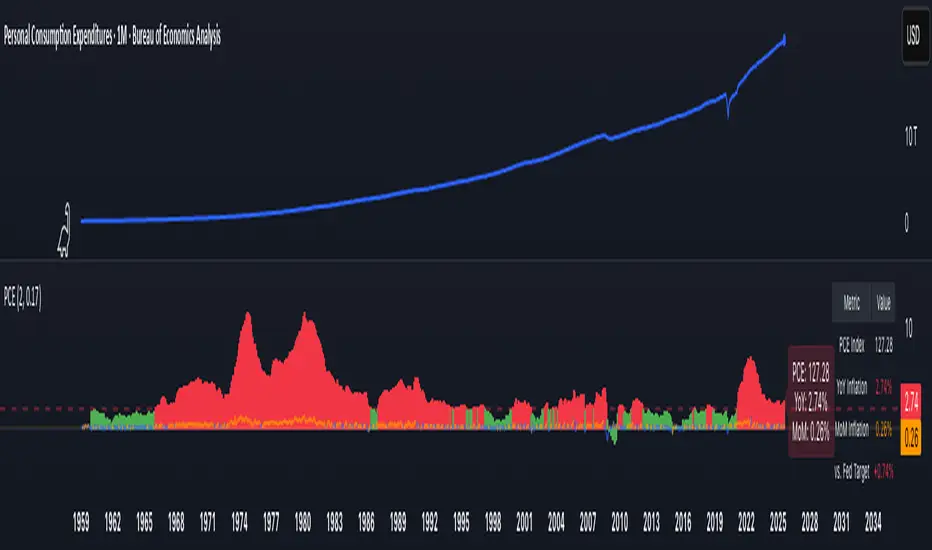
PCE Inflation Monitor (Change YoY & MoM)📊 PCE Inflation Monitor - The Fed's Most Important Metric
Personal Consumption Expenditures (PCE) is the Federal Reserve's preferred inflation measure and THE metric they target for their 2% inflation goal. If you want to predict Fed policy, you need to watch PCE.
🎯 KEY FEATURES:
- Dual Perspective Analysis:
- Year-over-Year (YoY): Histogram bars showing annual PCE inflation
- Month-over-Month (MoM): Line overlay showing monthly consumption price changes
- Visual Reference System:
- Dashed line at 2% (Fed's official PCE inflation target)
- Dotted line at 0.17% (equivalent monthly target)
- Color-coded bars: Red above Fed target, Green below target
- Real-Time Data Table:
- Current PCE Index value
- YoY inflation rate vs. Fed's 2% target
- MoM inflation rate with color coding
- Exact deviation from Fed target (critical for policy predictions)
- Automated Alerts:
- PCE crosses Fed's 2% target (major policy signal!)
- MoM crosses monthly target
- Stay informed of Fed-relevant inflation changes
📈 WHY PCE IS DIFFERENT (AND MORE IMPORTANT):
PCE vs. CPI differences:
- Flexible basket: PCE adjusts for substitution (beef → chicken if prices rise)
- Broader coverage: Includes healthcare paid by insurance/government
- Lower readings: Typically 0.2-0.4% below CPI
- Fed's choice: Explicitly stated as their target metric
Most importantly: When Powell speaks about "our 2% target," he means PCE, not CPI!
🔍 TRADING IMPLICATIONS:
PCE Above 2% (Red Zone):
→ Fed under pressure to maintain/raise rates
→ Hawkish policy stance likely
→ Negative for growth stocks, crypto
→ Positive for USD, bearish for gold
PCE Below 2% (Green Zone):
→ Fed has flexibility to cut rates
→ Dovish policy stance possible
→ Positive for risk assets, growth stocks
→ Negative for USD, bullish for commodities
PCE Approaching 2% from Above:
→ Fed "mission accomplished" narrative
→ Rate cut cycle becomes possible
→ Major bullish signal for equities/crypto
💡 ADVANCED STRATEGIES:
1. Fed Meeting Preparation: Check PCE before FOMC meetings for policy clues
2. Dot Plot Predictions: PCE trend determines Fed's rate forecast updates
3. Pivot Timing: When PCE MoM turns negative, Fed pivot becomes realistic
4. Press Conference Analysis: Compare Powell's comments to PCE deviation
🎯 KEY LEVELS TO WATCH:
- 2.0% YoY: Fed's official target - crossing this level is major news
- 2.5% YoY: "Uncomfortably high" - Fed forced to stay restrictive
- 3.0% YoY: "Crisis mode" - Fed turns very hawkish
- 1.5% YoY: "Below target" - Rate cuts become likely
🔄 COMBINE WITH:
- CPI: Public perception vs. Fed's metric (often diverge)
- Core PCE: Even more important (excludes food/energy volatility)
- Fed Funds Rate: Is Fed responding appropriately to PCE?
📊 DATA SOURCE:
Official PCE data from FRED (Federal Reserve Economic Data), updated monthly typically in the last week of each month (after CPI/PPI releases).
🎨 CUSTOMIZATION:
Fully customizable:
- Toggle YoY/MoM displays
- Adjust Fed target if needed
- Customize colors
- Show/hide absolute PCE values
Perfect for: Fed watchers, macro traders, policy analysts, and serious investors who want to predict monetary policy changes before they happen.
⚠️ CRITICAL INSIGHT: While media focuses on CPI, the Fed focuses on PCE. Trade what the Fed trades, not what the headlines say.
🎓 Pro Tip: Fed members often mention "Core PCE" (excluding food/energy). Consider adding that indicator alongside this one for complete Fed policy analysis.
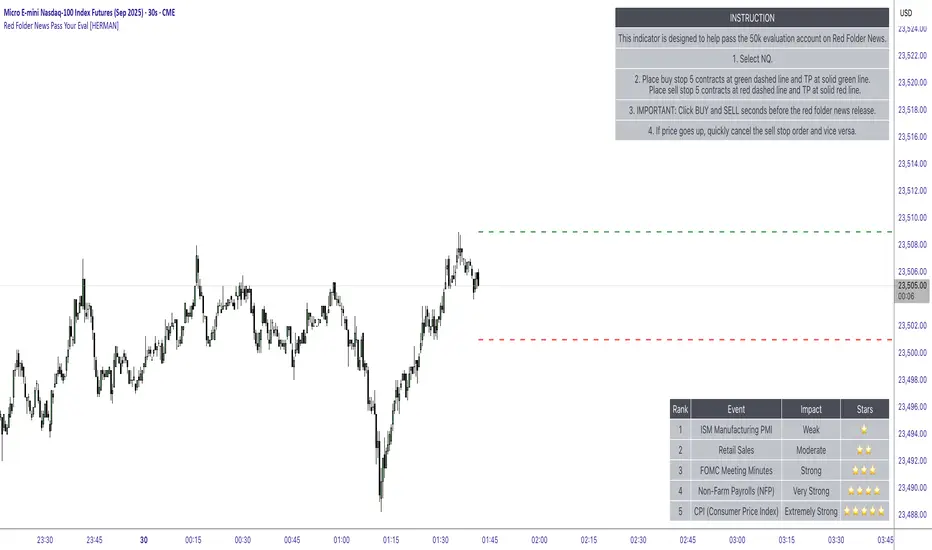
Red Folder News Pass Your Eval [HERMAN]Red Folder News Levels
This indicator provides visual reference levels around high-impact economic news events (commonly called “red folder” news) to help traders prepare for potential market volatility.
It is strictly educational and informational and does not place trades or guarantee any results.
What This Indicator Does:
-Plots dynamic price reference levels above and below the current market price.
-Displays Take Profit (TP) reference levels a fixed distance from the entry levels.
Shows optional on-chart tables:
Instruction Table – summarizes how to interpret the plotted levels.
Red Folder News Table – lists key economic events (CPI, NFP, FOMC, ISM, etc.) and ranks them by typical market impact.
Visual Elements on the Chart:
-Green Dashed Line → Upper reference level (potential long-side zone).
-Solid Green Line → Take-profit reference above the green dashed line.
-Red Dashed Line → Lower reference level (potential short-side zone).
-Solid Red Line → Take-profit reference below the red dashed line.
These levels update dynamically with each new bar, allowing you to see real-time visual guides around market-moving news releases.
Settings & What They Do:
-Entry Settings
-Manual Entry Offset (pts)
Distance in points above and below the current price to place the dashed reference levels.
Example: 4.0 means the green/red dashed lines appear 4 points above and below the current market price.
Instruction Table
Show Instruction Table (true/false)
If enabled, displays a step-by-step usage table on the top-right of the chart.
Explains how to interpret the visual levels in a simple flow.
Red Folder News Table
Show Red Folder News Table (true/false)
If enabled, displays a reference list of high-impact economic events on the bottom-right of the chart.
Events are ranked by market impact (⭐ to ⭐⭐⭐⭐⭐).
Theme Settings
Table Theme (Dark/Light)
Switch between a dark or light theme for all on-chart tables.
Adjusts the background and text colors to improve visibility depending on your chart style.
Note: The TP distance is fixed at 32 points and is automatically calculated from the entry lines.
How to Use (Educational Only)
Add the indicator to your chart and set your preferred Manual Entry Offset.
Check the Red Folder News Table to know which events typically generate higher volatility.
Observe the visual levels before high-impact economic releases.
Use them purely as reference zones for your own manual analysis and risk management.
⚠️ Disclaimer:
This script is for educational and informational purposes only.
It does not execute trades, provide financial advice, or guarantee performance.
Always trade responsibly and use your own judgment and risk management.
This description:
✅ Explains logic, visuals, and settings
✅ Avoids buy/sell instructions and profit promises
✅ Meets TradingView House Rules
Economic Event DatesThis TradingView indicator ("Economic Event Dates") plots significant economic event dates directly on your chart, helping you stay informed about potential market-moving announcements. It includes pre-configured dates for:
* **FOMC Meetings:** Key policy meetings of the Federal Open Market Committee.
* **CPI Releases:** Consumer Price Index data releases, a key measure of inflation.
* **Bitcoin Halvings:** Programmatic reductions in Bitcoin's new supply issuance.
**Features:**
* **Customizable Dates:** Easily input and manage dates for FOMC, CPI, and Halving events for current and future years (2025, 2026, and beyond for Halvings).
* **Visual Cues:** Displays vertical lines on the chart at the precise time of each event.
* **Event Labels:** Shows clear labels (e.g., "FOMC", "CPI", "Halving") for each event line.
* **Color Coding:** Distinct colors for FOMC (blue), CPI (orange), and Halving (purple) events for quick identification.
* **Future Events Focus:** Option to display only upcoming events relative to the current real time.
* **Morning Alerts:** (Optional) Triggers an alert on the morning of a scheduled event, providing a timely reminder.
* **Customizable Appearance:** Adjust line width and toggle label visibility.
**How to Use:**
1. Add the indicator to your TradingView chart.
2. Review and update the input dates for FOMC, CPI, and Halving events in the indicator settings. The script includes placeholders and notes for future dates that may require verification from official sources (e.g., federalreserve.gov, bls.gov).
3. Customize colors, line width, label visibility, and alert preferences as needed.
4. Observe the vertical lines on your chart indicating upcoming economic events.
This tool is designed for traders and investors who want to incorporate awareness of major economic events into their market analysis. Remember to verify future event dates as they are officially announced.
Created by YouNesta
Interest Rate Trading (Manually Added Rate Decisions) [TANHEF]Interest Rate Trading: How Interest Rates Can Guide Your Next Move.
How were interest rate decisions added?
All interest rate decision dates were manually retrieved from the 'Record of Policy Actions' and 'Minutes of Actions' on the Federal Reserve's website due to inconsistent dates from other sources. These were manually added as Pine Script currently only identifies rate changes, not pauses.
█ Simple Explanation:
This script is designed for analyzing and backtesting trading strategies based on U.S. interest rate decisions which occur during Federal Open Market Committee (FOMC) meetings, to make trading decisions. No trading strategy is perfect, and it's important to understand that expectations won't always play out. The script leverages historical interest rate changes, including increases, decreases, and pauses, across multiple economic time periods from 1971 to the present. The tool integrates two key data sources for interest rates—USINTR and FEDFUNDS—to support decision-making around rate-based trades. The focus is on identifying opportunities and tracking trades driven by interest rate movements.
█ Interest Rate Decision Sources:
As noted above, each decision date has been manually added from the 'Record of Policy Actions' and 'Minutes of Actions' documents on the Federal Reserve's website. This includes +50 years of more than 600 rate decisions.
█ Interest Rate Data Sources:
USINTR: Reflects broader U.S. interest rate trends, including Treasury yields and various benchmarks. This is the preferred option as it corresponds well to the rate decision dates.
FEDFUNDS: Tracks the Federal Funds Rate, which is a more specific rate targeted by the Federal Reserve. This does not change on the exact same days as the rate decisions that occur at FOMC meetings.
█ Trade Criteria:
A variety of trading conditions are predefined to suit different trading strategies. These conditions include:
Increase/Decrease: Standard rate increases or decreases.
Double/Triple Increase/Decrease: A series of consecutive changes.
Aggressive Increase/Decrease: Rate changes that exceed recent movements.
Pause: Identification of no changes (pauses) between rate decisions, including double or triple pauses.
Complex Patterns: Combinations of pauses, increases, or decreases, such as "Pause after Increase" or "Pause or Increase."
█ Trade Execution and Exit:
The script allows automated trade execution based on selected criteria:
Auto-Entry: Option to enter trades automatically at the first valid period.
Max Trade Duration: Optional exit of trades after a specified number of bars (candles).
Pause Days: Minimum duration (in days) to validate rate pauses as entry conditions. This is especially useful for earlier periods (prior to the 2000s), where rate decisions often seemed random compared to the consistency we see today.
█ Visualization:
Several visual elements enhance the backtesting experience:
Time Period Highlighting: Economic time periods are visually segmented on the chart, each with a unique color. These periods include historical phases such as "Stagflation (1971-1982)" and "Post-Pandemic Recovery (2021-Present)".
Trade and Holding Results: Displays the profit and loss of trades and holding results directly on the chart.
Interest Rate Plot: Plots the interest rate movements on the chart, allowing for real-time tracking of rate changes.
Trade Status: Highlights active long or short positions on the chart.
█ Statistics and Criteria Display:
Stats Table: Summarizes trade results, including wins, losses, and draw percentages for both long and short trades.
Criteria Table: Lists the selected entry and exit criteria for both long and short positions.
█ Economic Time Periods:
The script organizes interest rate decisions into well-defined economic periods, allowing traders to backtest strategies specific to historical contexts like:
(1971-1982) Stagflation
(1983-1990) Reaganomics and Deregulation
(1991-1994) Early 1990s (Recession and Recovery)
(1995-2001) Dot-Com Bubble
(2001-2006) Housing Boom
(2007-2009) Global Financial Crisis
(2009-2015) Great Recession Recovery
(2015-2019) Normalization Period
(2019-2021) COVID-19 Pandemic
(2021-Present) Post-Pandemic Recovery
█ User-Configurable Inputs:
Rate Source Selection: Choose between USINTR or FEDFUNDS as the primary interest rate source.
Trade Criteria Customization: Users can select the criteria for long and short trades, specifying when to enter or exit based on changes in the interest rate.
Time Period: Select the time period that you want to isolate testing a strategy with.
Auto-Entry and Pause Settings: Options to automatically enter trades and specify the number of days to confirm a rate pause.
Max Trade Duration: Limits how long trades can remain open, defined by the number of bars.
█ Trade Logic:
The script manages entries and exits for both long and short trades. It calculates the profit or loss percentage based on the entry and exit prices. The script tracks ongoing trades, dynamically updating the profit or loss as price changes.
█ Examples:
One of the most popular opinions is that when rate starts begin you should sell, then buy back in when rate cuts stop dropping. However, this can be easily proven to be a difficult task. Predicting the end of a rate cut is very difficult to do with the the exception that assumes rates will not fall below 0.25%.
2001-2009
Trade Result: +29.85%
Holding Result: -27.74%
1971-2024
Trade Result: +533%
Holding Result: +5901%
█ Backtest and Real-Time Use:
This backtester is useful for historical analysis and real-time trading. By setting up various entry and exit rules tied to interest rate movements, traders can test and refine strategies based on real historical data and rate decision trends.
This powerful tool allows traders to customize strategies, backtest them through different economic periods, and get visual feedback on their trading performance, helping to make more informed decisions based on interest rate dynamics. The main goal of this indicator is to challenge the belief that future events must mirror the 2001 and 2007 rate cuts. If everyone expects something to happen, it usually doesn’t.

v01 remindersTrading requires focus, discipline, and sometimes a reminder to stay on track.
Many of us know how to take trades and make money - but sometimes struggle to hold on to the gains. By knowing not only when to trade, but also when NOT to trade, we can begin to build better habits.
I built this indicator for my own needs, but I hope this indicator can help someone save money by reminding them when to step away, size down or stay on track.
Inspired by trading psychologists like Mark Douglas, David Paul and others, I decided to make an indicator that deals with the mental aspect of trading.
Dr. David Paul said that you can be 10-15 trades away from the trader you want to be. All it takes is 10-15 trades of doing only the right thing (erasing bad habits). After that time the resistance to execute the trades properly will improve even more.
Good trading should be boring and repetitive. If the trading is exciting and varied it is likely unprofitable (more akin to impulsive gambling).
Perhaps you know how to trade, yet keep trading impulsively sometimes, getting "the itch" to trade or gambling with your gains? Set some reminders and see if you can build better habits. Over time it could make a difference.
You can enable up to 10 different reminders with each instance of the indicator. You can select days of the week and time of day. The visibility is fully customizable to suit any colour theme you may want. They dont actually alert - its a silent visual reminder, which is less intrusive and stays on screen for as long as you want.
Remind yourself when CPI releases or bond auctions are about to hit.
Don't get caught off guard by FED speakers or FOMC announcements.
Manage your emotions by writing a motivational reminder.
Build better habits and stay disciplined with reminders not to gamble.
Remind yourself to stay away from the markets when there is low liquidity, and trade during your best hours.
Wait for the market to establish balance and let the text show when to either wait or when to start trading.
Some basic inspiration:
"FOMC - No trading!"
"CPI Data - Expect Volatility"
"Markets closed tomorrow - Plan ahead"
"Take it slow, it's a marathon, not a sprint." - Dakota
"Wait for cheap risk" - HOAG
"Don't diddle in the middle!" - Brian Watts
You can of course write anything you want. Maybe you would like to remind yourself of a specific algo in crude oil or gold, or have other motivational reminders that work for you. If you have any good suggestions put them in the comments for others to use.
You can also use the script to watermark or put a web link on your charts. The indicator is empty by default - the image is just an example of the different types of labels it can show.
Customize the reminders for specific days, times, and events. Position them anywhere on your chart to suit your workflow. Whether you're a day trader or a long-term investor, theres always things to improve. This lets you keep those reminders right on your charts. You can go into the object tree settings and drag the indicator to the top if you want it to hide the candlesticks, and size up the text to really make it cover the chart for when to really stay away, as in the "FOMC" example in the image. The sample image shows a couple of different labels - but the script has no texts by default. It is up to you what to write and what colours to use. Please share it with others that may benefit.
You can add the script more than once if you need more than 10 alerts. You can also use it on multiple panels in TradingView, and it will remember the reminders for each panel. You can use spaces when positioning text in the top and bottom left corners of the screen, where there is sometimes a logo or ticker name obscuring the text. If two reminders display in the same location it will default to show the higher number of the two. Use specific times to change the reminders to make sure they dont overlap if they have the same position and put them on multiple charts if needed.
This script is dedicated to Brian Watts, who started something in me when he kept repeating "Don't diddle in the middle!" and "Where is purple?". IYKYK. I would like to thank him for the inspiration to better myself.
As above, so below.
v01

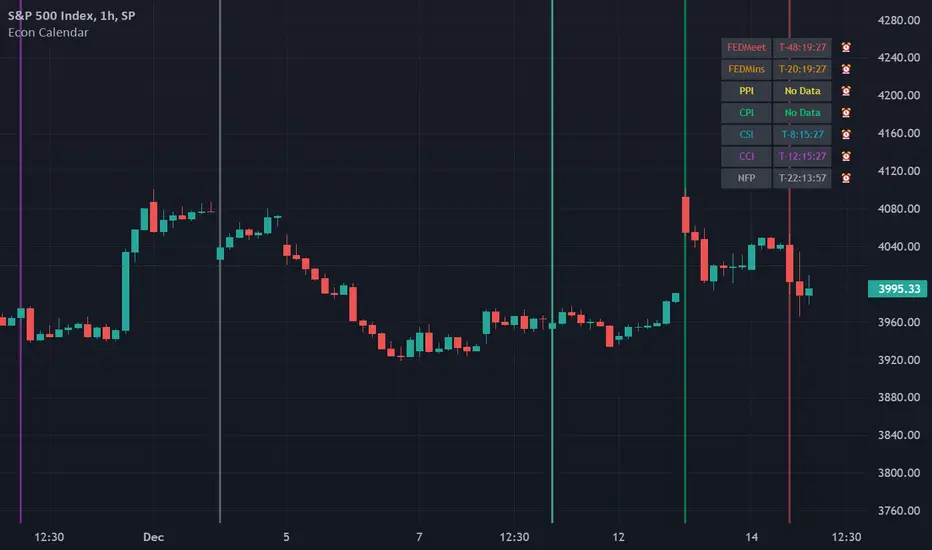
Economic Events: FOMC, CPI, PPI, NFP, etcThis script plots vertical lines on major U.S. economic events that can impact a trading day. Allowing you to decide if you want to trade on that day or to help with back testing (limited in how far back one can go).
The indicator preview chart doesn't show the vertical lines for whatever reason.
Here is a snapshot image.
This is completely different code from Economic Calendar Events: FOMC, CPI, and more by @jdehorty and uses different logic but provides similar features using the same public library for U.S. economic events.
Differences:
Substantial Improved Performance.
Legend setting to only show when there is an event today.
Abbreviations for events.
More Legend Settings (Position, Text Size, Color...)
WARNING: Does NOT use the same 'built-in logic to retroactively adjust larger time intervals' , so possible there could be differences but shouldn't be. No noticeable difference on USDJPY.
Note: Was purposely made to not work on timeframes greater than one day.
Economic Events
FOMC Meetings
FOMC Minutes
Producer Price Index (PPI)
Consumer Price Index (CPI)
Consumer Sentiment Index (CSI)
Consumer Confidence Index (CCI)
Non-Farm Payroll (NFP)
To read a description of the economic events see Economic Calendar Events: FOMC, CPI, and more by @jdehorty
This script uses economic data from Library "EconomicCalendar" and will be updated when said library is updated.

Odd_mod Econ CalendarA modification of Economic Calendar Events: FOMC, CPI, and more written by jdehorty . Please send all tips his way as he is maintaining the underlying data for the Calendar and the original concept.
List of changes:
Optimized code, will only run once on initialization now(No random line in middle of screen on bar change)
Legend - Added short names
Legend - Removed header
Legend - Made repositionable with selectable top margins
Legend - Removed data name from legend when it is disabled
Legend - Removed border
Original Description by jdehorty :
This script plots major events from the Economic Calendar that often correspond to major pivot points in various markets. It also includes built-in logic to retroactively adjust larger time intervals (i.e. greater than 1 hour) to be correctly aligned with the interval during which the event occurred.
Events are taken from the Economic Calendar and will be updated periodically at the following library:
EconomicCalendar
The above library can be used to conveniently access date-related data for major Meetings, Releases, and Announcements as integer arrays, which can be used in other indicators. Currently, it has support for the following events:
FOMC Meetings
The FOMC meets eight times a year to determine the course of monetary policy . The FOMC's decisions are based on a review of economic and financial developments and its assessment of the likely effects of these developments on the economic outlook.
FOMC Minutes
The FOMC minutes are released three weeks after each FOMC meeting. The minutes provide a detailed account of the FOMC's discussion of economic and financial developments and its assessment of the likely effects of these developments on the economic outlook.
Producer Price Index (PPI) Releases
The Producer Price Index (PPI) measures changes in the price level of goods and services sold by domestic producers. The PPI is a weighted average of prices of a basket of goods and services, such as transportation, food, and medical care. PPI is a leading indicator of CPI .
Consumer Price Index ( CPI ) Releases
The Consumer Price Index ( CPI ) measures changes in the price level of goods and services purchased by households. The CPI is a weighted average of prices of a basket of consumer goods and services, such as transportation, food, and medical care. CPI is one of the most widely used measures of inflation .
Consumer Sentiment Index ( CSI ) Releases
The University of Michigan's Consumer Sentiment Index ( CSI ) is a measure of consumer attitudes about the economy. The CSI is based on a monthly survey of U.S. households and reflects the consumers' assessment of present and future economic conditions. The CSI is a leading indicator of consumer spending, which accounts for about two-thirds of U.S. economic activity.
Consumer Confidence Index ( CCI ) Releases
The Consumer Confidence Index is a survey that measures how optimistic or pessimistic consumers are regarding their expected financial situation.
Non-Farm Payroll (NFP) Releases
The Non-Farm Payroll (NFP) is a measure of the change in the number of employed persons, excluding farm workers and government employees. The NFP is a leading indicator of consumer spending, which accounts for about two-thirds of U.S. economic activity.
Economic Calendar (Import from Spreadsheet)This script draws vertical lines to mark Economic Calendar Events.
Datetime of events is defined by user in Settings via a standardized line of text.
Motivation for coding this script:
All traders should be aware of economic calendar events. At times, when you really need to pay attention to an upcoming major event, you might even decide to use the vertical-line drawing tool to mark it. However, this takes manual effort.
This script provides a solution to performing mundane tasks such as drawing vertical lines and dragging them ever so slightly, just to have them approximately aligned with exact time.
Parameters:
(1) Source data - String representation of collection of datetime referencing to Economic Calendar Events
(2) Line color, & (3) Width of line - For displaying vertical lines drawn by script.
Standardized format for Source Data :
Example:
If 'GMT;2022,6,1,14,0,0;2022,6,2,12,15,0;' is provided to PineScript, then two vertical lines will be drawn on June 6, 2022 according to the exact time in 'YYYY,MM,DD,hh,mm,ss' format at the specified timezone (GMT in this case).
Template for Source Data :
Included here, link below, is a shared Google Sheet that systematically processes Economic Calendar data provided in the 'Raw Data' tab.
drive.google.com
Users are advised to use their preferred methods* to format the string (for source data param.), and apply their own criteria to sort down the Events. (ie. only include Events of High Impact, etc.)
* Preferred methods (as mentioned above) does not mean being limited to using the template as provided in this post.

Economic Calendar Events: FOMC, CPI, and moreThis script plots major events from the Economic Calendar that often correspond to major pivot points in various markets. It also includes built-in logic to retroactively adjust larger time intervals (i.e. greater than 1 hour) to be correctly aligned with the interval during which the event occurred.
Events are taken from the Economic Calendar and will be updated periodically at the following library:
The above library can be used to conveniently access date-related data for major Meetings, Releases, and Announcements as integer arrays, which can be used in other indicators. Currently, it has support for the following events:
FOMC Meetings
The FOMC meets eight times a year to determine the course of monetary policy. The FOMC's decisions are based on a review of economic and financial developments and its assessment of the likely effects of these developments on the economic outlook.
FOMC Minutes
The FOMC minutes are released three weeks after each FOMC meeting. The minutes provide a detailed account of the FOMC's discussion of economic and financial developments and its assessment of the likely effects of these developments on the economic outlook.
Producer Price Index (PPI) Releases
The Producer Price Index (PPI) measures changes in the price level of goods and services sold by domestic producers. The PPI is a weighted average of prices of a basket of goods and services, such as transportation, food, and medical care. PPI is a leading indicator of CPI.
Consumer Price Index (CPI) Releases
The Consumer Price Index (CPI) measures changes in the price level of goods and services purchased by households. The CPI is a weighted average of prices of a basket of consumer goods and services, such as transportation, food, and medical care. CPI is one of the most widely used measures of inflation.
Consumer Sentiment Index (CSI) Releases
The University of Michigan's Consumer Sentiment Index (CSI) is a measure of consumer attitudes about the economy. The CSI is based on a monthly survey of U.S. households and reflects the consumers' assessment of present and future economic conditions. The CSI is a leading indicator of consumer spending, which accounts for about two-thirds of U.S. economic activity.
Consumer Confidence Index (CCI) Releases
The Consumer Confidence Index is a survey that measures how optimistic or pessimistic consumers are regarding their expected financial situation.
Non-Farm Payroll (NFP) Releases
The Non-Farm Payroll (NFP) is a measure of the change in the number of employed persons, excluding farm workers and government employees. The NFP is a leading indicator of consumer spending, which accounts for about two-thirds of U.S. economic activity.

EconomicCalendarLibrary "EconomicCalendar"
This library is a data provider for important dates and times from the Economic Calendar.
events()
Returns the list of dates supported by this library as a string array.
Returns: array : Names of events supported by this library
fomcMeetings()
Gets the FOMC Meeting Dates. The FOMC meets eight times a year to determine the course of monetary policy. The FOMC announces its decision on the federal funds rate at the conclusion of each meeting and also issues a statement that provides information on the economic outlook and the Committee's assessment of the risks to the outlook.
Returns: array : FOMC Meeting Dates as timestamps
fomcMinutes()
Gets the FOMC Meeting Minutes Dates. The FOMC Minutes are released three weeks after each FOMC meeting. The Minutes provide information on the Committee's deliberations and decisions at the meeting.
Returns: array : FOMC Meeting Minutes Dates as timestamps
ppiReleases()
Gets the Producer Price Index (PPI) Dates. The Producer Price Index (PPI) measures the average change over time in the selling prices received by domestic producers for their output. The PPI is a leading indicator of CPI, and CPI is a leading indicator of inflation.
Returns: array : PPI Dates as timestamps
cpiReleases()
Gets the Consumer Price Index (CPI) Rekease Dates. The Consumer Price Index (CPI) measures changes in the price level of a market basket of consumer goods and services purchased by households. The CPI is a leading indicator of inflation.
Returns: array : CPI Dates as timestamps
csiReleases()
Gets the CSI release dates. The Consumer Sentiment Index (CSI) is a survey of consumer attitudes about the economy and their personal finances. The CSI is a leading indicator of consumer spending.
Returns: array : CSI Dates as timestamps
cciReleases()
Gets the CCI release dates. The Conference Board's Consumer Confidence Index (CCI) is a survey of consumer attitudes about the economy and their personal finances. The CCI is a leading indicator of consumer spending.
Returns: array : CCI Dates as timestamps
nfpReleases()
Gets the NFP release dates. Nonfarm payrolls is an employment report released monthly by the Bureau of Labor Statistics (BLS) that measures the change in the number of employed people in the United States.
Returns: array : NFP Dates as timestamps

FOMC AnnouncementsThis indicator plots vertical lines at the scheduled times of US Federal Reserve's FOMC Meeting Announcements. Usually, that time or the 24 hours before and after could see big moves in markets. You can change those dates and times in the settings, and could use the indicator option "Add this indicator to entire layout" if you want to easily reflect that across all panes of a layout. Those lines will show on any symbol you switch to, saving you time and effort of drawing them manually.

FOMC Federal Open Market Committee SpacemanBTCDifferent to my usual work, just wanted to put this out there in case it can help anyone else.
This indicator is just to see the relevance of FOMC (Federal Open Market Committee),highlighting
the day they start their meetings in reflection on a price chart may prove usable data for macro analysis.
Shows 2021 Federal Open Market Committee days highlight.
Option to enable / disable 2022 Federal Open Market Committee days.
Source: www.federalreserve.gov
Color can be changed to suit your chart

FedView米連邦公開市場委員会(FOMC)における金利誘導目標変更確率(利下げ/利上げ・据え置きの市場における織り込み度合い)を描画するTradingView用のインジケータ。FedWatchのTradingView版です。
