***FOREX PILOT PRO STRATEGY INVITE SCRIPT***This Script Is Purely Created For Forex Trading XAUUSD Pair In 3 Mins Time Frame. This Script Tells When To Buy And Sell With Stop Loss, Take Profit Levels 1, 2 & 3.
Forextrading

Forex Midpoint Stratejisi For Nasdaq English Knowledge:
Midpoint Strategy;
The general calculation method is a strategy that helps determine direction by the intersection of a MA line and the value obtained by dividing the lowest and highest price in the specified length range.
Başlangıç Periyodu: The data length of the Midpoint Line.
Kaydırma Seviyesi: The number of steps forward or backward of the Midpoint Line.
Yüzde Seviyesi: the amount of vertical scrolling.
Uzunluk: The length of the MA line
represents.
This strategy is prepared for the Nasdaq 5-minute period. It needs to be optimized for use on other instruments.
There are take profit and stop loss levels within the codes. Friends who want to use it can remove the invisibility from the relevant sections. Also, I removed the midpoint and the MA line so that it does not crowd the image, you can add it if you want.
Thank you.
Turkish Knowledge:
Midpoint Stratejisi;
Genel hesaplama yöntemi, belirlenen uzunluk aralığındaki en düşük ve en yüksek fiyatın ikiye bölümü ile elde edilen değer ve bir ortalama çizgisinin kesişimleriyle yön belirlemeye yardımcı bir stratejidir.
Başlangıç Period: Midpoint Çizgisinin veri uzunluğunu.
Kaydırma Seviyesi: Midpoint Çizgisinin ileri veya geri adım sayısını.
Yüzde Seviyesi: dikey kaydırma miktarını.
Uzunluk: Ortalama çizgisinin uzunluğunu
temsil etmektedir.
Bu strateji Nasdaq 5 dakikalık periot için hazırlanmıştır. Diğer enstrümanlarda kullanılması için optimize edilmesi gerekir.
Kodların içinde Kar alma , zarar durdurma seviyeleri mevcuttur. Kullanmak isteyen arkadaşlar ilgili bölümlerden görünmezliği kaldırabilirler. ayrıca midpoint ve ortalama çizgisinide görüntü kalabalığı yapmaması için ben kaldırdım isterseniz siz ekleyebilirsiniz.
Teşekkürler.

Point of possible Reversal (PPR): forex Strategypoint of possible Reversal, PPR :
in this strategy I have tried to find out the possible Reversal points in the forex pairs. It’s the most resisted levels from where the trend takes up a particular direction. These PPR can lead the price in any direction depending upon the time zone its happening in.
In this strategy once the code finds a PPR it then checks for suitable time zone then it checks for the RSI confirmation, it checks for the Parkinson Volatility, it checks for internal Bar Strength (refer below for more information)
The following setting details will help you in the understanding the strategy and indicator used:
This indicator contains the following setting:
1.Fixed trading sessions for Long and Short
i. Fixed trading session for long trades (long position can be taken in that period of time only)
ii. Fixed trading session for short trades (Short position can be taken in that period of time only)
The concept behind restricting the time to go long or short is because in forex the particular pair move in a particular direction depending upon the currency and time zones.
This strategy works on different forex pairs, you need to find the best settings. I will be providing the best settings which works for this strategy and different pairs.
2.Setting for back test selection date range you can check the beck test of a particular time range.
3.You can check Long and Short positions performance separately, by unchecking the “ Go_long ” option it will remove all long positions from back test. Vice versa for “ Go_short "option
4.Internal Bar Strength
IBS is simply an indicator where you buy on weakness and sell on strength, the cornerstone of any mean-reverting strategy.
It oscillates from zero to one and measures the relative position of the closing price relative to the High and Low.
IBS = (Close – Low) / (High – Low)
In the input setting the you can disable enable the IBS option from the strategy.
5. Parkinson volatility
Parkinson volatility is a volatility measure that uses the stock’s high and low price of the day (can be changed in the setting, instead of day it can be set to any bar length)
The main difference between regular volatility and Parkinson volatility is that the latter uses high and low prices for a day, rather than only the closing price.
In the setting you have three option
1. Enter Volatility Threshold
If the Parkinson volatility value is greater than the the threshold value then it lets the trade happen.
2.Set the high/low bar time frame for calculating Parkinson volatility. ( Set 60m by default)
Formula used as below:
high_=security(syminfo.ticker, input("60"), high)
low_=security(syminfo.ticker, input("60"), low)
hourlyRangeSquared = pow((log(high_) - log(low_)), 2)
dailyParkinsonVol = sqrt(sum(hourlyRangeSquared, 24) / (4 * log(2)))
6. "Enter no of contract size"
This setting helps you to set the contract size , by default it is set to 100000.
7.This setting is for the PPR, in this you can change the search of PPR in another time frame, you can add higher timeframe PPR in the chart, by default the PPR is set to search for current time frame PPR.
8.Futrther confirmation of trade is done through the RSI criteria . In this I have provided four kind of RSI confirmation you can test all by selecting any one of the four.
1. filter trade on the basis of BB of RSI (as shown in the image)
2. filter trade on the basis of RSI Levels (RSI>50 for long, vice versa for short)
3. filter trade by rsi>basis of BB of RSI(for long) & rsi<50(for short)
4. filter trade by rsi>50(long) & rsi< basis of BB of RSI(short)
SELECT ONLY ONE OF THE ABOVE IN SETTING.
9.For Exiting the trade I have used the trailing SL you can change it in setting.
You can exit the trade using two targets (two take profit) using different size for editing the trade.
If you want to take only on target then you have to make QANTITY of shares for 1st Exit as 100. Then you will exit all your position in the first target achieved.
A big thanks to kodify.net there articles are very helpful kodify.net
Thanks to stack overflow community for clearing the doubts.
Thanks to Mickey for providing assistance.
Trading view official documentation on V4 of pine script also helped me.

Break of structure (BOS) forex StrategyPlease read all Details before using this indicator
This strategy is based on taking position after the break of a Previous High/Low swing happens (fixed time frame), the break of structure happens because of the swing happens then we go long or short respectively in this strategy.
I will be discussing the setting details through which you can make it work on different forex pairs.
Does it work on other pairs?
Yes, I have found similar back test results on other USD pairs.
Does it works on smaller time frame?
Yes it does work on smaller time frame , you have to understand the below concepts used and try different settings.
For the user the most important thing is to understand the settings of the indicator so that they can optimize the setting and get the best results:
This indicator contains the following IMPORTANT setting:
i. Fixed trading session for long trades (long position can be taken in that period of time only)
ii. Fixed trading session for short trades (Short position can be taken in that period of time only)
The concept behind restricting the time to go long or short is because in forex the particular pair move in a particular direction depending upon the currency and time zones.
This strategy works on different forex pairs, you need to find the best settings. I will be providing the best settings which works for this strategy and different pairs.
2. Choose Previous High/Low Timeframe
This is the most important option where you have to choose the timeframe for which you want H/L by default it is set to “D”. This timeframe H/L reference will be taken for taking trading decisions.
3.Setting for back test selection date range you can check the beck test of a particular time range.
4.You can check Long and Short positions performance separately, by unchecking the “Go_long” option it will remove all long positions from back test. Vice versa for “Go_short option”
5.Internal Bar Strength
IBS is simply an indicator where you buy on weakness and sell on strength, the cornerstone of any mean-reverting strategy.
It oscillates from zero to one and measures the relative position of the closing price relative to the High and Low.
IBS = (Close – Low) / (High – Low)
In the input setting the you can disable enable the IBS option from the strategy.
6. Parkinson volatility
Parkinson volatility is a volatility measure that uses the stock’s high and low price of the day (can be changed in the setting, instead of day it can be set to any bar length)
The main difference between regular volatility and Parkinson volatility is that the latter uses high and low prices for a day, rather than only the closing price.
In the setting you have three option
i. Enter Volatility Threshold
If the Parkinson volatility value is greater than the the threshold value then it lets the trade happen.
ii.Set the high/low bar time frame for calculating Parkinson volatility. ( Set 60m by default)
Formula used as below:
high_=security(syminfo.ticker, input("60"), high)
low_=security(syminfo.ticker, input("60"), low)
hourlyRangeSquared = pow((log(high_) - log(low_)), 2)
dailyParkinsonVol = sqrt(sum(hourlyRangeSquared, 24) / (4 * log(2)))
7. "Enter no of contract size"
This setting helps you to set the contract size , by default it is set to 100000.
8. “Zigzag Filter Length” this setting is for SWING H/L Lookback. With the help of this I have ploted Swing Support and Resistance.
9.Futrther confirmation of trade is done through the RSI criteria. In this I have provided four kind of RSI confirmation you can test all by selecting any one of the four.
i. filter trade on the basis of BB of RSI (as shown in the image)
ii. filter trade on the basis of RSI Levels (RSI>50 for long, vice versa for short)
iii. filter trade by rsi>basis of BB of RSI(for long) & rsi<50(for short)
iv. filter trade by rsi>50(long) & rsi< basis of BB of RSI(short)
SELECT ONLY ONE OF THE ABOVE IN SETTING.
10.For Exiting the trade I have used the trailing SL you can change it in setting.
You can exit the trade using two targets (two take profit) using different size for exiting the trade.
If you want to take only on target then you have to make QANTITY of shares for 1st Exit as 100. Then you will exit all your position in the first target.
A big thanks to kodify.net there articles are very helpful kodify.net
Thanks to Mickey for providing assistance.
Thanks to stack overflow community for clearing the doubts.
Trading view official documentation on V4 of pine script also helped me.

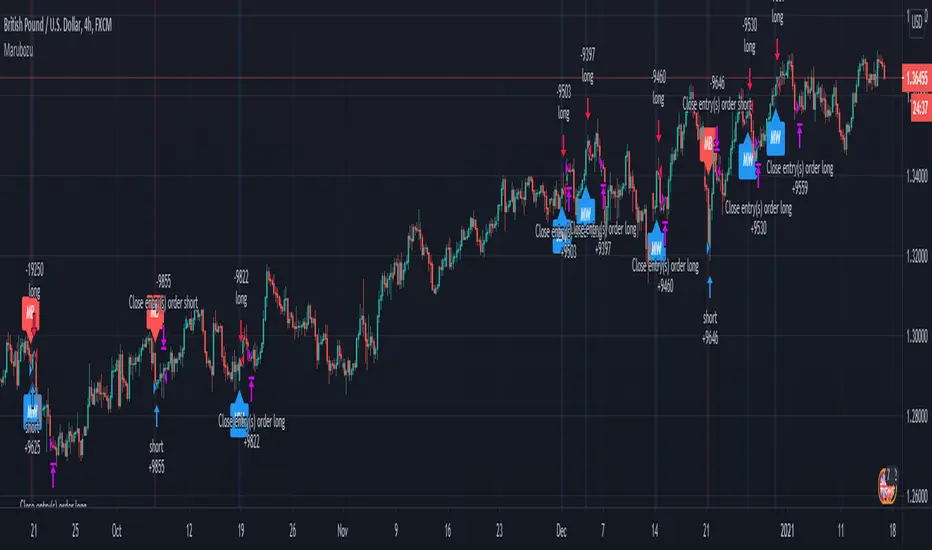
Marubozu Forex Price actionHi, today I bring you a price action strategy/indicator for Forex, made out for Marubozu candle type.
For the entries of it check if we have a long or a short marubozu.
For exit we have for long when the actual candle is green and the last previous two were red.
For exit we have for short, when the actual candle is red and the last previous two were green.
If you have any questions private message me !
Forex SWING TraderThis strategy is mainly designed for swing trading applied to FOREX.
In this case we make use of 2 moving averages but with different time frame, lets say 1h and 1 day.
When they cross above we would initially have a long trade, but in this strategy we trade it in reverse, so we would actually enter a short position.
The same for short trade.
At the same time we make use of hours for entry, so we can filter even better between the trades, and select the best possible hours for entries.
For exit we have 2 conditions : one is when we receive an opposite signal ( by default ).
The other is when a certain movement between moving averages, like lets say 1% of price movement, we will exit. This can act both as TP and SL.

PowerBot Binary Backtest FrameworkHello Traders,
This is the backtest framework for testing the Powerbot algorithm before activating alerts which can be used for precise Trading.
Powerbot can be used across any timeframe and across any expiration based on the performance
This backtest comes with some features to help traders make a decision on the following:
When using the indicator itself.
1. We use our proprietary algorithm - "Powerbot binary algorithm script", which is Public but can only be accessed based on request. If you would like to use the algorithm please ensure you have tested different assets and varying expiration for your trades through the backtest - if you don't know how to do that please contact us by sending a message.
EXPLORE YOUR OPTIONS FOR TRADING THROUGH VARIED ITERATION.
2. You can choose any expiration time by changing the expiration time period from the 'settings' button, this will display new results. example; on a 5 minutes chart timeframe, 6 bars would be 30 minutes, which means 5 minutes times 6, which is 30 and minutes because your timeframe is set to minutes. Another example is that on a 1-hour timeframe, 12 bars would be 12 hours, given 1 * 12 is 12hours, because your timeframe is set to hours.
3. You can choose the trading session you want, please note that we have included the three most active sessions - ASIAN, EU/UK, & US Session, by default, the scripts checks for performance on 24/7, which means it does not omit trades outside of the trading session. The Tradingview time is in UTC (or GMT -4). The best times to trade are during sessions most active times.
This backtesting indicator is free to add to the chart if you would like to use the algorithm during your trading session you need to contact us. After which you can use the algorithm for as long as you want.
Please note that no signal can work in all timeframe across all markets that is why backtesting to search for algorithms with at least 50% performance ratio is excellent for trading. All you need is to diversify alerts across to assets or more to rake in profits.
If you require assistance in understanding what session would work best, you can send us a message to work through the process together.
Thank you for you support. This script is free to use to see potential of the indicator itself.
We are NOT allowed to advertise any script on sale based on tradingview house rules.
Wishing you all the best.

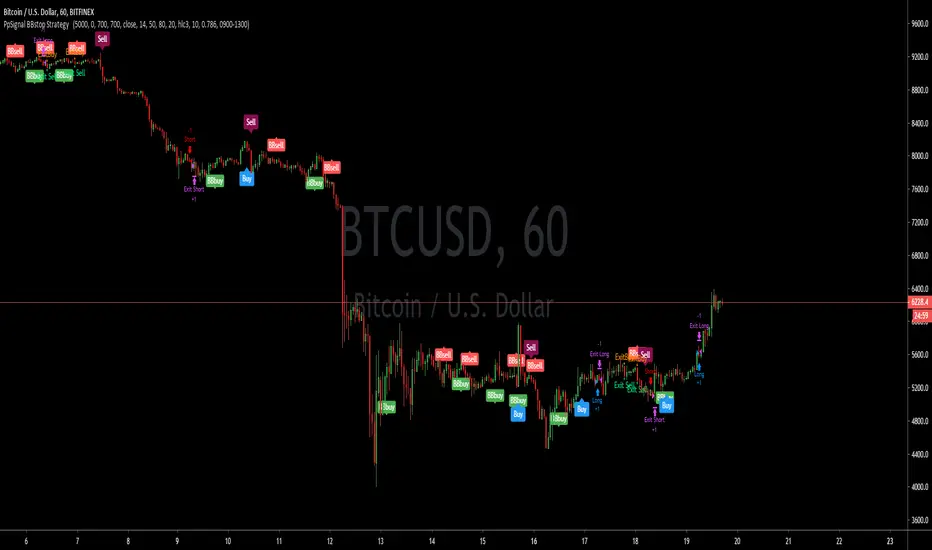
PpSignal BBstop Strategy strategy based on rsi of ma, in the example with btc usd we have as tp 1000 trailing stop 700, but you should adopt the money management to your criteria.
it has an alarm system when you see bbbuy or bbsell is a pre-notice only buy when the signal is Buy in blue or sell in maroon, it also has a buy exit and sell exit warning.
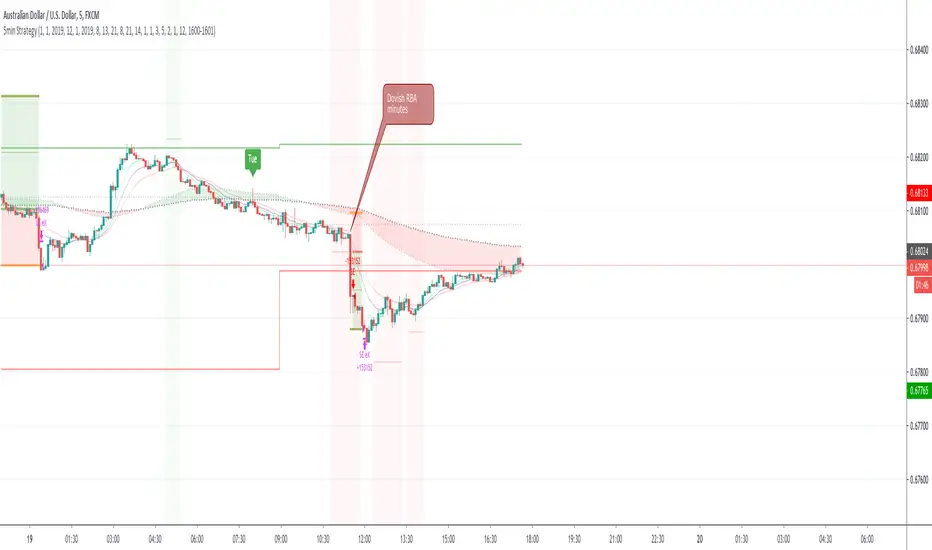
First time coding - a 5min forex Scalping strategy This is my first attempt at producing a strategy in Pine Script.
I am NOT a professional coder. I'm not even a good coder at that. I've only started Pine Script coding since September 2019. I am teaching myself.
This script is far from finished. I need to tweak a number of things about this script. Namely:
Add a validity window to the 'trigger bar' condition. Ie, I want to shut down the condition when the price closes above EMA21
Change the order entry so they are stop orders, using the stop entry price derived from the signals
Make changes to lot sizing
Add a trailing stop condition
Comments welcome, but do not expect me to reply to any questions or requests. In fact, don't expect any replies from me. I consider myself notoriously bad at replies.
I do welcome any feedback from any seasoned coders out there, as I am still a novice coder, and have so much to learn!
As to anyone who wants to criticise me - constructive and helpful criticism are most welcome, criticism to make yourself feel superior to me - you kind can eat a dk.
For the strategy rules, google the user ForexSignals TV account and look for the video "SIMPLE and PROFITABLE Forex Scalping Strategy".
Share, learn, prosper
Peace to y'all
Serialhenry
6/11/19
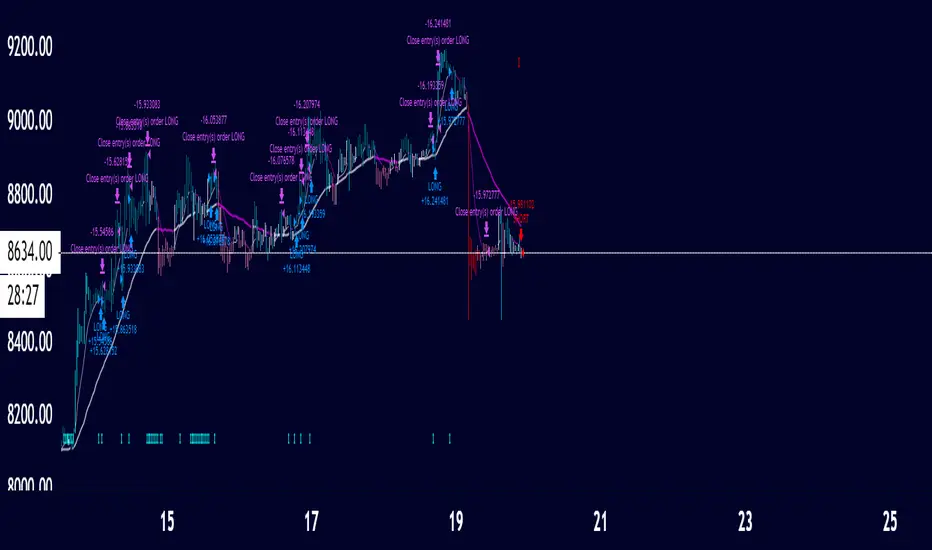
TrendaidTrendaid
is exactly what the name says
an Aid to Trend
Use this strategy to understand when the trend may shift and then use it to stay in the trends longer
simple strat
Buy when it says BULL in BLUE
Short when it says BEAR in RED
you may close your orders when it says to in PURPLE but unneeded if you want
You can adjust the stop which affects the scripts performance
You may also change from a Long to a Short line but the standard has proven to be the best overall
Let Trendaid guide you to riches
this was primarily designed for #forex but can be used in any market including #crypto
get access by joining the #CCV trading family by visiting the link below
- Cheers
SatoshiHeavy Market analyst for CCV Trading
www.cryptocurrentlyvip.com
ReMegaSayayinTraderthis is a kakaroto based tools we have been so many centuries in the time capsule training with goku to bring you this awesome indicator

ReMegaSayayinTraderTHIS IS A AKAROTO BASED TOOL WE HAVE BEEN INSPIRED BY LTRA INSTTINC MODE OF GOKU A CREATE THIS TOOL THAT U CAN USE IN 1 MINUTE CHART, IF U ARE IN LONG AND THE SAYAYIN SAYS SHORT, Y CHANGE UR TRADE COME ON USE IT IT WILL BE AMAZING

PerPro V7Thanks to @bengal (www.tradingview.com) for the advance and help in the sript
In this new Perpro version we added double sign for entry confirmation. Another point is that you have the automation recommended set by time or you can configure your own setting.
Remember to use this indicator with others that we offer in ppsignal.

PpSignal RENKO Strategy Versionwe did a strategy from renko indicator.
we added some highlight, MTF and Smooth Ppsignal KC.

Oscillator Based Scalping (Forex Majors)This is a scalping strategy based on oscillator divergences.
Tested on ForexICE market data.
Signal might appear and disappear during candle making since it is based on Moving Average and therefore acts on close, but since candle closed signal is final and does not repaint.
1M timeframes is recommended for bot trading. 5M-15M is more suitable for manual trading.
Full list of tested intraday timeframes below:
EUR-USD - 1M-5M-15M
USD-JPY - 1M-5M
GBP-USD - 1M
AUD-USD - 1M-5M-15M
USD-CHF - 1M-15M
NZD-USD - 1M-5M-15M
USD-CAD - 1M-5M
There is 2 more similar trading strategies that im finishing now, 1 for BITMEX ETHUSD and XBTUSD contracts, and 1 for bitmex alts. Should be ready in a day or two.
Additional notes on executing trades:
-Trade should be entered as close to sell signal as possible. You can enter at market at red circle candle or at limit at top of sell signal candle. In both cases your target is red Moving Average and entering at market just makes overall R/R for a trade is lower yet limit order might not always get filled.
-This strategy doesnt have a defined stop loss by itself, but your target is a moving average and 1-1 risk reward should be enough. Although the win rate is much higher than 50% so you can be less greedy if you feel like playing it safer.
-Strategy itself uses pyramiding, so i would recommend averaging up if you get 2-3 consecutive sell signals above moving average.
-It is assumed that you have OANDA spread rates or better.
-- Free trial for 24 hours. Contact me here or at twitter.com --


Profit Maximizer 90%-95% IntraDayTrade Strategy WithTester Developed for Intraday and for very very Lesser Time Frame Trading. Note: Invite only Script .Request to me Access permission to test this.
Strategy tester enabled .All you can test this in live market in any segment.
Lesser the time frame greater the success rates as the test results.
This can be used : Crypto Currency/Bitcoins ,Forex,currencies ,Index ,Commodity Gold/silver ,Oil Market and in Equity /Futures
It will work for BINARY OPTION ,BINARY DIGITAL to enter and hold the position in right direction, User test it and confirm .
How to Use:
Three Main Zone BackGrounds: 1. Green Zone 2. LightRed Zone 3. Yellow Zone
1.Long only when Bar Color changed from Red or Black to BLUE and BackGround in Green, Hold the position until opposite color comes.
2.Short when BAR become Black and BackGround Red Exit when opposite color come.
3.Yellow Back Ground : Risk Trade Zone : When Red BARs Cautious Short , Yellow Zone LightGreen Bars (Avoid Trade) .In Yellow Zone Close the previous Entered postions.
Time Frame : Lesser Time Frame and holding for longer time will give Good Result . 1min-1Hrs . This will not work >1Hr Strategy and Candle will disappear >1hr TimeFrame.
Strategy Tester : Choose any Date Month Year to Current Date and check the results below in the Strategy Tester.
REPAINT/NO REPAINT : No Repaint ,Previous candles and Background Color wont change. In the current candle position wait for the candle to close to see the stability.Current candle color might oscillate bit However it will not change from Blue to Black or Black to Blue or Black to Red.
Note : Last Bar will be a actual Green or Red Bar by Default Do not Confuse with this.It is trading view default strategy design working way.Once Bar closes actual strategy color will appear.
ALERT /AUTOVIEW capabilities : Strategy Tester does not support ALERT by default as you all know.In the Indicator version Alert will be added for all Buy Sell and cover entries.
Test the strategy.
SCRIPT : Access must be given by me to test this .Once access given you can test ,Request for access .Without access Study Not Auth error will come.
Review and Feedback.Thank you!
Refer the Release notes for any updates and my posts below and in my idea page for more details. Thank you!
Any issues report to me to Fix.Thank you!

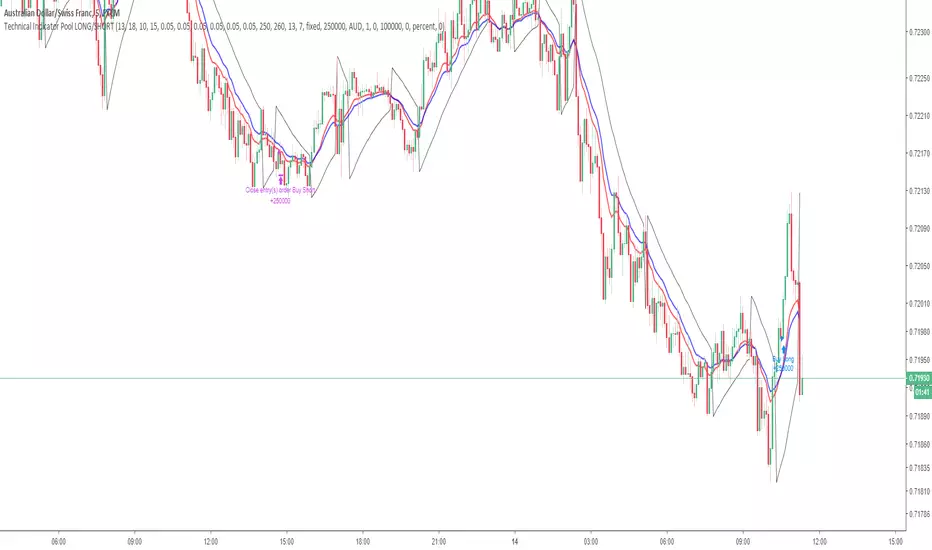
Technical Indicator PoolThis is for Bundle holders who want to use the Technical Indicator Pool for scalping binary options.
Understanding the Technical Indicator Pool
The Technical Indicator Pool is a strategy that operates on the premise that when many technical indicators project the same sentiment, they are concurrently more precise. The technical indicator pool contains five indicators
1. Small MACD Moving Average (SFMA) (10,15)
2. Large MACD Moving Average (LFMA) (13,18)
3. Parabolic Stop and Reverse (PSAR) (0.05, 0.05, 0.05)
4. Relative Strength Index (RSI) (14, 70, 30)
5. H/L Pivot (13)
When all five indicators project the same sentiment within a defined period (known as BarPeriod), an order is placed in the direction of sentiment.
Note:
Due to the nature of the indicator pool, such as the moving averages within the MACD and RSI as well as the High/Low Pivot, false positives may occur before the bar has closed within the time stamp.
This point of reference is to be used in combination with an arsenal of trading tools and should not be used as direct investment advice.
Option strategies should always include stop losses.
This strategy operates using a lot size of 2.5.
Cowabunga System from babypips.comPlease do read the information below as well, especially if you are new to Forex.
The Cowabunga System is a type of Mechanical Trading System that filters trades based on the trend of the 4 hour chart with EMAs and some other familiar indicators (RSI, Stochastics and MACD) while entering trades base on 15 minute chart.
I have coded (quite amateurishly) the basic system onto a 15 minute chart (the 4 hour settings are coded as well). The author says the system is to be traded off the 15 minute chart with the 4 hour chart only as a reference for trend direction.
4 Hour Chart Settings
5 EMA
10 EMA
Stochastics (10,3,3)
RSI (9)
Then we move onto the 15 minute chart, where he gives us the trade entry rules.
15 Minute Chart Settings
5 EMA
10 EMA
Stochastics (10,3,3)
RSI (9)
MACD (12,26,9)
Entry Rules - long entry rules used, obviously reverse these for shorting.
1. EMA must cross above the 10 EMA.
2. RSI must be greater than 50 and not overbought.
3. Stochastic must be headed up and not be in overbought territory.
4. MACD histogram must go from negative to positive OR be negative and start to increase in value.
What I did.
1. Set the RSI and Stochastic levels to avoid entries when they indicate overbought conditions for long and oversold conditions for short (80 and 20 levels).
2. Users can input specific times they want to backtest.
3. User's can configure profit targets, trailing stops and stops. Default is set it to was 100 pips profit target with a 40 pip trailing stop. (Note, when you are changing these values, please note that each pip is worth 10, so 100 pips is entered as 1000.)
The Cowabunga System from babypips.com is another popular and active system. The author, Pip Surfer, continues to post wins and losses with this system. It shows there is a lot of honesty and integrity with this system if the author keeps up to date even 10 years later and is not afraid of sharing the times the system causes losses.
As an example of this, here is post he shared just last week . It's almost like a journal, he gives specific times and reasons why he entered, lets the readers know when he was stopped out, etc. I think that what he does is equally important as his system.
To read more about this system, visit the thread on babypips.com, click here.

3 Duck's Trading System from Babypips.comThe 3 Duck's Trading System from Babypips.com
The 3 Duck's Trading System is the most popular and active trading system thread on the the babypips.com forum. It is a system that is mainly for beginners because it teaches you discipline, learning to cope with price moving against your position and learning to stay in a trade and keep profits running. For the thread and more info on the 3 Duck's Trading System click here
How does it work?
The system is a very simple enter/exit based on the 60 SMA of 3 different time frames: 4 hour, 1 hour and 5 minute.
The Rules, er, the Ducks! The Ducks must all be in a row for a trade to take place!
Duck 1 - To go long, price must be above the 60 SMA on the 4 hour chart.
Duck 2 - To go long, price must be above the 60 SMA on the 1 hour chart.
Duck 3 - To go long, price must cross above the 60 SMA on the 5 minute chart and the 60 SMA of the 5 minute chart must be below that of the 4 hour and 1 hour chart. (obviously the reverse for shorting)
YOU MUST USE THIS SYSTEM ONLY ON THE 5 MINUTE CHART.
I say this because I have already charted all of the Ducks into the 5 minute chart so you don't have to flip back and forth.
I have also added some inputs for profit targets, stop targets, trailing stops and times to trade for backtesting.
If you have any questions or comments, please let me know! If you see I messed up on something, please let me know!
Also a VERY special thanks to the babypips.com user Captain_Currency . He wrote this strategy 10 years ago (2007 was 10 years ago?!) and he is still active on the thread and posting results and offering help!
