Four Moving Averages in one IndicatorHave fun and good trades with this. <3 You can use from 1 to 4 EMAs with this.
FOUR

Three (3)-Bar and Four (4)-Bar Plays StrategyThis strategy analyzes the three and four-bar play which is when price action has a wide igniting bar that has a full body, then one or two narrow bars which have a relatively equal high for long plays and relatively equal low for short plays, then a continuation bar. You should not take plays that will encounter resistance. The stop loss is placed for long plays below the 2nd bar (or 3rd bar for 4-bar play).
This is commonly used on 1m, 2m, 5m, and 10m charts.
Jared Wesley is one of the more notable traders that use this setup. You can edit as an input the start date, end date, igniting bar size, the body percentage of the igniting bar, the relative equality of the 2nd bar (and 3rd bar for 4-bar play) compared to the igniting bar, and profit multiplier.

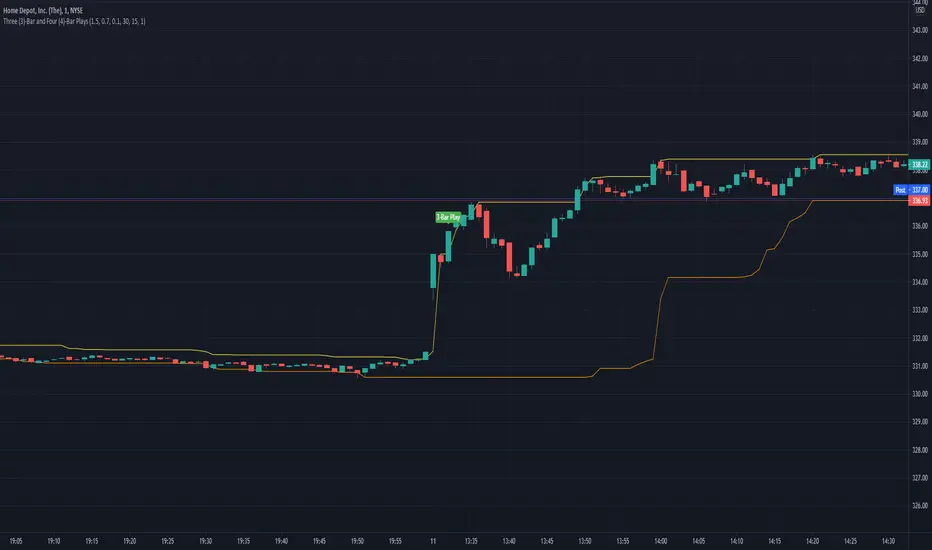
Three (3)-Bar and Four (4)-Bar PlaysThis indicator shows the three and four-bar play which is when price action has a wide igniting bar that has a full body, then one or two narrow bars which have a relatively equal high for long plays and relatively equal low for short plays, then a continuation bar. You should not take plays that will encounter resistance.
Jared Wesley is one of the more notable traders that use this setup. There will be a label placed on the chart when a play occurs. You can edit as an input the igniting bar size, the body percentage of the igniting bar, and the relative equality of the 2nd (and 3rd bar for 4 bar play) compared to the igniting bar.
Four MM crossHello traders
Some friends asked me to do it so... sharing it for everyone instead
This indicator detects when the first moving average is above the three others. It's a very powerful tool for trend traders that use multiple moving averages to detect a strong trend
Enjoy
Dave

4 EMA PlotCommonly used to identify a Bull Market, the 21, 55, and 100 Daily EMA along with the 200 SMA need to line up. This script will plot these as well as identify a short-term 21/55 cross. Useful if you have a limit on indicators and need the 4. They can be customized to your settings.

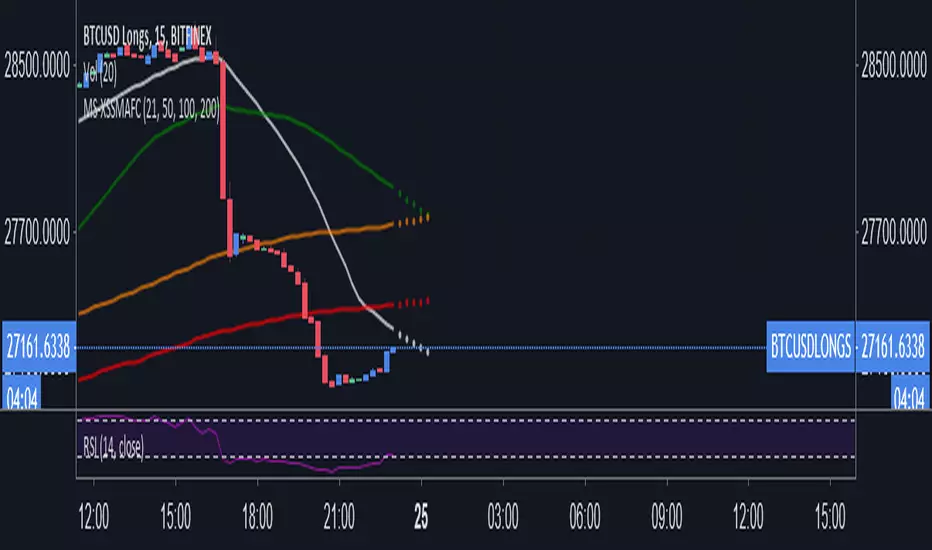
Meister Shredder - Simple Moving Averages x4 ForecastIncludes the 21, 50, 100 and 200 SMA and 6 bar forecast