VIX Price BoxVIX Price Box (Customizable Colors)
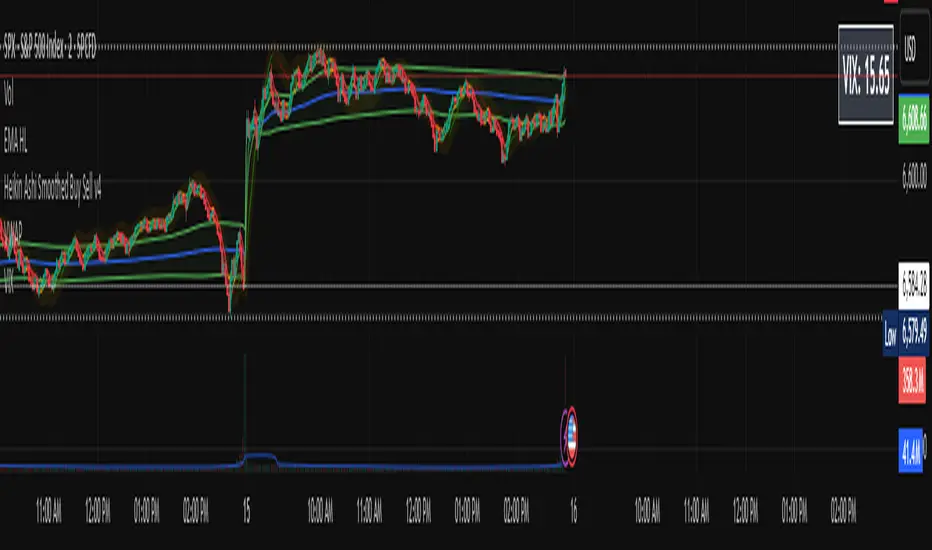
This indicator displays the current VIX (CBOE Volatility Index) value in a fixed box on the top-right corner of the chart. It’s designed to give traders a quick, at-a-glance view of market volatility without needing to switch tickers.
Features
Pulls the live VIX price and updates automatically on every bar.
Displays the value inside a table box that stays fixed in the top-right corner.
Threshold-based coloring: the text color changes depending on whether the VIX is below, between, or above your chosen threshold levels.
5 built-in color modes:
Custom mode – choose your own colors for low, medium, and high volatility zones.
Adjustable threshold levels, background color, and frame color.
Use Cases
Monitor overall market risk sentiment while trading other instruments.
Identify periods of low vs. high volatility at a glance.
Pair with strategies that rely on volatility (options trading, hedging, breakout setups, etc.).
Pine Script®指標