Square of Nine Levels [RC] Basic📐 Square of Nine Levels Basic— Precision Market Geometry for Dynamic Price Targets
The Square of Nine Levels Basic indicator is a powerful price-projection and level-mapping tool based on W.D. Gann’s legendary Square of Nine mathematical system. This indicator transforms market prices into geometric rotations and harmonic levels—revealing price zones where markets historically accelerate, pause, or reverse with uncanny accuracy.
Unlike static Fibonacci tools, Square of Nine levels expand radially around a chosen base price, creating concentric price cycles that align with vibrational mathematics and cyclical market resonance. When price interacts with these rotational degrees, traders often witness structural reactions that are invisible to standard indicators.
🧭 What This Indicator Does
Once a trader inputs (or clicks) a Base Price, the indicator automatically:
✔️ Computes Square of Nine projections in upward and downward directions
✔️ Plots concentric price circles (levels of expansion) (Basic Version 1 Level Only)
✔️ Highlights rotational harmonics and midpoint attractors
✔️ Shows Golden Ratio (0.786 / 0.618 / 0.382 / 0.236) cyclic divisions
✔️ Provides clear visual level markers & labels for analysis
✔️ Adjusts dynamically as price trends evolve
These levels act as mathematical magnets, where price frequently:
Finds hidden support or resistance
Creates fair value rejection zones
Forms breakout thresholds
Completes wave and time cycles
Resonates with prior swing pivots
🔍 Key Features
Feature Benefit
_________________________________________________________________________
Auto Square-of-Nine Level Calculation Zero manual computation—instant geometry
Adjustable Circles & Points Model Gann expansions as per your theory
Golden Ratio & Midpoint Zones Adds confluence for precision entries
Multi-color Cycle Layers Instantly differentiate price cycles
Minimal UI Designed for professional clean charts
🧠 Why the Square of Nine Matters
Gann believed that price does not move randomly—it rotates through degrees, harmonics, and vibrational frequencies. The Square of Nine captures this rotation mathematically:
Price in time equals price in space.
This tool reveals those rotational levels, allowing traders to anticipate when price is likely to pivot or continue—with mathematically predictable targets.
🎯 Best Use-Cases
Identifying major support/resistance levels
Timing cycle inflection points
Swing, positional, and index-level forecasting
If you trade using Gann methods, cycles, harmonics, Square of 9, or astro-geometry, this indicator becomes a foundational levels and projection engine.
🚀 Take Your Charting to the Next Dimension
The Square of Nine Levels Basic is not just a level plotter—it is a market resonance system. Once you understand how price vibrates around these circles, you gain a structural edge that most traders never discover.
Gannlevels

Gann_RSGann_RS — Precision Gann Level Indicator (RightSpade Edition)
Gann_RS (RightSpade Edition) is a professional-grade indicator that applies Gann’s square-root progression technique to identify dynamic support and resistance levels around a key reference point (price X).
✅ Key Features
• Auto-detects base level using daily close or daily low.
• Plots symmetrical Gann levels above / below initial X using √X + Step logic.
• Adjustable step size and number of levels.
• Distinct color coding for alternate bands.
⚙️ Usage Tips
• Works on any symbol and timeframe.
• Use smaller Step values (1-2) for tighter intraday analysis, larger values (2-4) for swing setups.
• Combine with trend-based confirmation indicators for maximum accuracy.
🧭 Developed & maintained by
RightSpade Capital Advisors Pvt. Ltd. — SEBI Reg. INH000018799
📌 Disclaimer
This script is for educational & research purposes only and does not constitute investment advice or a buy/sell recommendation. Market participation involves risk; please consult your financial advisor before making trading decisions.
© 2025 RightSpade Capital Advisors Pvt. Ltd. All Rights Reserved.

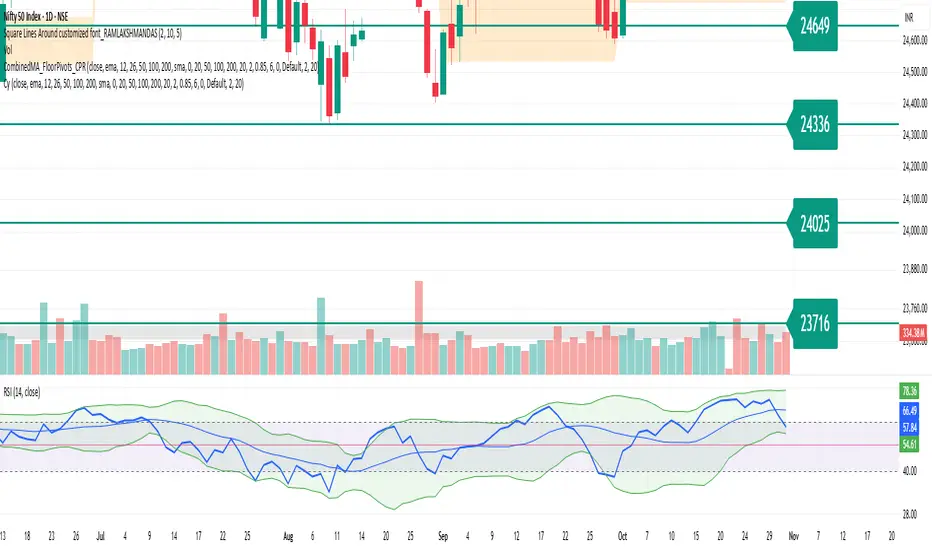
Square Lines Around customized font_RAMLAKSHMANDASSquare Lines Around customized font_RAMLAKSHMANDAS
This indicator draws dynamic horizontal lines at all integer squares around the square root of the current close price, helping traders visualize price levels with mathematical significance. Each line is labeled, and the level font size can be customized interactively through a simple “Text Size (1-5)” input, making it easy to adapt for different chart sizes or visibility needs.
Features:
Plots horizontal lines at every perfect square (i.e.,
i
2
i
2
) near the rounded square root of close price.
Displays level values as labels, with user-adjustable font size (select 1 to 5, mapped to tiny up to huge).
All lines and labels (levels) are automatically updated with each new candle.
User controls for line color, line width, level range, and label font size.
Fully compatible with all TradingView intervals and symbols.
Usage:
Helps spot mathematically relevant support/resistance zones for custom strategies.
Useful for visual traders, quant experimenters, and anyone interested in market geometry.
Best suited for intraday, positional or backtest analysis where precise price levels matter.
Customizations:
Range +/- around square root (choose how many lines you want).
Line color and thickness for clarity.
Select label font size: 1 (tiny), 2 (small), 3 (normal), 4 (large), 5 (huge).
How to use:
Add to your chart, tweak settings in the input panel, and see instant updates.
Labels are sized to your preference for maximum visibility.
Gann Dynamic Levels [SmartFoxy]# 🌌 Gann Dynamic Levels
Gann Dynamic Levels is a dynamic Gann-based framework that calculates proportional and exponential levels using customizable methods — including planetary ratios.
Perfect for traders focused on cycles , ratios , and harmonic structures .
Inspired by the geometric and harmonic principles of W.D. Gann , this multifunctional tool automatically plots time–price projection levels based on user-defined anchor points.
It combines multiple calculation techniques to capture both linear and exponentia l market symmetries.
The indicator adapts dynamically to price movement, helping traders identify potential reversal zones , time clusters , and harmonic expansions derived from proportional and planetary relationships.
---
## ⚙️ Core Features
Five Calculation Methods — Linear, ratio-based, geometric, and exponential spacing for multi-perspective analysis.
Planetary Scaling Mode — Optional mode based on astronomical distances (Titius–Bode Law), adding an astronomical dimension to level spacing.
Adaptive Offset Control — Shifts all projected levels left or right proportionally without changing their internal spacing.
Automatic Label Management — Dynamically updates or reuses labels for better clarity and improved chart performance.
Custom Styling — Full control over colors, widths, label positions, and line styles for each method.
---
## 🌐 Purpose
Designed for traders who combine Gann theory , harmonic ratios , and cyclical timing to visualize equilibrium zones and future market symmetry.
Whether used for short-term timing or long-term structural projections, Gann Dynamic Levels provides an adaptive, geometry-based framework for interpreting market behavior.
---
## 📘 How to Use
When first applied, the indicator prompts you to place two points on the chart — for example, at the start and end of a significant price range.
The indicator calculates the number of bars between these two points, known as Delta .
Delta serves as the base unit for all calculations in Methods #1–#5 .
The computed results are displayed in Table 1 , which can be toggled using the parameter “📱 Show Gann Levels Table”.
You can reset or reposition the initial points in two ways:
Drag the existing points to new positions on the chart.
Hover over the indicator name, click ⦁⦁⦁ (More) → select “ Reset Points ”, then set new reference points.
---
## ⚙️ Method Logic
Classic – Evenly spaced levels based on the base Delta value. Ideal for identifying key support and resistance zones.
Coefficient (Coeff) – Scales Delta by fractional or whole-number coefficients for proportional level spacing.
Rounded – Rounds each calculated level to the nearest significant price value to align with major zones.
Subtractive – Generates levels by subtracting multiples of Delta from a reference point, emphasizing retracement-type structures.
Exponential – Applies an exponential growth model (10a = 4 + 3×2ⁿ) to project dynamic, non-linear level expansion.
Planetary – Uses the average distances of planets from the Sun (in Astronomical Units, AU ) as ratio multipliers to create harmonic projections.
Planetary distances can be customized in the user settings.
Data for Method #6 (Planetary) is displayed in Table 2 , toggled via “ 🪐 Show Planetary Table. ”
---
## ➡️ Additional Feature
Offset – Shifts all Gann levels horizontally (left or right) without changing their spacing.
Useful for visually aligning levels with key market structures.
---
### 🧭 Summary
A multi-method Gann framework combining geometric, harmonic, and planetary ratios for dynamic level projection and cycle analysis.

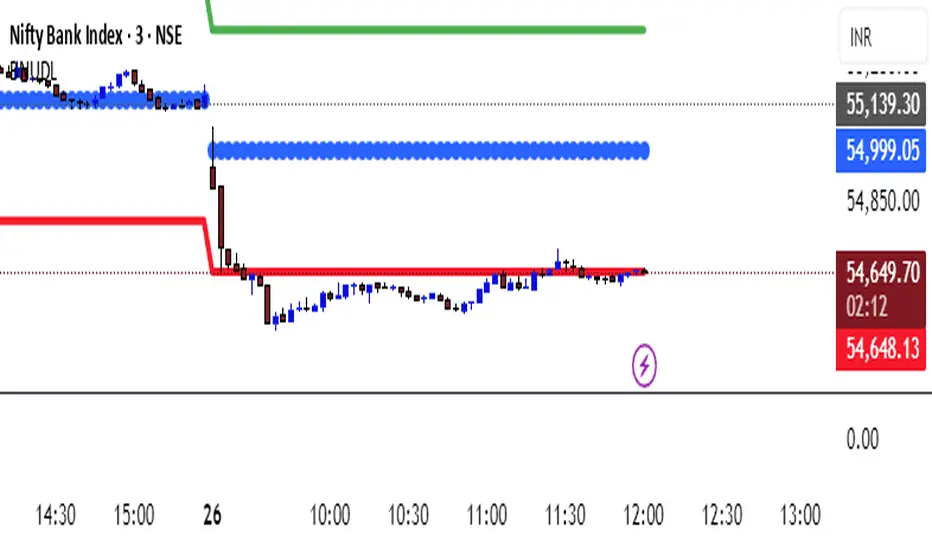
KATIK BankNifty Upside/Downside LevelsThe KATIK BankNifty Upside/Downside Levels (BNUDL) indicator plots key daily reference levels for BankNifty based on its opening price. Using a predefined daily move percentage, it calculates potential upside and downside levels from the open. The script displays:
Up Level (Green): Potential bullish threshold above the open
Down Level (Red): Potential bearish threshold below the open
Open Price (Blue Circles): Daily BankNifty opening level
This tool helps traders quickly identify intraday directional bias and potential support/resistance zones around the opening price.
WD Gann: Vertical Lines for Predefined Days/Bars AgoThis Pine Script draws vertical lines on the chart at specific time intervals, inspired by WD Gann’s theories of time cycles . WD Gann, a famous trader, believed that market movements were influenced by predictable time cycles. This script enables traders to visualize these key time cycles on the chart by placing vertical lines at predefined intervals (in bars ago), helping to identify potential turning points in the market.
The time intervals used in this script are inspired by Gann’s work, as well as astrological and numerological principles , which many traders believe influence market behavior . You can customize which time intervals (such as 3, 7, 9, 21, etc.) you want to track by enabling or disabling specific vertical lines on the chart.
Key Features:
Time Cycles Based on Gann’s Theory: Draws vertical lines at significant time intervals such as 3, 7, 9, 21, 27 bars ago, which are commonly used by Gann traders.
Astrological & Numerological Significance: The predefined intervals also align with key numerological and astrological values, allowing for a broader perspective on market cycles.
Customizable Intervals: You can choose which time intervals to display by enabling or disabling checkboxes for each cycle, allowing flexibility in chart analysis.
Visual Labels: Each vertical line is labeled with its corresponding "bars ago" value, providing clear reference points for the selected time cycles.
What Users Can Do:
Track and analyze market movements based on time cycles that are significant to Gann’s theory, as well as numerological and astrological influences.
Enable or disable vertical lines for specific cycles, like the 3-bar cycle, 9-bar cycle, or 365-bar cycle, depending on the intervals that align with your trading strategy.
Combine with other technical analysis tools and Gann techniques (e.g., Gann Angles, Gann Fans, or Square of Nine) for a more comprehensive trading approach.
This tool is designed for traders who believe in the power of time cycles to influence market behavior, and is especially useful for predicting turning points or key price movements based on these cycles.

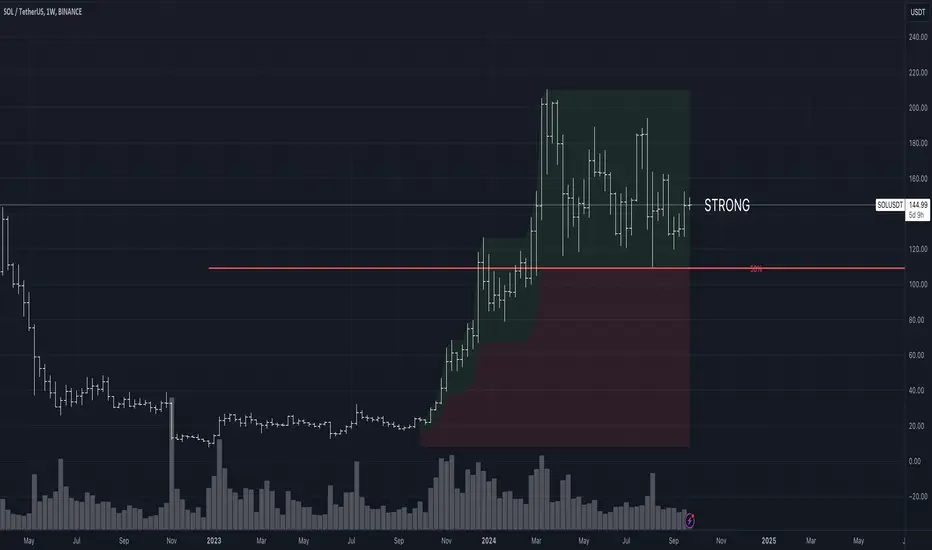
Strength/Weakness IndicatorThe Strength/Weakness Indicator is a customisable tool designed to help traders identify key areas of market strength and weakness based on the 50% Fibonacci retracement level .
█ Underlying Concept:
The concept behind this indicator draws heavily on the principles of Fibonacci retracement and WD Gann’s market theories , particularly the importance of the 50% level in signalling critical psychological areas of support and resistance. Historically, the 50% retracement level has been regarded as a key marker where markets either find new buyers/sellers or continue a trend. Gann himself placed significant emphasis on the halfway point of a previous market move as a critical level for market strength and reversal.
Strength : When an asset is trading above the 50% retracement level, it suggests that buyers are in control and that the market is showing strength. This is particularly useful for traders aiming to ride the continuation of an uptrend.
Weakness : Conversely, when the price falls below the 50% retracement level, it indicates that sellers are dominating, and the market is showing signs of weakness. This can be an early indication of a potential reversal or further decline.
█ Key Features:
1 — Multi-Timeframe Fibonacci Analysis :
This indicator supports up to two distinct retracement levels, allowing traders to analyse multiple timeframes simultaneously. Customise the look-back periods for each level to track the highest high and lowest low over your chosen period.
The tool is adaptable to short-term, swing trading, and long-term investing, making it useful across different trading styles.
2 — Dynamic Strength/Weakness Labelling :
The script dynamically calculates and displays whether the asset is “STRONG” or “WEAK” based on its position relative to the 50% retracement levels. If the price is above both levels, it is considered "VERY STRONG." Conversely, trading below both levels signals "VERY WEAK" conditions. This real-time feedback helps traders gauge market sentiment with ease.
3 — Customizable Visual Representation :
Both retracement levels are fully customisable, including line colours, styles, and thicknesses. The script offers custom background fills—highlighting areas of strength (green) and weakness (red)—to provide a clear visual aid for identifying key price zones.
Traders can modify the appearance of text labels (size, colour, position) and choose whether to extend lines left, right, both directions, or not at all.
4 — Cross-Timeframe Validation :
Traders can cross-reference price action between two timeframes to confirm trends. If both levels signal strength or weakness, it validates market momentum, increasing confidence in trade decisions.
5 — Strategic Decision-Making Aid :
The indicator aids in identifying support and resistance zones based on the 50% retracement level. Use it to time entries and exits effectively: price above the 50% level suggests potential trend continuation, while falling below may indicate reversal.
█ How It Works:
1 — Defining Custom Timeframes :
The trader selects custom time periods (days, weeks, months, or years) to calculate the highest high and lowest low, allowing precise control over the analysis.
2 — Calculating Strength/Weakness :
Once the 50% retracement level is calculated, the price’s position relative to it determines the market’s condition. Above 50% signals strength, below signals weakness.
3 — Comparing Multiple Timeframes :
Enable a second retracement level to compare different time periods. This feature is useful for spotting divergences between short-term and long-term trends or validating strength across timeframes.
█ How to Use:
1 — Assess Market Conditions :
If price trades above both 50% retracement levels, it indicates strong bullish momentum. Conversely, trading below both levels signals bearish conditions.
2 — Plan Entries/Exits :
Use the 50% level as a reference for support and resistance. Plan to enter when the price bounces off the 50% level, or exit if it breaks down below this critical level.
3 — Cross-Timeframe Analysis :
Validate the market trend by comparing retracement levels across different timeframes. This helps in confirming whether the trend is strong enough to justify holding a position.
█ Why This Indicator is Unique:
Comprehensive Multi-Timeframe Analysis : While most Fibonacci indicators focus on a single period, this tool provides a deeper understanding by allowing traders to compare price action across multiple timeframes.
Customizable and Dynamic : The real-time strength/weakness labeling, customizable background fills, and the ability to analyze two retracement levels simultaneously make this tool adaptable to any trading strategy.
Valuable for All Traders : Whether you are day trading, swing trading, or investing long-term, the Strength/Weakness Indicator offers clarity on key market levels and sentiment, improving decision-making for entries and exits.
Disclaimer : This script is for educational purposes and is not financial advice. Trading involves significant risk, so please consult a professional advisor before making investment decisions. For the best results, use this indicator alongside other technical analysis methods like trend lines or moving averages to help you confirm signals and make more informed decisions.
Historical Swing High-Low Gann IndicatorThe Historical Swing High-Low Gann Indicator is a powerful tool designed to track and visualize key market swing points over time. This indicator identifies significant swing highs and lows within a specified time frame and draws connecting lines between these points, allowing traders to observe the natural ebb and flow of the market.
What sets this indicator apart is its ability to maintain all previously drawn swing lines, creating a comprehensive historical view of market movements. Additionally, the indicator projects Gann-style lines from the most recent swing highs and lows, providing traders with potential future support and resistance levels based on the geometric progression of price action.
Features:
Swing Detection: Automatically detects significant swing highs and lows over a user-defined period (default is 3 hours).
Persistent Historical Lines: Keeps all previously drawn lines, offering a complete visual history of the market's swing points.
Gann-Style Projections: Draws forward-looking lines from the latest swing points to help predict possible future market levels.
Customizable Parameters: Allows users to adjust the swing detection period to suit different trading styles and time frames.
This indicator is ideal for traders who rely on price action, support and resistance levels, and Gann theory for their analysis. Whether used in isolation or as part of a broader strategy, the Historical Swing High-Low Gann Indicator provides valuable insights into the market's behavior over time.

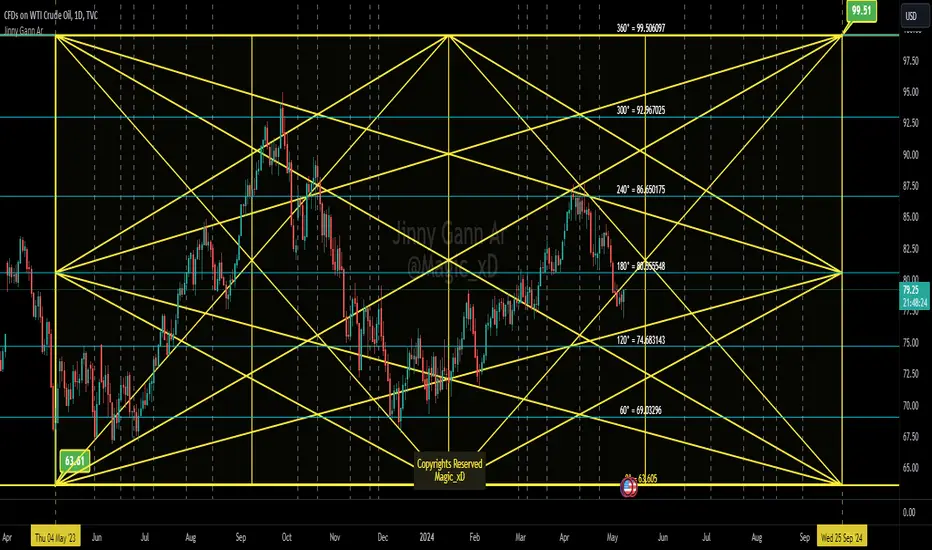
Jinny Gann ArJinny Gann AR is a comprehensive technical analysis indicator designed to empower traders with the tools to analyze market movements using Gann square of 9 theory. Developed by Magic_xD, this indicator integrates various features inspired by the legendary trader W.D. Gann's methods.
The trading techniques by WD Gann are widely seen as innovative and are still studied and used by traders today. He used angles and various geometric constructions. Gann angles divide time and price into proportionate parts and are often used to predict areas of support and resistance, key tops and bottoms and future price moves. The method is based on the notion that markets rotate from angle to angle and when an angle is broken, price moves towards the next one. Several angles together make up a Gann Fan.
- Jinny Gann AR Might accurately Shows you when and what price might be the end of the Cycle,
-Gives The important pivot points
- This Allows you to Detect Next Level of Resistance/Support And when a Possible Reversal might occur ahead so you can Catch a reversal in time.
- Its Multi Language User interface English - Arabic.
Ability to customize Every thing visually.
Some Features Explained on USOIL Chart :
Gann Square of 9 Levels for USOIL:
Charts Shows and Up Cycle Started 4 May 2023 From bottom of 63.61
Indicating Important Levels and Expected End of 1 Cycle at 99.5 on 25 Sep 2024
Gann Star With Levels And Time Lines :
Vertical Dashed Lines are The time lines
Jinny Gann Grid Based on Shape Type not Static 45 Angle:
Jinny Gann Grid + Levels :
Jinny Gann Fan For Up Cycle:
Jinny Gann Fan Reverse Same Cycle:
Ability To Show Both Up/Reversal Fans on The chart:
The Number of Fann Levels you need on the chart can be customized by changing Shape Type... But Price Will Respect it Pretty Well.
Key Features:
Direction Selection: Choose between "Up" or "Down" to specify the market direction you want to analyze.
Automatic Settings Adjustment: Enable this option to allow the indicator to automatically adjust settings for optimal analysis.
Original Gann Levels: Display original Gann theory levels Based on Gann Square of 9 Equations.
Auto Detect Tops/Bottoms: Determine the number of previous candles used to automatically detect Top or Bottom in the market.
Spacing Configuration: Adjust the spacing or offset between Gann levels to fine-tune your analysis.
Manual Starting Point: Manually set the starting point for your analysis.
Geometric Shape Selection: Choose from various geometric shapes including straight lines, triangles, quadrilaterals, and more...
Custom Angle Selection: Define custom angles for geometric shapes .
Time Interval Selection: Select time intervals such as 360 or 720 Etc...
Cycle Analysis: Determine the number of cycles to analyze market movements effectively.
Decimal Precision: Customize the number of decimal places displayed for accurate analysis.
Automatic Spacing (Under Development): Future feature to automatically select spacing for enhanced user experience.
Time Levels Display: Visualize time levels to gain insights into market timing.
Gann Star Display: Show Gann stars to identify critical market points.
Star Modification: Modify the appearance of Gann stars for better visualization.
Gann Grid Display: Display Gann grids to identify key support and resistance levels.
Grid Extension: Extend Gann grid lines for extended analysis.
Gann Fan Display: Show Gann fans to analyze trend lines and potential reversals.
Reverse Fan Display: Visualize Gann fans in reverse to explore alternative analysis perspectives.
Additional Fan Options: Explore more options for Gann fan analysis.
Time Line Adjustment: Move time lines to the right or left for flexible analysis.
Star Line Extension: Extend Gann star lines for deeper insights.
Fan Line Extension: Extend Gann fan lines for comprehensive trend analysis.
Customizable Colors: Customize colors for various indicators to suit your preference.
Width Adjustment: Adjust the width of trend lines for better visualization.
Label Customization: Customize colors and positions of level and price labels for clarity.
Anchored Square of 9 by AlgoCadosThe 'Anchored Square of 9 by AlgoCados' pine script indicator, leverages the non-discretionary, mathematical principles of W.D. Gann's Square of 9 for predicting vital support and resistance levels across all financial assets. Its mathematical precision and versatility make it a universally applicable tool, suitable for analysis of any financial asset without bias. Characterized by its adaptability to both high and low time frame analyses (HTF and LTF), this sophisticated indicator provides a structured, reliable method for market analysis, making it an essential asset for traders looking to apply a consistent and comprehensive approach across various market conditions and asset classes.
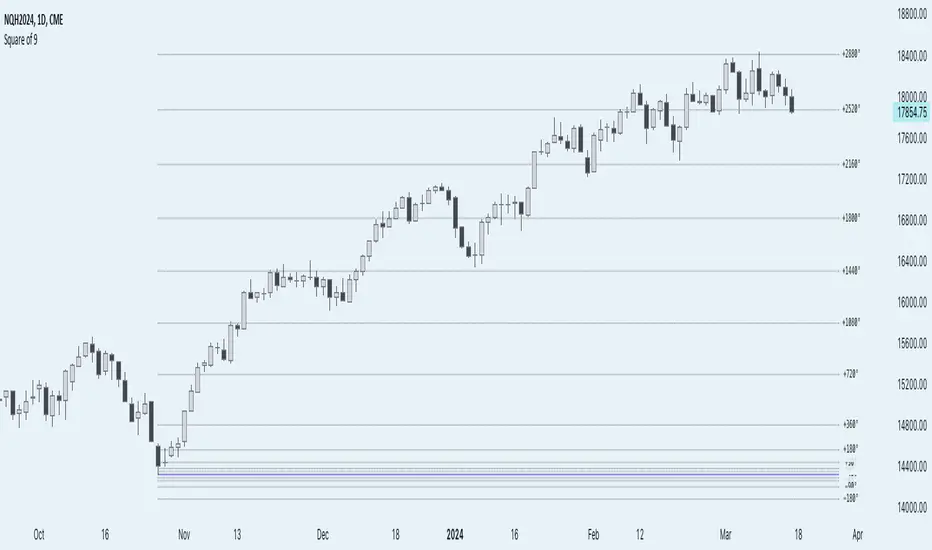
CME_MINI:NQH2024
Core Functionality
Anchored Price Point: The script allows users to define an anchor time and anchor point type (High, Low, Open, Close), serving as the basis for subsequent calculations. This flexibility enables precise adaptation to varying market conditions and analysis needs.
Angular Shifts and Projection: The indicator implements a range of angular shifts for LTF and HTF analyses, allowing for detailed and customizable projection of support and resistance levels. Angular shifts can range from 11.25° for finer intraday nuances up to 7200° for broader, long-term trend insights.
Mathematical Implementation
Anchor Point Selection: The script selects an anchor point based on user inputs for the anchor type and anchor time. This point serves as the basis for calculating deviations.
Angular Shift Calculation: The indicator calculates deviations by applying angular shifts to the square root of the anchor price. These deviations are used to project potential support and resistance levels.
Projection Lines and Labels: For each angular shift, the script generates projection lines and labels, which are dynamically adjusted as new data becomes available. This visual representation aids in identifying significant price levels.
CME_MINI:NQH2024
Key Features and Customization Options
Customizable Angular Shifts: Traders can enable or disable specific angular shifts to tailor the analysis to their trading strategy.
Projection Styles and Labels: Offers various styles (Solid, Dotted, Dashed) for equilibrium, upper shifts, and lower shifts lines, along with customizable label options (Levels, Prices, Levels + Prices) for enhanced clarity and information density.
Dynamic Labeling: Utilizes dynamic labeling for each projection line, indicating the angular degree and price level, facilitating a comprehensive understanding of potential market movements.
User-Friendly Inputs: Features user-defined inputs for anchor time and type, angular shifts, line styles, and labeling options, making the tool highly adaptable and intuitive.
Pine Script Technical Insight
Input Handling: The script incorporates a series of input controls to allow users to specify the anchor time, anchor type, and which angular shifts to display.
Line and Label Generation: Utilizes Pine Script's capabilities to dynamically generate and adjust projection lines and labels based on the calculated support and resistance levels.
Efficiency and Adaptability: Efficiently loops through a predefined set of angles, applying them to the anchored price point to calculate and project support and resistance levels, demonstrating the script's adaptability to both intraday and longer-term analysis.
Mathematical Formulation and Indicator Logic
Initial Setup and Inputs
The indicator starts by capturing user inputs for the anchor point—this can be a High, Low, Open, or Close price at a specified anchor time. These inputs determine the base price (P-base) from which all calculations are derived.
High if Anchor Type = "High"
Low if Anchor Type = "Low"
Open if Anchor Type = "Open"
Close if Anchor Type = "Close"
Angular Shifts and Projection Basis
The core of the "Anchored Square of 9" methodology involves calculating support and resistance levels through angular shifts applied to the Price-base (P-base).
The indicator enables a series of angular shifts, specified by the user, to project these levels dynamically.
Angular shifts are interpreted through the lens of Gann's theory, with each degree corresponding to a potential market turn or equilibrium point.
The script translates these angles into actionable projections using the square root of the anchor price, then applies the angular coefficients to find deviation points.
Angular Coefficients and Pi
In the context of the "Anchored Square of 9" indicator, angular shifts are crucial for projecting potential support and resistance levels. These shifts are quantified by angular coefficients derived from geometric principles, specifically leveraging the relationship between angles in degrees and their radian counterparts using π (Pi). Here's how angular coefficients are integrated:
Pi Reference for Angular Shifts: Given that 360° equates to 2π radians, angular coefficients (θ) for the indicator are calculated by translating degrees into a radian measure and then applying this measure to modify the square root of the base price (P-base).
Example of Angular Coefficients Shift:
A 180° shift corresponds to π radians. In the indicator's formula, this would translate to an angular coefficient of 1, since 180° = π in terms of π. Thus, applying this angular shift involves adding or subtracting 1 from the square root of P-base and then squaring the result to project a new price level.
Similarly, a 90° shift, equating to π/2, would have an angular coefficient equivalent to 0.5, reflecting its proportion of the circle (or square, in the context of Gann's geometry).
Implementation in Calculation of Deviations
Incorporating π into the formula for calculating deviations enriches the indicator's mathematical foundation, providing a direct link to geometric principles:
For each selected angular shift (θ), the script calculates positive and negative deviations from the square root of the anchor price. These deviations represent potential support and resistance levels.
P± = round (( sqrt root (P-base) ± θ)²)
Where:
P ± represents the calculated price levels for support (-) and resistance levels (+);
θ is the angular coefficient derived from the user-selected angular shifts;
sqrt root (P-base) is the square root of the base price;
round (⋅) ensures that the calculated levels are adjusted to the nearest tick size, maintaining relevance to actual trading scenarios.
Dynamic Projections and Visualization
The script generates lines and labels for these calculated levels, dynamically extending them as new market data becomes available. This feature ensures that traders have the most current and relevant information for decision-making.
For visualization:
Equilibrium Lines: Drawn at P-base to indicate the anchor or equilibrium point.
Support and Resistance Lines: Drawn at P- and P+, respectively, showing potential levels of market reaction
CME_MINI:NQH2024
Labeling and Style Customization
The indicator provides extensive customization for the appearance of projection lines and labels. Traders can select the line style, color, and text information (levels, prices, or both) to be displayed, tailoring the visual output to their preferences and trading strategy.
Implementation Details
This detailed approach to calculating support and resistance levels showcases the indicator's adherence to Gann's principles while leveraging modern computational methods to enhance trading analysis. By translating angular shifts into quantifiable projections, the "AlgoCados x Anchored Square of 9" indicator offers a powerful tool for identifying potential market movements with high precision.
The Pine Script implementation encapsulates this complex logic within a user-friendly interface, allowing traders to harness advanced analytical techniques within the TradingView platform. Through dynamic calculation and visualization, the indicator equips users with a deep understanding of market structures, enabling informed trading decisions based on mathematical projections.
Conclusion
The 'Anchored Square of 9 by AlgoCados' indicator merges mathematical precision with trading intuition, offering an advanced tool for traders seeking to leverage the time-tested principles of W.D. Gann's Square of 9. With its comprehensive set of features and customization options, it stands as a powerful addition to the TradingView platform, designed to enhance market analysis and decision-making for traders at all levels.
Embrace the essence of smarter trading where every insight is "Healthy For Your Trading."
PRESTANA SQ9PRESTANA SQ9 - Advanced Analysis with Revised Square of 9 and Custom Gann Scale
Description:
PRST SQ9 is an innovative technical analysis tool that revolutionizes the use of the Square of 9 by integrating it with a custom Gann scale and the application of solar degrees. This unique script stands out for its ability to generate more precise levels of analysis compared to traditional market indicators.
Key Features:
Customizable Price Scale (Price Unit): By adjusting the 'price unit' and 'factor', our script allows for extremely precise levels of analysis. This approach provides greater flexibility and adaptability to various market conditions.
Application of Solar Degrees: A distinct feature of our script is the use of solar degrees, offering an alternative perspective to the traditional Square of 9 scale. This allows for a broader range of analysis and the identification of key market turning points.
Customizable Configuration: Users can set the desired time frame (TF) and adjust the 'price unit' and 'factor' to suit their specific needs. For instance, settings like 1, 4, 16, 64, 256, or 2, 8, 32, 128 can be used to calibrate the indicator.
Usage Guide:
Setting the Time Frame and Price Unit: Select the TF you wish to analyze and set the 'price unit' to values like 1 or 2, and their multiples (e.g., 4, 16, 64, 256 for 'price unit' 1).
Adjusting the Factor: Modify the 'factor' to correspond to the degrees you want to explore on the Square of 9. For example, a 'factor' of 1 corresponds to 180°, 2 to 360°, 0.5 to 90°, etc.
Time Analysis: For time analysis, set the degrees for the cycle you wish to observe and the reference TF.
Uniqueness and Added Value:
PRST SQ9 stands out for its ability to merge the Square of 9 with a dynamic price scale and the application of solar degrees, offering users a richer and more varied technical analysis. This unique approach provides traders with a powerful tool to navigate the markets with greater precision and confidence.

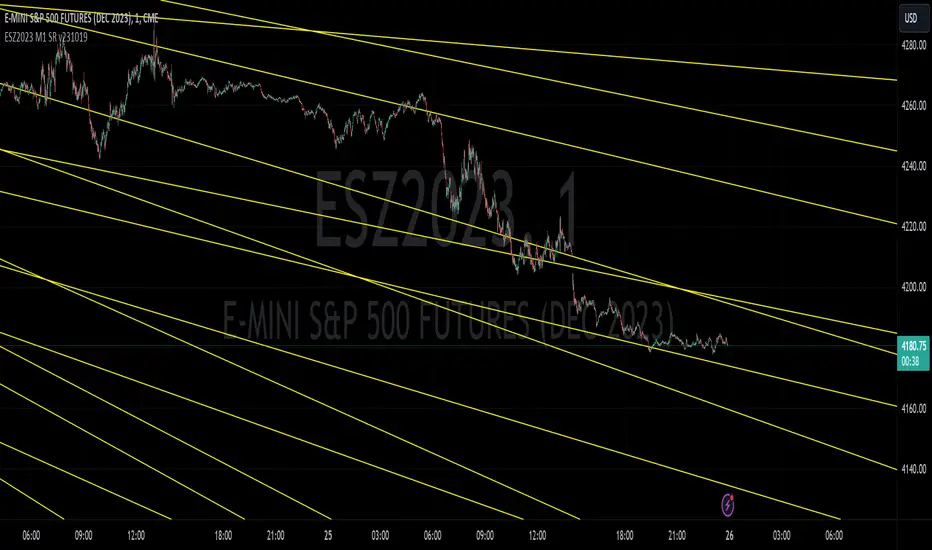
ESZ2023 M1 SR v231019E-mini S&P 500 Futures ESZ2023 Contract Gann Support & Resistance
Description:
Support and resistance angles based on starting date and time stamp and ending date and time stamp, extended to the right in time to show interaction with price. The method of drawing these Gann angles is different than other previously published “Gann angles” and uses an esoteric WD Gann time & price squaring calculation method that he never explicitly published but hid in plain sight in his book " Tunnel Thru the Air ". In the spirit of preserving the originality of Gann’s work, the underlying logic is not being explicitly disclosed here, only an expression of the logic derived from a ‘key’ he left us in his book.
Gann's methods were originally meant for position trading and swing trading larger timeframes. Here these Gann support and resistance levels have been adapted for intraday on the 1-minute chart.
While Gann’s method of calculating support and resistance levels works on any timeframe and instrument, these specific levels published have been calculated for the E-mini S&P 500 Futures ESZ2023 Contract.
What the script does, how it does it and how to use it:
This script draws angles on a chart that represent likely areas where price will encounter support or resistance according to what Gann called the “law of vibration”, suggesting that every instrument moved within its own vibrational frequency.
Gann’s law of vibration can be expressed on a chart as ripples created in still water are expressed by applying surface tension on the water to create the ripples. Similarly, to ripples in water, Gann’s price impulse waves cause price oscillation or ‘ripples’ that resonate through time. These support and resistance levels were calculated based on a single impulse wave in time. The angles represent where time and price square out relative to the impedance of the originating impulse wave.
To use the script, simply apply it to an ES chart on the 1-minute time frame. For improved readability, you should apply a dark theme to your chart. To troubleshoot instances where the lines won’t show for whatever reason, try refreshing the browser or re-applying the script. Panning backwards on the chart to where the line angles start will also get the angle lines to reappear.
What the Different Lines Mean:
Red – These are called ‘axis’ lines and represent very critical support and resistance levels that can signal major trend changes. The axis lines stem from a single impedance point of origin.
Yellow – These are called ‘node’ lines and represent minor support and resistance levels that can signal where price will target or retrace to as it moves towards a higher timeframe price objective. Nodal lines stem from an upper and lower node relative to the wave’s impedance center.
Preserving the Originality of the Script and Usefulness of the Lines Code:
The script dates and timestamps are being protected to deter the proliferation of tampered versions of these Gann calculations which will detract from their usefulness and make it harder for other TradingView users to find the original publisher source.
Dynamic GANN Square Of 9 BandsDynamic GANN Square Of 9 Bands
Created on 3 Sept 2023
Adjust Increment Value:
Customize increment to match symbol and price characteristics for accuracy.
Green Line:
200 EMA. Identifies trend direction; moves with the prevailing trend.
Red Lines:
Mark prominent reversal levels closer to the red range; ideal for mean reversion strategies.
Crossing red levels may indicate trend continuation to the next red level.
Grey Lines:
Show immediate target reversal levels; watch for potential reversals.
Key Features:
Levels are different from Standard Deviation Lines.
Levels remain fixed and parallel, unaffected by volatility.
Despite its dynamism, it can serve as a leading indicator, revealing potential trend changes.
Primarily designed for trend-following strategies.
Additional Tips:
Use additional confirmations
Manage predefined risk and quantity
Additional Resources:
GANN Square Of 9 Pivots:

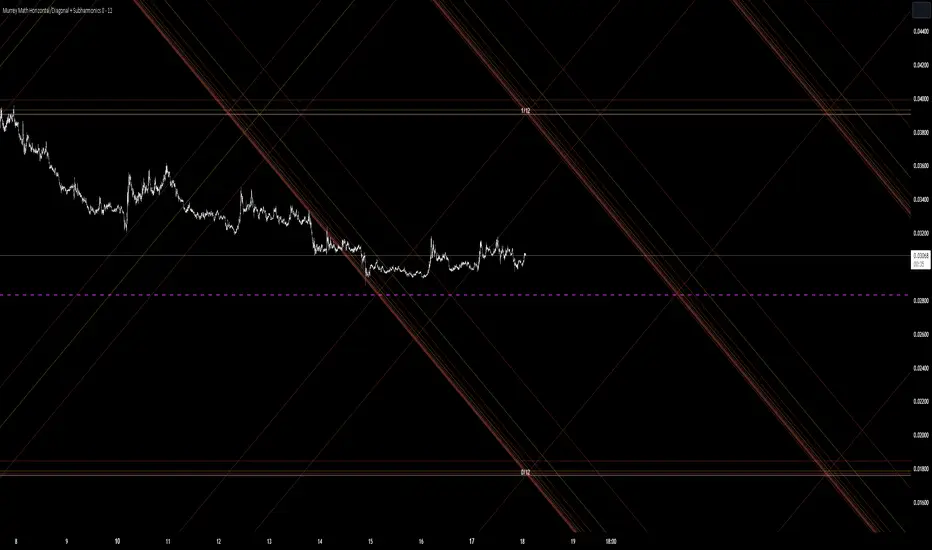
Murrey Math Horizontal/Diagonal + Subharmonics 0 - 12 [All-Time]The Murrey Math lines are created by dividing the range between the high and low of the monthly timeframe prices into equal parts based on the division factor from 2 to 12.
No matter which timeframe you will use, because the calculations based on the most high and low price values.
Better to use > monthly timeframe for faster calculations.
These lines serve as potential support and resistance levels.
The midlines are dashed lines representing the midpoint between two consecutive Murrey Math lines.
The diagonal lines can be enabled to show two different types or both types. These lines connect the highs or lows of the price bars in a diagonal manner.
The subharmonic lines represent smaller divisions within each Murrey Math range. They can be customized to show only strong subharmonics or all subharmonics. Subharmonics are calculated based on the division factor and can provide additional support and resistance levels within the Murrey Math framework.
This script helps visualize the Murrey Math levels and their associated lines on a trading chart, aiding traders in identifying potential price levels for decision-making.
The most strong levels which I tested were: 2, 4, 6, 8, 12.
I was inspired by Gann's work and i tried to implement this indicator.
It's the most accurate version of Murrey Math calculations, you can set the value of 8 which Gann was used but I did up to 12 because of my experiments and I would recommend you to use the value of 12.
This indicator can be used for all types of markets.
Also note, that the strong levels described above is tested on division by 12 setting.
Anyway, you can use the divison of 8 and use the standart strong s/r levels.
(for more information search for Gann 2.0 support resistance on the internet).
Also note: this information is not a financial advice, just my opinion to the indicator I implemented. Please use this indicator wisely and focus to save your money, not earn.
I wish you profitable trades, stick to your risk/money management and the key entry points!
Gann Intraday Retracement Levels, by PVSharmaOne of the greatest technical analyst the world has seen, was The Legendary William Delbert Gann. He had simple, creative principles based on astronomical computations. Although he wasn't an intraday trader, his theories produced outcomes that are just as impressive as delivery trading.
On the basis of his approach, I have created an indicator based on intraday trades that offers high profits at extremely brief stop-losses.
This indicator has been well evaluated, and I can declare with confidence that its excellent performance are based on "buy at dip and sell on peak" principle. Although this indicator has been tested, it does not perform well enough in some instruments, such as Forex, some cryptocurrencies, and a few international commodities.
Please take note that this indicator is excellent for speculating on NSE indexes and is applicable to practically all NSE instruments (apart from Forex). I'm also working on several errors, that I plan to remedy and present to you in the near future

Magic levelsIt is by far the simplest on chart presentation of Gann square of 9. It calculates the levels based on previous day closing. These levels usually acts as support and resistance.

GANN Square Of 9 PivotsGANN Square Of 9 Pivots
How to use for Intraday ?
Method 01 (From 9:05 am to 9:15 am or pre-open market)
Take the Weighted Average Price or Volume Weighted Average Price (VWAP) or Time Weighted Average Price (TWAP) of any stock or index.
You can use TWAP for Index as volume is not available.
Method 02 (From 9:05 am to 9:15 am or pre-open market)
Take the Last Traded Price (LTP) of index or stock
Method 03 (After 9:30 am or after 1st 15 min)
Only take Last Traded Price (LTP) of stock or index
Ideal Time
15min to 1hr after market opens
Indicator Features
Lines
Gray Dashed Line: Calculation Price
Teal Solid Line: Long Above
Red Solid Line: Short Below
3 Teal Dotted Lines: Bullish Targets 1, 2 & 3
3 Red Dotted Lines: Bearish Targets 1, 2 & 3
Labels
1st Numbers: Price
2nd Numbers in (): % change from LTP to that Level
For Index
As VWAP is not available for Index, TWAP (Time Weighted Average Price) values can be used for Index.
Custom Price Inputs
Price of your choice can be given manually by selecting:
Source > Custom
Enter Price > (type the price)
Timeframe
Higher timeframes like Weekly, Monthly can be changed using Timeframe Option
For More Reading
Reading: traderji.com/community/threads/intraday-trading-using-gann-calculator.39185/#post-419677
Calculator: stockmaniacs.net/freebies/free-tools/gann-square-of-9-calculator/

TM24_GANN_LEVELTM24_GANN_LEVEL indicator have price values those play an important role in market structure explanation. This indicator is used with Day_Price _Level indicator with common values .
These price level must be draw with common values of swing? day levels and must be used during trading decision.
Value with " * " shows important level or a price cycle between two " * " values
Price respect to these levels if used with proper logic.
All the levels are very important .
Use the Below Contacts to Access this Indicator

TM_GANN_LEVELTM_GANN_LEVEL indicator have price values those play an important role in market structure explanation. This indicator is used with Day_Price _Level indicator with common values .
These price level must be draw with common values of swing? day levels and must be used during trading decision.
Value with " * " shows important level or a price cycle between two " * " values
Price respect to these levels if used with proper logic.
All the levels are very important .
Use the Below Contacts to Access this Indicator

Love.Gunfire - Giant All For One 巨人VIPGiant is All For One , the Last special version for all markets, optimized by Love.Gunfire from Gann. Each one contains natural numbers. If you want to know the recent support. resistance and trends, read on.
Only disciples who have learned "Giant Weapons" can select VIPs to use and the version will be continuously updated.
There the usage settings:
Enable/Disable signals on chart
Enable/Disable XTV based on trend
Enable/Disable label code to smart trade
How does it work?
Basic usage
After the small/medium giant appears BUY, and above T line, may be you can consider the operation of buying
After the small/medium giant appears SELL, and below T line, may be you can consider the operation of selling
What are the signals?
Advanced usage
The small/medium giant cooperates with the giant weapon operation to confirm the upward trend and consider buying
The small/medium giant cooperates with the giant weapon operation to confirm the downward trend and consider selling
For giants to operate, no matter how to make any transaction, they must have the mind of "continuing to stop making profits is the emperor's way, and strictly guarding against erosion is a virtue."
Want to get this indicator today!
For access, please DM us or visit the link/Telegram below in our Signature.
Contact: Love.Gunfire
US30 CURRENCYCOM:US30
GOLD OANDA:XAUUSD
HKEX:700
FX:EURUSD
BINANCE:BTCUSDT
--------------------------------------------------------------------------------------------
巨人是結合天地為一。特別的版本可以應用全球商品,是由彥暉從江恩中使用八多年來優化而來,每一個都含有自然的數字,如果想知道近來的支持、阻力和趨勢,一定不可錯過。
更新設定方法 :
開啟/關閉 訊號
開啟/關閉 XTV趨勢
開啟/關閉 數字
如何使用?
基本使用方法 :
待小/中巨人出現BUY後配合T線以上 ,可考慮買入的操作動作。
待小/中巨人出現SELL後配合T線以下,可考慮沽空的操作動作。
訊號是什麼?
進階使用方法 :
小/中巨人配合巨人兵器操作,確認向上的趨勢可考慮買入。
小/中巨人配合巨人兵器操作,確認向下的趨勢可考慮沽空。
暫時只開放給「巨人兵器」的弟子和特選VIP使用,版本會持續更新。
巨人操作,無論做任何交易,必須要有「不斷止賺是皇道,嚴守止蝕是美德。」的心思。
立刻行動,良機勿失 !
想獲取權限,請給本族訊息或訪問Telegram,本族簽名中的以下鏈接。
請聯絡 : Love.Gunfire
US30 CURRENCYCOM:US30
GOLD OANDA:XAUUSD
HKEX:700
FX:EURUSD
BINANCE:BTCUSDT

DDS GANN LEVELS v1.0This is the script to provide you Gann Levels between High and Low range from given zeo price levels.
First set the Zero Degree price level in input,then set the high low average.
The 360 degree levels positive and negative side will be plotted from the given price level.
Thanks, hope you like the script, all suggestions will be welcome

gannoddsquare levels from DAY high lowGann Square of 9
Odd square to odd square
Start is auto chosen based upon :
day_close greater than day_open
then start equals day_low
or
day_close less than day_open
then start equals to day_high
Gap == 4 then distance is odd to odd square, Example = 121 -169 , 169-225,...
If Gap is increased to 8 then distance will be double the odd square, Example = 121 -225, 225-289,...,
- 1 odd square distance has been filled with purple background
- total 16 targets
-Any doubt feel free to ask.

gannsquareof9chart2This Indicator works on W.D.Gann Square of 9 chart
gann works on SQUARES: ODD and EVEN
HIGH and LOW of this chart will be the " SQUARES "
this chart provides 7 major and 8 minor levels in between the ODD or EVEN Squares .
major levels are colored in blue and white respectively.
minor levels are colored in olive .
better visibility in dark background
change the color of the levels according to your requirement.
Once the HIGH or LOW (or SQUARES) breaks The next ODD or EVEN SQUARES open up ,
As the breakout of Squares happens the chart expands and acquire the new HIGH or LOW.
I have given Three different resolution option user can switch between:
DAILY ; WEEKLY ; MONTHLY .
thankyou
