Gap Down Reversal Strategy█ STRATEGY OVERVIEW
The "Gap Down Reversal Strategy" capitalizes on price recovery patterns following bearish gap-down openings. This mean-reversion approach enters long positions on confirmed intraday recoveries and exits when prices breach previous session highs. This strategy is NOT optimized.
█ What is a Gap Down Reversal?
A gap down reversal occurs when:
An instrument opens significantly below its prior session's low (price gap)
Selling pressure exhausts itself during the session
Buyers regain control, pushing price back above the opening level
Creates a candlestick with:
• Open < Prior Session Low (true gap)
• Close > Open (bullish reversal candle)
█ SIGNAL GENERATION
1. LONG ENTRY CONDITION
Previous candle closes BELOW its opening price (bearish candle)
Current session opens BELOW prior candle's low (gap down)
Current candle closes ABOVE its opening price (bullish reversal)
Executes market order at session close
2. EXIT CONDITION
A Sell Signal is generated when the current closing price exceeds the highest high of the previous seven bars (`close > _highest `). This indicates that the price has shown strength, potentially confirming the reversal and prompting the strategy to exit the position.
█ PERFORMANCE OVERVIEW
Ideal Market: High volatility instruments with frequent gaps
Key Risk: False reversals in sustained downtrends
Optimization Tip: Test varying gap thresholds (1-3% ranges)
Gaps

Crypto BTC Correlation Scalper Gaps StrategyThis strategy is based on the gaps theory.
In this case we have the BTC futures from CME, which acts in a way similar to stocks, and we can have gaps present between close/open session, and also sometimes between same candle due to huge movements intra candle.
At the same time I have combined this with a daily moving average, to help out a bit with the trend, since we are looking at small timeframe like 1-15/30min .
On top of that we have a reverse option, where long = short and viceversa, which can be used with against BTC pairs .
Rule are simple:
For long, we have a long gap and the close of the correlated candle is above daily sma
For short, we have a short gap and the close of the correlated candle is below daily sma
For exit:
For exit, we take the highest highest values for short entry TP, meaning we get the different from the HH and rest the current open candle distance, and use that distance as a TP.
At the same time for long entry, we take the lowest low value and rest current close of the candle to that value, and we get the TP.
Can also be applied this logic for SL aswell but from the test I have found out that exiting based on a reverse condition(when tp is not being hit), gives better results/dd overall.
If you have any questions, please let me know !

Overnight Gap AnalysisThere is a wide range of opinion on holding positions overnight due to gap risk. So, out of curiosity, I coded this analysis as a strategy to see what the result of only holding a position overnight on an asset would be. The results really surprised me. The script backtests 10+ years, and here are the findings:
Holding a position for 1 hour bar overnight on QQQ since January 2010 results in a 545% return. QQQ's entire return holding through the same period is 643%
The max equity drawdown on holding that position overnight is lower then the buy/hold drawdown on the underlying asset.
It doesn't matter if the last bar of the day is green or red, the results are similar.
It doesn't matter if it is a bull or bear market. Filtering the script to only trade when the price is above the 200-day moving average actually reduces its return from 545% to 301%, though it does also reduce drawdown.
I see similar patterns when applying the script to other index ETFs. Applying it to leveraged index ETFs can end up beating buy/hold of the underlying index.
Since this script holds through the 1st bar of the day, this could also speak to a day-opening price pattern
The default inputs are for the script to be applied to 1 hour charts only that have 7 bars on the chart per day. You can apply it to other chart types, but must follow the instructions below for it to work properly.
What the script is doing :
This script is buying the close of the last bar of the day and closing the trade at the close of the next bar. So, all trades are being held for 1 bar. By default, the script is setup for use on a 1hr chart that has 7 bars per day. If you try to apply it to a different timeframe, you will need to adjust the count of the last bar of the day with the script input. I.e. There are 7 bars per day on an hour chart on US Stocks/ETFs, so the input is set to 7 by default.
Other ways this script can be used :
This script can also test the result of holding a position over any 1 bar in the day using that same input. For instance, on an hour chart you can input 6 on the script input, and it will model buying the close of the 6th bar of the day while selling on the close of the next bar. I used this out of curiosity to model what only holding the last bar of the day would result in. On average, you lose money on the last bar every day.
The irony here is that the root cause of this last bar of the day losing may be people selling their positions at the end of day so that they aren't exposed to overnight gap risk.
Disclaimer: This is not financial advice. Open-source scripts I publish in the community are largely meant to spark ideas that can be used as building blocks for part of a more robust trade management strategy. If you would like to implement a version of any script, I would recommend making significant additions/modifications to the strategy & risk management functions. If you don’t know how to program in Pine, then hire a Pine-coder. We can help!

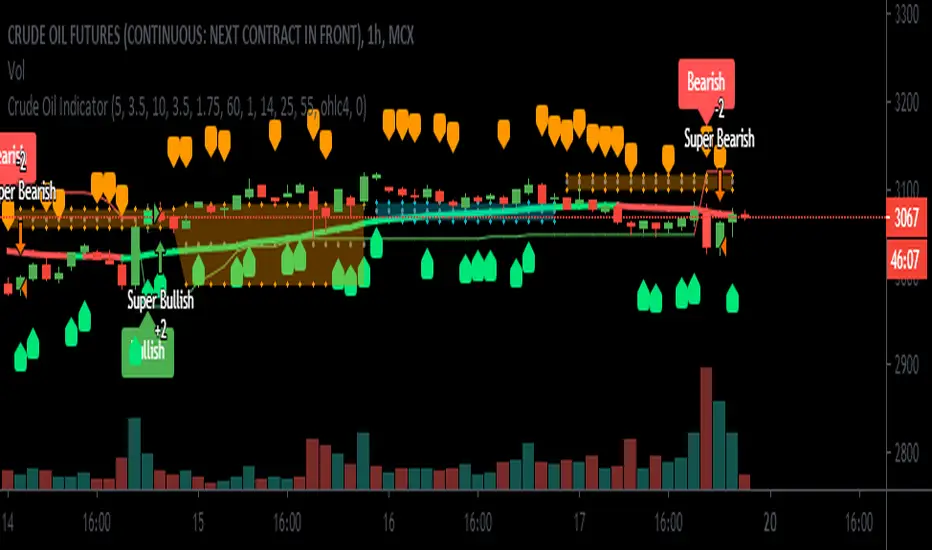
Crude Oil Indicator [SIDD]Crude Oil Indicator is giving two signal Bullish and Bearish . Bullish signal is used to take long trade and Bearish signal is used to close existing long trade and take new short trade and so on.
To get More signal of Bullish and Bearish user must enable More Signals check box that will check crossover and cross down of price close with Gaps.
I am using 2 ATR and one ADX and Gaps and VWMA to make signal profitable with 15 minutes 1 hr ,2hr,3hr,4hr chart time frame.
I have checked last few years data for back testing. Based on past performance it doesn't work well in 30 minute and 1 day chart time frame as results are not good in back testing. I have designed this indicator for Indian crude oil context though it can be used with other market as well.
1st ATR used to find trend with price crossover.
2nd ATR ADX is used to find the trend change details only. I have taken VWMA and ATR both to consider trend change.
Highlight Gap Up and Gap Down is used to know daily market opening gap up and gap down area. Gaps act as support and resistance .
VWMA Plotted as Blue line. Rising VWMA considered as uptrend and falling VWMA considered as downtrend.
Flat VWMA considered as no trend zone. In no trend zone every second third candles cross VWMA .
User must keep the default setting for getting better results as results are back tested. If setting changed then result may vary.
I have added here back tested performance user can see those results. I have added commission and slippage as well. Past year performance not guarantee for future years result so before taking any trade trader must take conscious decision.
This indicator is available on Subscription.
PM/ DM for more information about the script access.
Use the link below to obtain access to this indicator.
Trend Following IndicatorTrend Following Indicator is for following trend and being in trend till trend is not changed.
Each Bullish and Bearish signal you can add one more future or option lot and be in trade till bearish signal is not coming.
You can close Long trade i.e. Bullish pyramiding trade when you see there is small red arrows are there
and similarly when you are in Short trade you can pyramid with each Bearish signal and you can close the trade when small green arrow start coming.
Pros: This signal system is working in stocks and Index and Commodity and Currency.
Cons: Choppy market results are not good on that time you have to believe on small arrows for signals.
This signal is available on subscription. contact me or ping me for more details.
