Blockcircle Global Central Bank Balance Sheet and Money SupplyOVERVIEW
This indicator aggregates money supply (M2) and central bank balance sheet data from the world's largest economies into a single, unified view of global liquidity conditions. Rather than manually tracking dozens of separate data feeds or building your own aggregation logic, you get a ready-to-use tool that pulls from FRED, TradingView Economics, and real-time FX rates to convert everything into USD terms automatically.
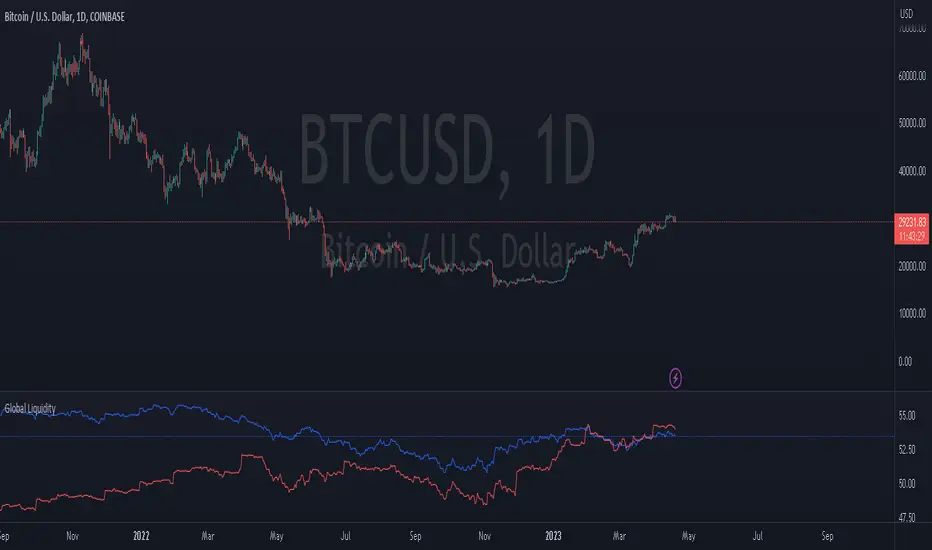
Global liquidity has historically served as a leading indicator for risk assets. When central banks expand their balance sheets and the money supply grows, capital tends to flow into equities, crypto, and other risk-on assets. When liquidity contracts, markets often follow. This indicator gives you that macro context directly on your chart.
The global liquidity movement (expansionary or contractionary) often leads to asset price appreciation/depreciation in CRYPTOCAP:BTC , SP:SPX , etc
WHAT MAKES IT ORIGINAL AND DIFFERENT
Combines both M2 money supply AND central bank balance sheet data in one place, whereas most existing tools focus on only one metric
Aggregates 11 economies for M2 (USA, EU, China, Japan, UK, Canada, India, Russia, Brazil, Australia, Switzerland) and 10 central banks for balance sheet data
Automatically handles currency conversion using live FX rates so all values display in USD
Includes a dedicated US Net Liquidity calculation (Fed Balance Sheet minus Reverse Repo minus TGA) which filters out temporary distortions that other aggregate tools ignore
Provides granular country by country breakdown in the information table so you can identify which central banks are driving the aggregate trend
Offers four moving average types (SMA, EMA, WMA, RMA) for trend smoothing with configurable length
HOW IT WORKS
The indicator requests monthly M2 data from TradingView's Economics feeds for each included country. Central bank balance sheet data is pulled the same way. All non-USD values are converted using daily FX rates from major currency pairs. The script then sums these converted values to produce the Global M2 and Global CBBS lines.
For US liquidity specifically, the script pulls weekly data for the Reverse Repo Program (RRP) and Treasury General Account (TGA) from FRED. Net Liquidity is calculated as: Fed Balance Sheet minus RRP minus TGA. This formula removes funds parked in reverse repos and Treasury cash balances, showing what is actually circulating in the financial system.
KEY FEATURES
Global M2 Money Supply line tracking 11 major economies with individual toggles for each country
Global Central Bank Balance Sheet line tracking 10 central banks with individual toggles
US-specific components, including Reverse Repo, TGA, and Net Liquidity as separate plot lines
Moving average overlays with selectable type and length for identifying trend direction
Fill the option between M2 and CBBS lines to visualize the gap between money supply and central bank assets
Value labels at line endpoints showing current readings and period-over-period percentage change
Comprehensive information table with optional country breakdown view
Full color customization for all lines, configurable line width, and style options
Alert conditions for significant M2 and CBBS changes plus MA crossover signals
HOW TO USE
Add to any chart and observe the overall direction of global liquidity. Rising lines generally support risk on positioning, while declining lines suggest caution
Watch for divergences between the M2 and CBBS lines. If money supply grows faster than central bank assets, private credit may be expanding. If CBBS rises faster, central banks are actively injecting liquidity
Use the US Net Liquidity line to understand short term dollar liquidity conditions separate from longer term global trends
Enable moving averages to filter noise and identify when liquidity trends are changing direction
Toggle individual countries on or off in the settings to see how specific regions contribute to the total
Reference the information table for exact values and percentage changes without leaving your chart
SETTINGS BREAKDOWN
Table Settings: position, text size, and whether to show the country breakdown
Display Settings: toggle visibility for each line, fill area, value labels, percent labels, and the info table
Line Styling: customize colors for each metric, adjust line width, and select solid, dashed, or dotted style
Moving Average: enable or disable MA overlays for M2 and CBBS, select MA type, and set length
Global M2 Countries: individually enable or disable each of the 11 economies
US Liquidity Components: toggle RRP and TGA data
Global CBBS Countries: individually enable or disable each of the 10 central banks
Alerts: set percentage threshold for change based alerts
IMPORTANT CONSIDERATIONS
Data updates depend on the publication schedule of each source. M2 and CBBS data are typically monthly with some delay. US Fed Balance Sheet, US RRP and US TGA update weekly
FX conversion uses daily close rates which may introduce minor discrepancies during volatile currency periods
Some emerging market data may have longer reporting lags than developed market data
Hope you find it useful and impactful to your trading and investment decisions! If you have any questions at all, please just ask, happy to help
Globalliquidity

My-Indicator - Global Liquidity & Money Supply M2 + Time OffsetThis script is designed to visualize a global liquidity and money supply index by combining data from various regions and, optionally, central bank activity. Visualizing this data on a chart allows you to see how central banks are intervening in the financial system and how the total amount of money in the economy is changing. Let’s take a look at how it works:
Central Bank Liquidity
Shows the actions of central banks (e.g. FED, ECB) providing short-term cash to commercial banks. If you see spikes or a steady increase in these indicators, it may suggest that liquidity is being increased through intervention, which often stimulates the market.
Money Supply
M2 money supply is a monetary aggregate that includes M1 (cash and current deposits) plus savings deposits, small term deposits, and other financial instruments that, while not as liquid as M1, can be quickly converted into cash. As a result, M2 provides a broader picture of the available money in the economy, which is useful for analyzing market conditions and potential economic trends.
How does it help investors?
It allows you to quickly see when central banks are injecting additional liquidity, which could signal higher prices.
It allows you to see trends in the money supply, which informs potential changes in inflation and the economic cycle.
Combining both sets of data provides a more complete picture – both in the short and long term – which makes it easier to predict upcoming price movements.
This allows investors to better respond to changes in central bank policy and broader monetary trends, increasing their chances of making better investment decisions.
Data Collection
The script retrieves money supply data for key markets such as the USA (USM2), Europe (EUM2), China (CNM2), and Japan (JPM2). It also offers additional money supply series for other markets—like Canada (CAM2), Great Britain (GBM2), Russia (RUM2), Brazil (BRM2), Mexico (MXM2), and New Zealand (NZM2)—with extra options (e.g., Australia, India, Korea, Indonesia, Malaysia, Sweden) disabled by default. Moreover, you can enable data for central bank liquidity (such as FED, RRP, TGA, ECB, PBC, BOJ, and other central banks), which are also disabled by default.
Index Calculation
The indicator calculates the index by adding together all the enabled money supply series (and the central bank data if activated) and then scales the sum by dividing it by 1,000,000,000,000 (one trillion). This scaling makes the resulting values more manageable and easier to read on the chart.
Time Offset Feature
A key feature of the script is the time offset. With the input parameter "Time Offset (days)", the user can shift the plotted index line by a specific number of days. The script converts the given offset in days into a number of bars based on the current chart's timeframe. This allows you to adjust for the delay between liquidity changes and their effect on asset prices.
Overall, the indicator plots a line on your chart representing the global liquidity and money supply index, allowing you to visually monitor trends and better understand how liquidity and central bank actions may influence market movements.
What makes this script different from others?
Every supported market—both major regions (USA, Eurozone, China, Japan, etc.) and additional ones—is available. You can toggle each series on or off, so you can view only Money Supply data, only Central Bank Liquidity, or any custom combination.
Separated Data Groups. Inputs are organized into clear groups (“Money Supply”, “Other Money Supply”, “Central Bank Liquidity”), making it easy to focus on just the data you need without clutter.
True Day‑Based Offset. This script converts your chosen “Time Offset (days)” into actual days regardless of timeframe. Whether you’re on a 5‑minute or daily chart, the index is always shifted by exactly the number of days you specify.

M2 Global Liquidity Index [Extended + Offset]M2 Global Liquidity Index
This indicator visualizes global M2 money supply, weighted in USD, based on major economic regions.
Features:
Standard Mode: Includes M2 data from the USA, China, Eurozone, Japan, and the UK.
Extended Mode: Adds Switzerland, Canada, India, Russia, Brazil, South Korea, Mexico, and South Africa.
Offset Function: Adjustable time lag (78 or 108 days) to analyze the delayed impact of liquidity on financial markets.
Use Case:
Designed to help identify global liquidity cycles and assess potential turning points in financial markets. Rising global liquidity generally supports risk assets like equities and crypto, while declining liquidity can put downward pressure on these markets.
Technical Details:
Non-USD M2 values are converted using real-time FX rates.
All values are displayed in trillions of USD (Tn).
Note:
Not all countries release M2 data in real-time or at the same frequency. Minor delays and discrepancies may occur.
Example:

Global LiquidityThe "Global Liquidity" script is an indicator that calculates and displays the global liquidity value using a formula that takes into account the money supply of several major economies. The script utilizes data from various sources, such as the Federal Reserve Economic Data (FRED), Economics, and FX_IDC.
The indicator plots the global liquidity value as a candlestick chart and breaks it down into two categories: the Euro-Atlantic region (West) and the rest of the world (East). The values are denominated both in inflation-adjusted dollars and in trillions of dollars. The script also calculates the spread between the Euro-Atlantic region and the rest of the world.
Traders and investors can use this indicator to gauge the overall liquidity of the global economy and to identify potential investment opportunities or risks. By breaking down the liquidity value into different regions, traders can also gain insights into regional economic trends and dynamics.
Note that this script is subject to the terms of the Mozilla Public License 2.0 and was created by rodopacapital.