Volume Profile Matrix [LuxAlgo]The Volume Profile Matrix indicator extends from regular volume profiles by also considering calculation intervals within the calculation window rather than only dividing the calculation window in rows.
Note that this indicator is subject to repainting & back-painting, however, treating the indicator as a tool for identifying frequent points of interest can still be very useful.
🔶 SETTINGS
Lookback: Number of most recent bars used to calculate the indicator.
Columns: Number of columns (intervals) used to calculate the volume profile matrix.
Rows: Number of rows (intervals) used to calculate the volume profile matrix.
🔶 USAGE
The Volume Profile Matrix indicator can be used to obtain more information regarding liquidity on specific time intervals. Instead of simply dividing the calculation window into equidistant rows, the calculation is done through a grid.
Grid cells with trading activity occurring inside them are colored. More activity is highlighted through a gradient and by default, cells with a color that are closer to red indicate that more trading activity took place within that cell. The cell with the highest amount of trading activity is always highlighted in yellow.
Each interval (column) includes a point of control which highlights an estimate of the price level with the highest traded volume on that interval. The level with the highest traded volume of the overall grid is extended to the most recent bar.
GRID

Grid Range Volatility BasedThis TradingView Pine script implements a grid range volatility based indicator that displays dynamic horizontal lines on the chart. The lines are calculated based on the average true range (ATR) of the security being plotted, and the range can be adjusted using an input parameter. The distance between the top and bottom lines is displayed as a percentage in a dynamic label that updates with each new bar.
The script allows the user to choose whether to use red or black lines, and also provides options to set the number of days for range calculations, and the calculation type (either ATR(1) or ATR(x)). The script is designed to work with stocks, forex, and other securities that have price data.
To use this script, simply attach it to a chart and adjust the input parameters to suit your analysis needs. The dynamic lines and percentage label will be displayed on the chart, providing a visual representation of the range volatility of the security being plotted. The values of the highest and lowest lines can also be displayed as labels on the price axis, providing additional context for the range volatility.

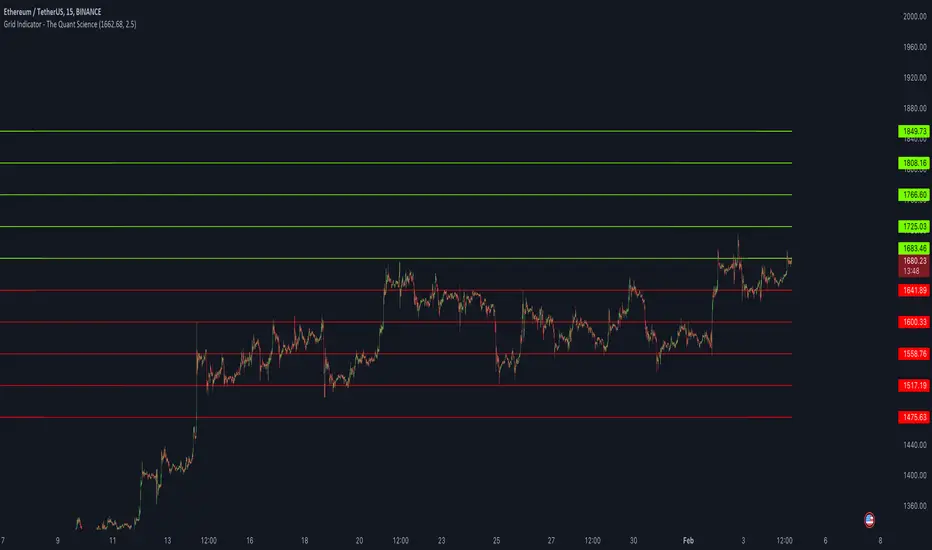
Grid Indicator - The Quant ScienceQuickly draw a 10-level grid on your chart with our open-source tool.
Our grid tool offers a unique solution to traders looking to maximize their profits in volatile market conditions. With its advanced features, you can create customized grids based on your preferred start price and line distance, allowing you to easily execute trades and capitalize on price movements. The tool works automatically, freeing up your time to focus on other important aspects of your trading strategy.
The benefits of using this tool are numerous. Firstly, it eliminates the need for manual calculation, making the analysis process much more efficient. Secondly, the automatic nature of the tool ensures that each grids are draw at precisely prices, giving you the best possible chance of maximizing your analysis. Finally, the ability to easily customize grids means that you can adapt your strategy quickly and effectively, even in rapidly changing market conditions.
So why wait? Take control of your trading and start using our innovative grid tool today! With its advanced features and ease of use, it's the perfect solution for traders of all levels looking to take their trading to the next level.
HOW TO USE
Using it is easy. Add the script to your chart and set the price and distance between the grids.
Assassin's Grid
Introduction: Are you a fan of automated grid-based trading and holding onto your crypto assets like they're the last Snickers bar in the world? If so, this Pine script could be your new best friend!
Grid Trading Genius: The script uses some seriously advanced grid trading techniques to automatically place orders at different price levels, creating a mesh of positions that move with the market like a well-oiled machine. This strategy can be great for traders who are willing to sit back and let their positions grow like a fine wine over time.
Optimization Features: The script comes loaded with all sorts of features and tools to help traders optimize their grid positions, like position exits and custom alerts for creating limit and market orders. This helps keep traders in the loop and allows them to take action as needed, like a ninja in the night.
Unique Twists: One of the unique features of this script is the option to choose between normal or incremental entry steps in a 1,2,3,... ratio. By choosing incremental entries, traders can potentially improve their average price and increase their potential profits like a boss. Just keep in mind that this script doesn't have a stop loss feature, but it does include the option to sell without profit on the final entry or on all entries if desired. Additionally, the script is always open to improvement and any ideas for improving it are welcome, like a blank canvas.
Conclusion: If you love automated trading and have the patience and determination to stick to a solid strategy, this Pine script could be a great fit for you. It's suitable for traders who are comfortable with more complex trading approaches and are willing to put in the time and effort to learn and master the script's various features and techniques, like a Jedi Knight
Moving Grid Trader - With AlertsThis script used a grid system that is set when a "buy" signal is sent to generate profits inside of a range. This script used macd to weed out bad buys and then sells once the price either reaches the grid - or hits the stoploss. This works best in bullish and ranging markets.

Ultimate Grid Tool + Alerts (DCA & Limit Orders) [enzedengineer]Overview
The "Ultimate Grid Tool + Alerts" script works much like a grid bot from automated trading services such as 3Commas making it a good free alternative with some extra utility.
How it works
The user is prompted to set up a grid by manually defining a lower and upper range and then by selecting how many grid segments they want (max 20). The script will automatically create equally spaced grids within this defined range. The script has built in alerts which are intended to be used in conjunction with a third-party application to execute buy and sell orders on an exchange.
The script has two alert functionalities to choose between:
Limit orders (like traditional grid bots) or;
DCA zones (time-based)
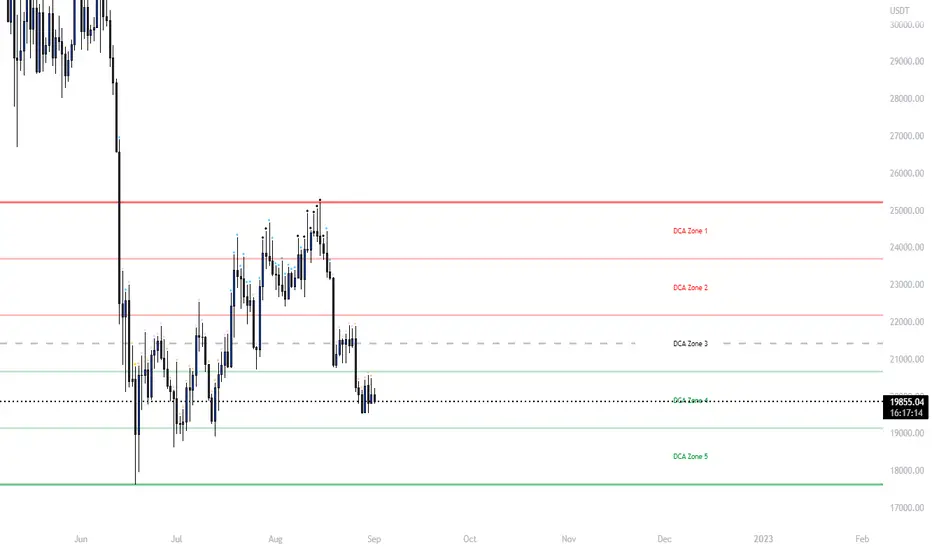
DCA zones:
This is the default selection. Each zone has its own alert condition which is triggered if the price closes within that zone. The frequency of the alert is determined by the user's chart resolution, therefore you can have the alert trigger every day, or 4 hours, or 30 minutes and so on. This allows for flexibility, for example, you could go from DCA'ing at $20 per day at higher prices to $100 per day as the price drops into the lower end of your grid range.
Limit orders:
This mode is selected by checking the "Limit Order" box. As mentioned earlier, this mode works like traditional grid bots with each grid line representing a limit order. The alert condition is met when ta.cross(close, gridline) = true.
Buy and Sell:
This mode is selected by checking the "Buy and Sell" box. This is a visual modification only which changes the colour of the grids to help plan the user's trading. Please note, there is no buying or selling logic within the script itself - this should be built into the alert message to be used with a third-party application for exchange order execution.
Use case: The author of this script has been using it with the default settings to DCA into Bitcoin in the current bear market. Using a chart resolution of 15 minutes the script purchases x-amount of Bitcoin every 15 minutes (Alertatron executes the exchange orders). This method provides a well blended average price and takes away the internal conundrum of "should I buy some today". No matter what, the bot will make a purchase within at least 15 minutes of the ultimate Bitcoin bottom and arguably this gives a psychological edge and reduces FOMO (fear of missing out).
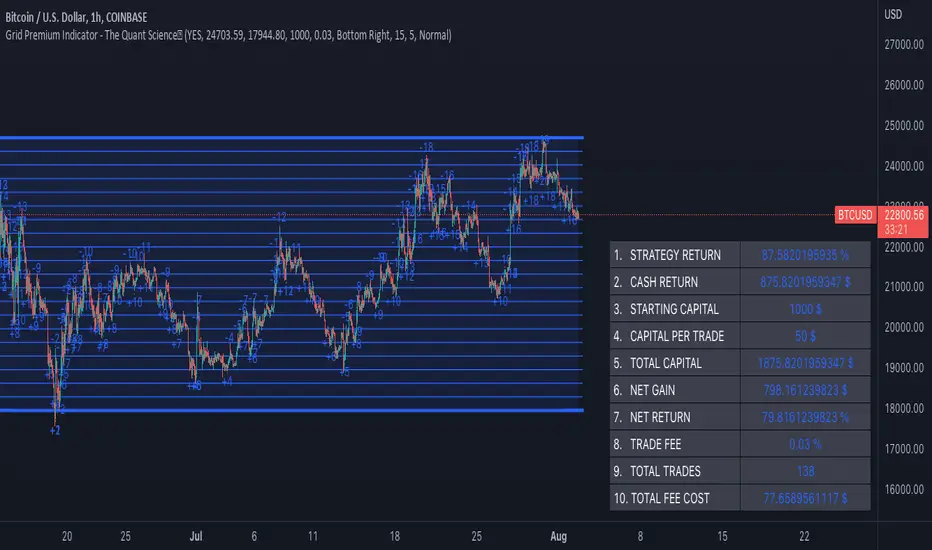
Grid Premium Indicator - The Quant ScienceGrid Premium Indicator - The Quant Science™ is an indicator that represent the grid trading strategy. Unlike our GRID SPOT TRADING ALGORITHM (which buys in a "buy the dip" style, offering a swing type operation) this indicator uses a trend following strategy with a larger number of grids.
A trend-following strategy in a grid algorithm allows you to open long positions if price rises and breaks up or open short positions if price breaks down.
This indicator was created following the guidelines of the best grid algorithms on 3Commas, Bitsgap, Kucoin, and Binance.
Our goal is to recreate a universal and trust model for all traders and investors who use grid algorithms for their trading.
The ideal market condition as for all grid algorithms is the side market. In the side market this algorithm will create profit during upward movements.
The trader using this algorithm can use it to:
1. Manual trading
2. Backtesting
3. Algorithmic trading
HOW TO SET UP
Using this indicator is very simple. We have configured the creation for a three-step set up. You can manage it without any problems experience in coding. All you have to do is click the grid start and end level and the indicator will automatically load generating the grids and backtesting.
OPERATIVITY
Each open trade is long and is opened when the price crossover an upward level. Each order is closed at the next level. If the price breaks upward or downward the extremes of the grid the algorithm stops trading and will not open any more positions.
FEATURES
Grids: this indicator generates 20 levels of grids.
Direction: opens exclusively long positions.
Strategy: trend-following.
Data table: a table collects all the quantitative data on the strategy's performance. By entering your broker's commission costs and initial capital you will have an instant report on the strategy's performance.
MAIN ADVANTAGE
Compound Interest: the high number of grids allows the gains from each trade to be reinvested quickly by speeding capitalization through compound interest.
LIMITATIONS OF THE MODEL
Like all grid strategies, maximum profit is made when the market is flat or sideways. A market with a bullish or bearish trend does not allow you to generate good profits with this strategy.
Grid Settings & MMThis script is designed to help you plan your grid trading or when averaging your position in the spot market.
The script has a small error (due to the simplification of the code), it does not take into account the size of the commission.
You can set any values on all parameters on any timeframe, except for the number of orders in the grid (from 2 to 5).
The usage algorithm is quite simple:
1. Connect the script
2. Install a Fibo grid on the chart - optional (settings at the bottom of the description)
3.On the selected pair, determine the HighPrice & LowPrice levels and insert their values
4.Evaluate grid data (levels, estimated profit ’%’, possible profit ‘$’...)
And it's all)
Block of variables for calculating grid and MM parameters
Variables used regularly
--- HighPrice and LowPrice - constant update when changing pairs
--- Deposit - deposit amount - periodically set the actual amount
Variables that do not require permanent changes
--- Grids - set the planned number of grids, default 5
--- Steps - the planned number of orders in the grid, by default 5
--- C_Order - coefficient of increasing the size of orders in the base coin, by default 1.2
--- C_Price - trading levels offset coefficient, default 1.1
--- FirstLevel - location of the first buy level, default 0.5
--- Back_HL - number of candles back, default 150
*** For C_Order and C_Price variables, the value 1 means the same order size and the same distance between buy levels.
The fibo grid is used for visualization, you can do without it, ! it is not tied to the script code !
You can calculate the levels of the Fibo grid using the formula:
(level price - minimum price) / (maximum price - minimum price)
For default values, grid levels are as follows:
1 ... 0.5
2...0.359
3 ... 0.211
4...0.0564
5...-0.1043
Short description:
in the upper right corner
--- indicator of the price movement for the last 150 candles, in % !!! there is no task here to "catch" the peak values - only a relative estimate.
in the upper left corner
--- total amount of the deposit
--- the planned number of grids
--- “cost” of one grid
--- the size of the estimated profit depending on the specified HighPrice & LowPrice
in the lower left corner
--- Buy - price levels for buy orders
--- Amount - the number of purchased coins in the corresponding order
--- Sell - levels of profit taking by the sum of market orders in the grid
--- $$$ - the sum of all orders in the grid, taking into account the last active order
--- TP - profit amount by the amount of orders in the grid

Custom GridIt's a simple little tool that enhances Tradingview's horizontal level grid. Set the range of up to 12 assets, you save your model, and the levels will show up automatically when you switch between graphs.
it is obvious to note that the market reacts on the round levels if it discovers its levels for a long time.
Where using notions of supports / resistances gives you level information once the level has been created, again you can correlate this indicator with other SMC and price action tools to identify areas of rejections or dips. institutional interventions.

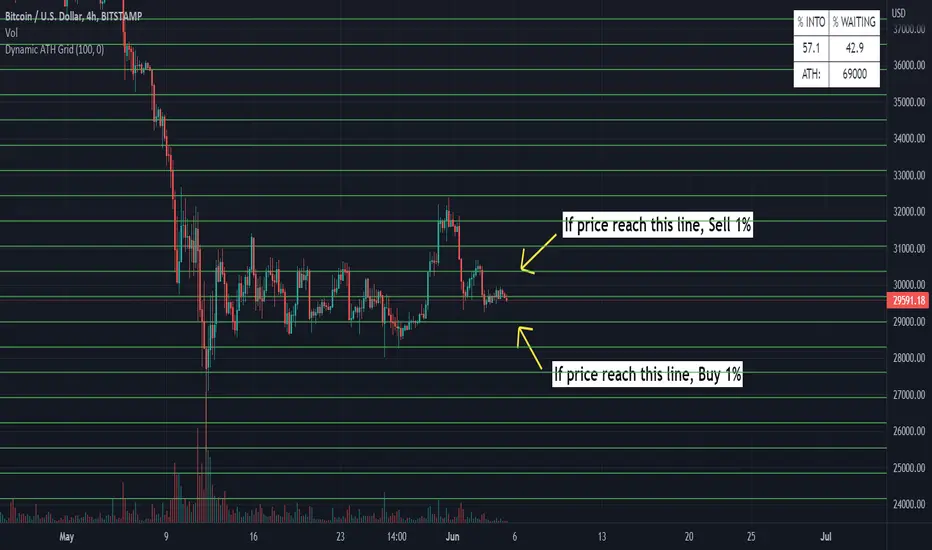
Dynamic ATH Grid
Indicator to profit all market movements.
The idea behind this indicator is:
- to sell 1% if price reach upside line
- to buy 1% if price reach downside line
This going to take profit from volatility of market.
Use only in the most reliable values, it have risk in less reliable values
- In cases of big crashes / going to 0, it will make loose your capital (exactly as if you have hold )
More indicators will be added.
Thanks for all
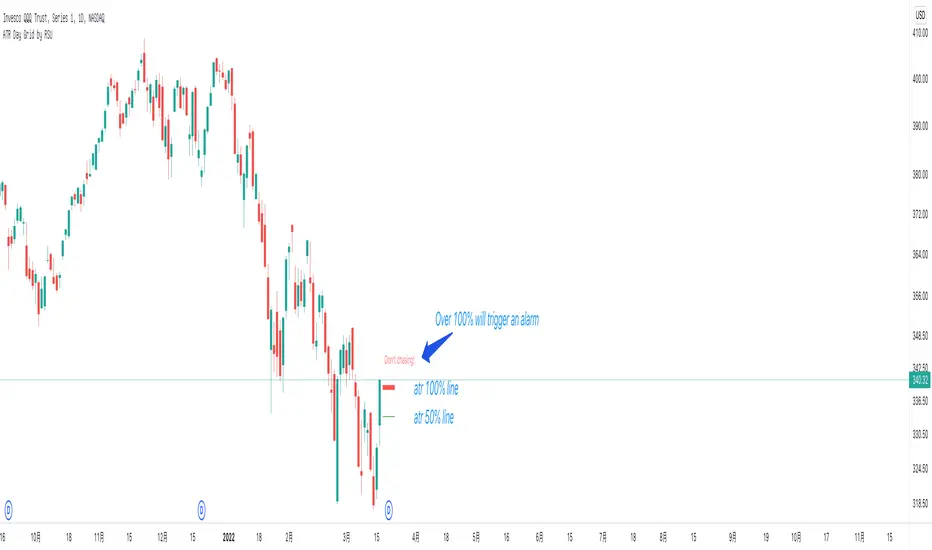
ATR Day Grid by RSUATR at the daily and intraday prompt lines, it is recommended to trade within 50%, and if it exceeds 50%, there is a risk of chasing high.
At the minute level,Day-level ATR grid line is displayed.
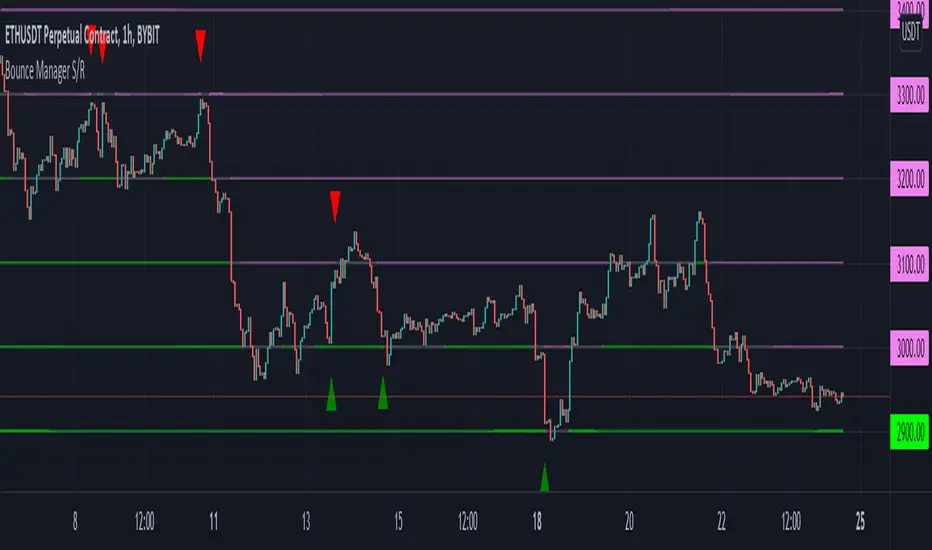
Bounce Manager S/RThis script is based on the bounce manager ATR script
The S/R script is made for manual input of horizontal S/R lines, the script will then see if price respects these levels by the parameters you input in settings panel. On a respectable bounce it will print buy/sell arrows. The script also has functionality to send alerts, this is helpful if you want to automate S/R lines.
An easy strategy to use would be the one you see in the preview using a grid of round numbers. This script in no way shape or form promises easy gains and like all algorithms should be forward tested on a paper trading account before using real money.
components:
- Max violation: When price moves past this the script will no longer look for entry until a new trend has been established. The line can also be used as a stop loss.
- Confirmation line: When price touches the line during a trend it
will wait to cross over this line to confirm a reaction from the line.
- Min past distance: A trend filtering system, this is a distance from
the line price has to break to confirm trend direction.
- Stop loss: This can be set to a percentage distance from the low after
bounce. Or it can be set to the max violation line
- Take profit: This can be a fixed take profit target or a risk to reward
based take profit. With risk to reward it will multiply the stop loss
distance by the input and use that to create target (green cross)
- ATR based or % based: there are 2 versions of the script, one for strict
percentage based logic and another one based on ATR values
Part of the Honest Algo service.
Fibonacci Grid [LuxAlgo]The following indicator returns multiple diagonal lines forming a grid. Each line has 45-degree and is set depending on Fibonacci ratios as well as the maximum and minimum price value over a certain lookback period. These can be used as potential support and resistance.
Users also have the option to set equidistant lines instead of having them determined by Fibonacci ratios.
Settings
Length: Lookback period for determining the maximum/minimum price value used for constructing the grid.
Resolution: Grid resolution, higher values will return more lines (only available when the "Use Fibonacci Ratios" is disabled)
Use Fibonacci Ratios: Set the lines based on Fibonacci Ratios, 6 ratios are used.
Usage
Each individual diagonal line can be used as support/resistance. Two Diagonal lines form channels where the price might evolve until a breakout.
The underlying logic of this grid determined by Fibonacci ratios is that price variations farther away from the main diagonals (in orange) would tend to move inside tighter channels.
Diagonals set using Fibonacci Ratios will form tighter channels when away from the center of the Lookback area. While equidistant lines will keep the same distance between each line.

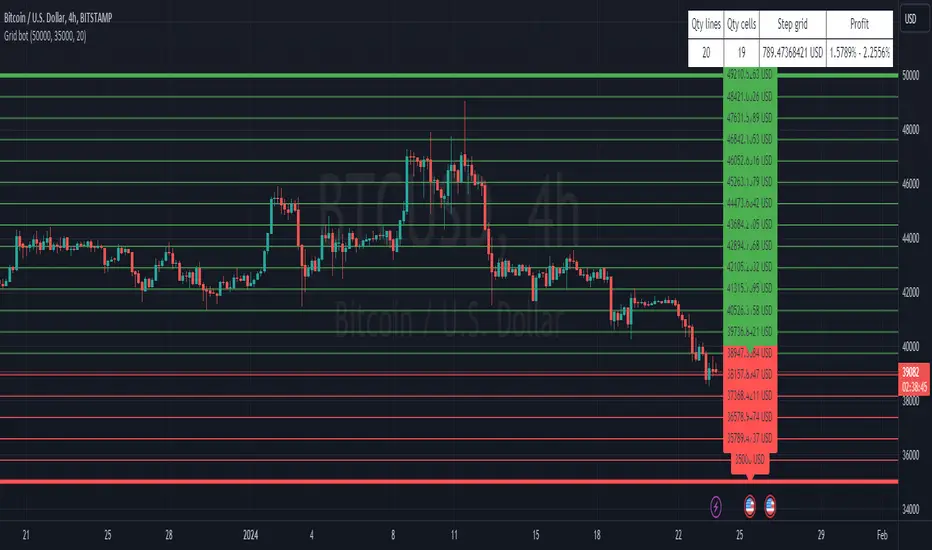
3commas GRID bot VisualisationHello everyone
This is a grid display indicator for a 3-comma grid bot.
Just enter the upper and lower borders of your grid and the number of grid cells in the indicator settings.
It's simple!
Percentage Range IndicatorThe Percentage Range Indicator is useful for assessing the volatility of pairs for percentage-based grid bots. The higher the percentage range for a given time period, the more trades a grid bot is likely to generate in that period. Conversely, a grid bot can be optimised by using grids that are less than the Percentage Range Indicator value.
I have been using the Percentage Range Indicator based on the one hour time period and 168 periods of smoothing (seven days based on one-hour periods).
Enjoy.

Fear Of Missing Out grid of forex tradingAbstract
This script finds potential safe grids placing limit orders without fear of missing out.
This script computes grids according to power of 1.0025 .
You can reference those price levels for your trading.
Introduction
Grid trading is a popular trading method.
Traders plan several price levels as grids and repeat buying at lower grids and selling at higher grids.
Grids can be round number like multiple of 100 pips.
Grids can also be support and resistance according to price history.
Some traders may think they need to adjust grids to trade.
However, there are several problems in choosing grids.
One problem is rate of change is related and therefore exponential. 20 to 30 is different from 30 to 40.
Another interesting point is there are some special impressing reversal price levels.
Several months ago, I had a question why usdjpy bounced near 108.3 .
After using a calculator, I found that 108.3 = 100 * 1.083 ≒ 100 * pow(1.0025,31) .
1.0025 , as known as 0.25% of change, is a potential stop out zone.
Therefore, we can compute grids and one grid is a little more than 1.0025 times than an another one.
After we finished computing grids, we can consider buy and sell near those grids.
Note that different traders may obtain different grid values.
For example, from 1.0 to 2.0 , it can be splited as 270 grids or 277 grids because pow(1.0025,277)<2 .
Those grids cannot always imply potential reversal points but they can be useful for traders looking for 0.25% profit targets with reducing fearing of buying or selling too early.
Computing grids
This script split from 1.0 to 10.0 into three segments.
One is 1.0 to 2.0 .
The second segment is from 2.0 to 5.0 .
The third segment is from 5.0 to 10.0 .
This script does the same thing for 0.1 to 1.0 , 10.0 to 100.0 , and so on.
For 1.0 to 2.0 and 5.0 to 10.0 , this script split a segment as 270 grids.
For 2.0 to 5.0 , this script split a segment as 360 grids.
The last step is display the next grids to the daily low and daily high.
Maybe also display the grids behind grids shown.
Parameters
x1,x2,x3,x4 : display the next x1,x2,x3,x4 grids to daily high and daily low. 1 means the next grid to daily high and daily low. 2 means the next grid to 1.
x_seg : default 2.0 . This script split from 1.0 to 10.0 into three segments. One is 1.0 to x_seg. The second segment is from x_seg to 10.0/x_seg . The third segment is from 10.0/x_seg to 10.0 .
x_grid1 : how many grids in the first segment
x_grid2 : how many grids in the second segment
x_lowprice : add this number for bigger grid distance. Generally, you don't need this number when trading forex but you may need it in stock trading. For stocks with price between 50 to 100, I recommend you use x_lowprice=100.
Conclusion and suggestions
This script can find potential grids for trading.
If price touches grids usually, we can consider buy and sell after price touches grids.
If price reverses before touching grids usually, we may consider buy and sell before price touches grids.
Those grids can remind us don't buy too much unless the price touches the next grid.
For instruments with less volatility, maybe we need more grids.
For traders with more money, they may also consider more grids for more dedicated range trading to collect more profit.
Reference
Sorry, I forgot them.

Volatility Adjusted Grid [Gann]█ OVERVIEW
Gann Square of 9 is one of the many brilliant concepts from W.D.Gann himself where it revolves around the idea that price is moving in a certain geometrical pattern. Numbers on the Square of 9 spiral tables, especially those lie in every 45degree in the chart act as key vibration levels where prices have tendency to react to (more on the table below).
There are few square of 9 related scripts here in Tradingview and while there's nothing wrong with them, it doesn't address 1 particular issue that i have: The numbers can be too rigid even when scaled based on current price because the levels are fixed, which makes them not tradable on certain timeframes depending on where the price currently sitting.
Heres 5min and 1hour Bitcoin chart to illustrate what i mean: Grey line on the left is based on Volatility Adjusted levels, while red/blue on the right are the standard Gann levels.
You can see that on 1hour chart, it provides a good levels (both Volatility Adjusted and the standard one happened to share the same multiplier in this case),
1Hour Chart:
On 5 min chart tells a different story as the range between blue/red levels can be deemed as to big for a short term trade, while the grey line is adjusted to suit that particular timeframe (You can still adjust to make it bigger/smaller from the settings, more on this below)
5Min Chart:
█ Little bit on Gann Square of 9 table
This is the square of nine table, the numbers highlighted in Red are known as Cardinal Cross and considered to be a major Support/Resistance while those in Blue color are known as Ordinal Cross considered as minor (but still important) Support/Resistance levels
Similarly, this script use these numbers (and certain multipliers) to print out the levels, with Cardinal numbers represented by solid lines and Ordinal numbers by dotted lines.
█ How it Works and Limitations
The Volatility Adjusted grid will go through several iterations of different multipliers to find the Gann number range that is at least bigger than times ATR. Because it's using ATR to determine the range, occasionally you'll notice that the line become smaller as ATR contracting (and vice versa). To overcome this, you can change the size range multiplier from the settings to retrieve the previous range size.
Use the size guide at the bottom left to find the multiplier that suits your need:
1st Row -> Previous Range -- Change Range Size to number lower than this to get a smaller range
2nd Row -> Next Range -- Change Range Size to number higher than this to get a larger range
Example:
Before:
After:
As you'll soon realise, the key here is to find the range that fits the historical structure and suits your own strategy. Enjoy :)
█ Disclaimer
Past performance is not an indicator of future results.
My opinions and research are my own and do not constitute financial advice in any way whatsoever.
Nothing published by me constitutes an investment recommendation, nor should any data or Content published by me be relied upon for any investment/trading activities.
I strongly recommends that you perform your own independent research and/or speak with a qualified investment professional before making any financial decisions.
Any ideas to further improve this indicator are welcome :)

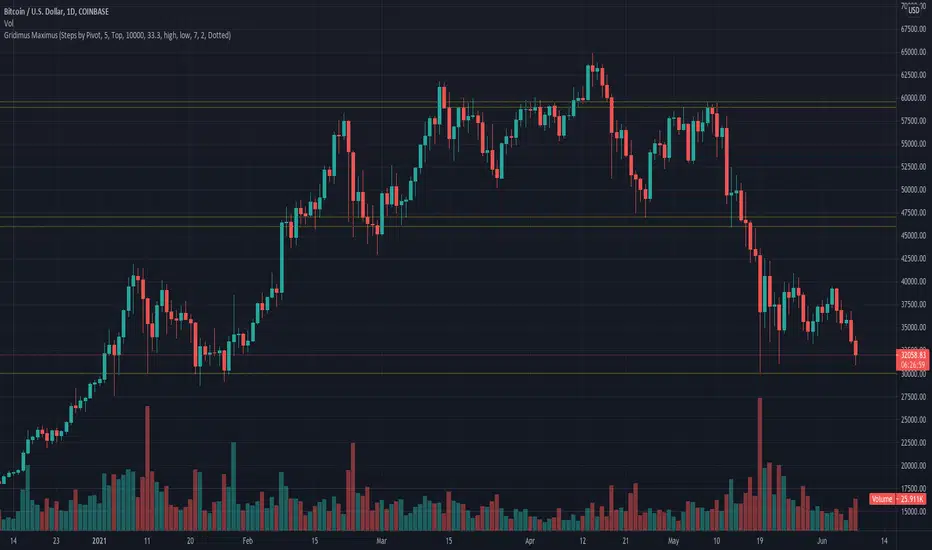
Gridimus MaximusGridimus Maximus draws N grid lines stepping by price or percent in chosen direction from set price, or draws N grid lines stepping by pivots.
The queue function method used is adapted from an example provided on the PineCoders website, much gratitude to LucF for this gem!
To prevent grid lines out of range from causing chart to rescale right click on chart's price column and enable Scale Price Chart Only.
Pictured example above is using Type Of Increment: Steps By Pivot, Number Of Steps: 5.
Pictured example below is using Type Of Increment: Steps By Price, Number Of Steps: 6, Starts From Price: $10k, Steps By Percent Or Price: $10k.
Pictured example below is using Type Of Increment: Steps By Percent, Number Of Steps: 7, Starts From Price: $10k, Steps By Percent Or Price: 33%.
NOTICE: This is an example script and not meant to be used as an actual strategy. By using this script or any portion thereof, you acknowledge that you have read and understood that this is for research purposes only and I am not responsible for any financial losses you may incur by using this script!
MA+ ROC MTF DashboardThis is a Multi Timeframe moving average ROC (percent of change) dashboard.
This dashboard shows percent of change of current price to a moving averages on different time frames.
Most left value in the dashboard always represents your chart time frame, while the next 3 represent other time frames which you can set in 'MA+ ROC' settings.
Support User Defined time frames or automatic time frames based on a multiplier value.
Better define same or higher time frames than your chart time frame to get accurate results.
Can work in conjunction with MA+ to display the moving average line, click here:
Like if you Like and follow-up for up coming new indicators: www.tradingview.com

Grid bot development I have completed the next stage of my grid bot which is to isolate the instances in which the market will move sideways in a narrow range.

Rudimentary Grid bot ideaUsing Eulerian principles yet again, this is the beginning of my first grid bot script. Use as static S&R when trading manually. Good for SL and TP setting too.

Horizontal Plot Lines - Max. 24 - grid strategy - DARK LINESWhen I looked for something like this I couldn't find it. Although simple in appearance, this script was actually quite long and complicated to create. It allows you to break up any horizontal space in up to 24 lines. Just remember that 13 lines equal 12 levels, as the top and bottom lines are the placeholders. So, if you are using quarters theory, you would want to select 5 lines.
It automatically sets the top line at a user-selectable place, like the close of the highest candlestick. It also allows you to select the lowest point as the close or the low. This way you can use the bodies of the candlestick or the wicks. You can also set the lookback period, so that your high and low can be set as far back as you prefer in the timescale you are looking at.
You can use these lines in things like quarters theory, or analyze buy and sell points in a grid bot strategy. This indicator could help you to determine where to equally place your buy and sells in a grid with up to 24 different placements.
This version has dark lines and is suitable for the light template. There is a matching light line version for a dark template.

Grid SystemThis script plots a a square composed of 8 equilateral triangles ("grid"). User can set the frequency of calculation/interval by adjusting the 't' parameter.
Steps for calculating grid:
1. Find the highest high and lowest low for last 't' periods.
2. Calculate midpoint for prices during that interval (highest high + lowest low) / 2.
3. Center of the grid = {time , price midpoint}.
Interpretation:
Volatility : If price is volatile for a given period, the area of the grid will expand, since the top and bottom sides are based on the highest high and lowest low for the period. So as range for a given period increases, the grid's area increases.
Support and resistance : The grid's center line often acts as the support / resistance line.
Trend Following : The example chart shows Cognex (CGNX) price using an interval of t=365. When the stock's trend was bullish, the area of the grids became increasingly larger and the y-coordinate of each grid was greater than that of the previous grid.
