Grid Bot RSIGrid Bot Simulator. Based on RSI levels.
How it works:
Prices are divided into grids, or trade zones, that are based on RSI levels. Buys will trigger when the RSI crosses into a higher zone, after descending. Sells will trigger when the RSI crosses into a lower zone, after ascending. After triggering, a new signal will not be produced until the RSI progresses into better zone.
Standard Settings :
RSI Length
Number of Grids
RSI Type : Standard RSI or Jurik RSX (based on Everget’s formula)
Show All Grids
Experimental Features (Adjust in settings menu) :
No Trade Zone : RSI Levels where no trades will be signaled. Adjust to prevent over-buying/selling in narrow markets. Default: 35-65:
No Trade Zone (40-60)
Aggression Level : Increase aggressiveness to stack buys/sells at extreme RSI levels:
Aggression = high
Aggression = low
Market Direction : If market is trending up, the bot will skip every other sell ( = more buys than sells). If down, will skip every other buy (more sells than buys). Default: neutral.
Market Direction: down
Market Direction: neutral
Gridtrading

Grid Bot SimulatorThis script is a grid bot simulator for ranging/choppy markets. Prices are divided into grids, or trade zones, that will trigger signals each time a new zone is entered. During ranging markets, each transaction is followed by a “take profit.” As the market starts to trend, transactions are stacked (compare to DCA), until the market consolidates. No signals are triggered above the Upper Limit or Below the Lower Limit.
Settings overview:
Upper Limit/Lower Limit : Highest and Lowest values for entire grid.
Number of Grids : Number of trade zones.
Show Grids : Show or hide all gridlines.
Show Only Current Grids : Only display the grids just above and just below the current trade zone.
High/Low for signals : If enabled, signals are triggered as soon as the price touches the next zone. If disabled, signals are triggered after bar closes. Enable this for “Once Per Bar alerts. Disable for “Once Per Bar Close” alerts.
Highlight Trade Zones
The grid bot should work well during ranging/choppy markets. Each zone will have only one trade, and then will immediately take profit in the next zone.
Ranging/Choppy Market
However, trending markets can produce multiple signals in rapid succession:
Trending Market
If the gridlines are compressing the chart space, enable the “Show Only Current Grids” in settings.
Show Only Current Grids disabled
Show Only Current Grids enabled
When changing symbols, adjust the Upper and Lower Limits to accommodate the new symbol. Otherwise, the chart will look compressed.
XBTUSD chart with ETHUSDT settings
The bot is a proof-of-concept and is considered experimental . Possible future updates will include Fibonacci grids and “smart entry/exits,” depending on the current trend. Comments and suggestions are encouraged.

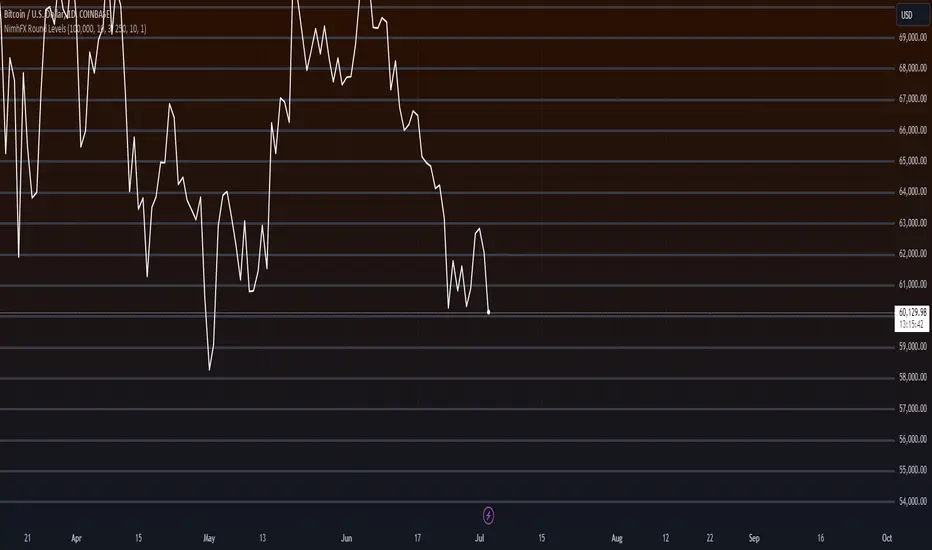
NimhFX Grid LevelsA simple levels indicator for plotting pre-defined price grid.
The default setting is as follows:
Group 1 shows 1000 Point (100 Pip divisions)
Group 2 shows 250 Point (25 Pip divisions)
Groups are duplications of each other to allow multiple divisions to be visible at once, e.g. 100 Pip grid and a 25 pip grid with differing visuals as the default setting.
Number of Lines above/below will alter the amount of lines drawn, change as required, note: Tradingview seems to try to capture all drawings when double-clicking the right price index which can cause this to compress the data.
depending on preferred timeframe you may want to alter this for example to a 10 pip grid (100 point)
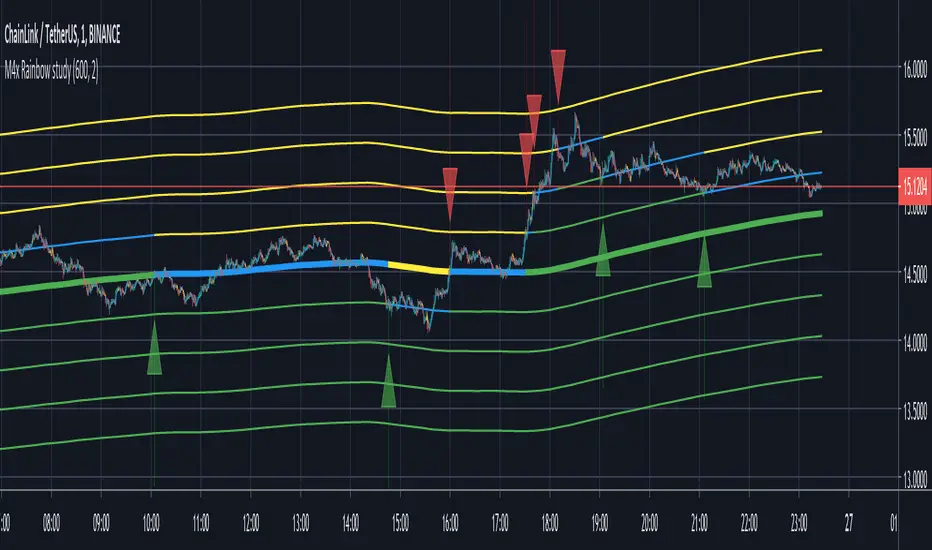
Real Grid Trend Multiplier & SMA Final Real Grid Trend Multiplier & SMA
"M4x Rainbow" is a Grid Trend Multiplier bot, who is following an adjustable SMA.
Settings:
- Profit % per Step (0-1000%)
- SMA lenght (0-4000)
Alerts: (one Alert is one step)
- longRain
- shortRAIN
The coloring of the lines is:
green = linestate is LONG
blue = linestate is WAIT
yellow = linestate is SHORT
!!! Tested only on 1 Minute Chart !!!
Give it a try and let me know.
...have fun ;-)
BoilerRoomColdCaller - 3Commas Grid Bot SignalThis is very similar to 3Commas' grid bot, the range is from the previous 7 days' lowest low decreased by 3% to the previous 7 days' highest high increased by 3%, you can also adjust if you want 7 days' highest/lowest close price as your range or highest high and lowest low as your range. 10 buys and 10 sells within the range, the unit price would be (high-low)/19.
The buy signals and the sell signals will be triggered if:
- The previous close is below one specific green line (buy line), and the current close is above that specific green line, or
- The previous close is above one specific green line (buy line), and the current close is below that specific green line
Thus, whether the price is dropping below these lines or rising above these lines, a buy or sell signal will be triggered when they cross green or red lines. Your entry price will be the next open price after this candle's close reaches the lines.
Big thanks to @glaz, who helped me a lot with this script. Please give a like button and share if you like this script. Let me know if you have questions, thanks guys.

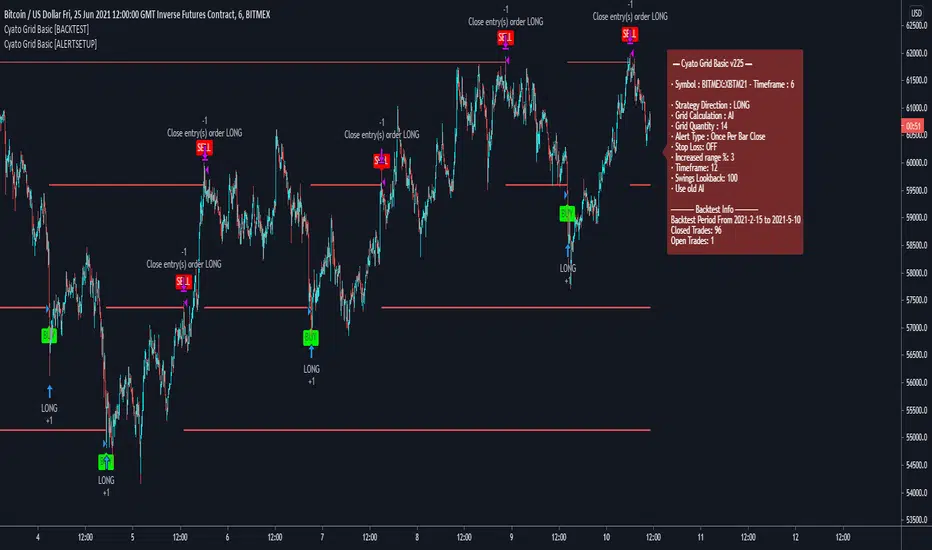
Cyato Grid Basic Buy & Sell [ALERTSETUP]Private indicator
This Grid bot strategy creates buy orders when the price goes down one level or more, and sell order when the price goes up one level or more.
To avoid useless trades, the lastest traded level is disabled until another level is crossed.
To create the grid, one upper level and one lower level is calculated. Those 2 levels are either given by the user using "MANUAL" mode or automatically calculated by an AI. The space between these two levels are then divided equally into several steps, creating the grid. The number of steps is choosen by the user, from 3 to 20.
How it Works
This is the Alert Setup version meaning this is the one you should use to create alerts (more below).
Select either "MANUAL" or "AI" mode.
When using "MANUAL", you have to configure an upper level and a lower level.
When using "AI", the upper and lower level are automatically calculated from last swing high/low.
Select the grid quantity, from 3 to 20.
Example with 3:
Example with 10:
Example with 20:
Creating the Alerts
When opening the alert popup, select "Cyato Grid" in the condition.
Make sure to use the option "Once per bar close" in order to stay in sync with the graphics on chart. (Only use "Once per bar" if you really know what you are doing).
Available alerts:
- BUY : Buy alert. Green label on chart.
- SELL: Sell alert. Red label on chart.
To get this indicator, use the link in my signature below, thanks!
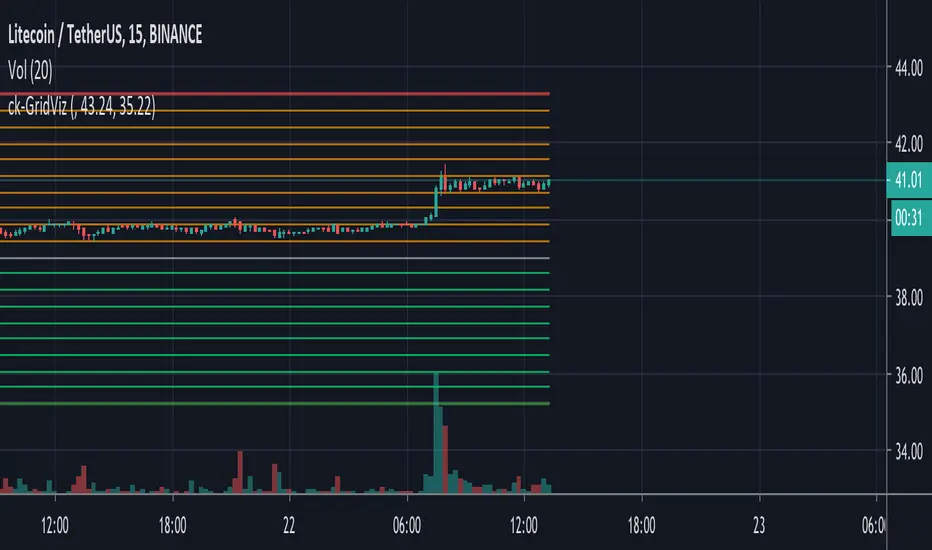
Gridbot visualizor and advisor V1.0This scripts visualizes the buy and sell levels as used by gridbots.
It also gives you some recommended settings if you want to use manual mode instead of AI mode, based on timeframe, target grid size etc.
The inputs should be pretty much self explanatory, if you have any questions feel free to drop me a message below.
Have fun, be healthy and profitable!
Jurgenvv ( aka CryptoJur)
This script uses some code or ideas from:
ck-3commas-GRID-bot-Visualisation by ChrisKaye.
How to make the status box to the right was learned from Daveatt his scripts.

ck - 3commas GRID bot VisualisationHi,
This is a very quick script indicator to show the “grid” for an active (or one you are planning to manually configure) 3commas Grid bot.
To use, you’ll need to go to your Grid bot page in 3commas and enter the Upper and Lower Limit Values, either from the “manual” section if you are planning a new Grid bot, or from an open Grid trade by clicking the monthly button and using the Upper value (in green) and the Lower value (in red).
Have fun!