Index Construction Tool🙏🏻 The most natural mathematical way to construct an index || portfolio, based on contraharmonic mean || contraharmonic weighting. If you currently traded assets do not satisfy you, why not make your own ones?
Contraharmonic mean is literally a weighted mean where each value is weighted by itself.
...
Now let me explain to you why contraharmonic weighting is really so fundamental in two ways: observation how the industry (prolly unknowably) converged to this method, and the real mathematical explanation why things are this way.
How it works in the industry.
In indexes like TVC:SPX or TVC:DJI the individual components (stocks) are weighted by market capitalization. This market cap is made of two components: number of shares outstanding and the actual price of the stock. While the number of shares holds the same over really long periods of time and changes rarely by corporate actions , the prices change all the time, so market cap is in fact almost purely based on prices itself. So when they weight index legs by market cap, it really means they weight it by stock prices. That’s the observation: even tho I never dem saying they do contraharmonic weighting, that’s what happens in reality.
Natural explanation
Now the main part: how the universe works. If you build a logical sequence of how information ‘gradually’ combines, you have this:
Suppose you have the one last datapoint of each of 4 different assets;
The next logical step is to combine these datapoints somehow in pairs. Pairs are created only as ratios , this reveals relationships between components, this is the only step where these fundamental operations are meaningful, they lose meaning with 3+ components. This way we will have 16 pairs: 4 of them would be 1s, 6 real ratios, and 6 more inverted ratios of these;
Then the next logical step is to combine all the pairs (not the initial single assets) all together. Naturally this is done via matrices, by constructing a 4x4 design matrix where each cell will be one of these 16 pairs. That matrix will have ones in the main diagonal (because these would be smth like ES/ES, NQ/NQ etc). Other cells will be actual ratios, like ES/NQ, RTY/YM etc;
Then the native way to compress and summarize all this structure is to do eigendecomposition . The only eigenvector that would be meaningful in this case is the principal eigenvector, and its loadings would be what we were hunting for. We can multiply each asset datapoint by corresponding loading, sum them up and have one single index value, what we were aiming for;
Now the main catch: turns out using these principal eigenvector loadings mathematically is Exactly the same as simply calculating contraharmonic weights of those 4 initial assets. We’re done here.
For the sceptics, no other way of constructing the design matrix other than with ratios would result in another type of a defined mean. Filling that design matrix with ratios Is the only way to obtain a meaningful defined mean, that would also work with negative numbers. I’m skipping a couple of details there tbh, but they don’t really matter (we don’t need log-space, and anyways the idea holds even then). But the core idea is this: only contraharmonic mean emerges there, no other mean ever does.
Finally, how to use the thing:
Good news we don't use contraharmonic mean itself because we need an internals of it: actual weights of components that make this contraharmonic mean, (so we can follow it with our position sizes). This actually allows us to also use these weights but not for addition, but for subtraction. So, the script has 2 modes (examples would follow):
Addition: the main one, allows you to make indexes, portfolios, baskets, groups, whatever you call it. The script will simply sum the weighted legs;
Subtraction: allows you to make spreads, residual spreads etc. Important: the script will subtract all the symbols From the first one. So if the first we have 3 symbols: YM, ES, RTY, the script will do YM - ES - RTY, weights would be applied to each.
At the top tight corner of the script you will see a lil table with symbols and corresponding weights you wanna trade: these are ‘already’ adjusted for point value of each leg, you don’t need to do anything, only scale them all together to meet your risk profile.
Symbols have to be added the way the default ones are added, one line : one symbol.
Pls explore the script’s Style setting:
You can pick a visualization method you like ! including overlays on the main chart pane !
Script also outputs inferred volume delta, inferred volume and inferred tick count calculated with the same method. You can use them in further calculations.
...
Examples of how you can use it
^^ Purple dotted line: overlay from ICT script, turned on in Style settings, the contraharmonic mean itself calculated from the same assets that are on the chart: CME_MINI:RTY1! , CME_MINI:ES1! , CME_MINI:NQ1! , CBOT_MINI:YM1!
^^ precious metals residual spread ( COMEX:GC1! COMEX:SI1! NYMEX:PL1! )
^^ CBOT:ZC1! vs CBOT:ZW1! grain spread
^^ BDI (Bid Dope Index), constructed from: NYSE:MO , NYSE:TPB , NYSE:DGX , NASDAQ:JAZZ , NYSE:IIPR , NASDAQ:CRON , OTC:CURLF , OTC:TCNNF
^^ NYMEX:CL1! & ICEEUR:BRN1! basket
^^ resulting index price, inferred volume delta, inferred volume and inferred tick count of CME_MINI:NQ1! vs CME_MINI:ES1! spread
...
Synthetic assets is the whole new Universe you can jump into and never look back, if this is your way
...
∞
Hedge

Pair Cointegration & Static Beta Analyzer (v6)Pair Cointegration & Static Beta Analyzer (v6)
This indicator evaluates whether two instruments exhibit statistical properties consistent with cointegration and tradable mean reversion.
It uses long-term beta estimation, spread standardization, AR(1) dynamics, drift stability, tail distribution analysis, and a multi-factor scoring model.
1. Static Beta and Spread Construction
A long-horizon static beta is estimated using covariance and variance of log-returns.
This beta does not update on every bar and is used throughout the entire model.
Beta = Cov(r1, r2) / Var(r2)
Spread = PriceA - Beta * PriceB
This “frozen” beta provides structural stability and avoids rolling noise in spread construction.
2. Correlation Check
Log-price correlation ensures the instruments move together over time.
Correlation ≥ 0.85 is required before deeper cointegration diagnostics are considered meaningful.
3. Z-Score Normalization and Distribution Behavior
The spread is standardized:
Z = (Spread - MA(Spread)) / Std(Spread)
The following statistical properties are examined:
Z-Mean: Should be close to zero in a stationary process
Z-Variance: Measures amplitude of deviations
Tail Probability: Frequency of |Z| being larger than a threshold (e.g. 2)
These metrics reveal whether the spread behaves like a mean-reverting equilibrium.
4. Mean Drift Stability
A rolling mean of the spread is examined.
If the rolling mean drifts excessively, the spread may not represent a stable long-term equilibrium.
A normalized drift ratio is used:
Mean Drift Ratio = Range( RollingMean(Spread) ) / Std(Spread)
Low drift indicates stable long-run equilibrium behavior.
5. AR(1) Dynamics and Half-Life
An AR(1) model approximates mean reversion:
Spread(t) = Phi * Spread(t-1) + error
Mean reversion requires:
0 < Phi < 1
Half-life of reversion:
Half-life = -ln(2) / ln(Phi)
Valid half-life for 10-minute bars typically falls between 3 and 80 bars.
6. Composite Scoring Model (0–100)
A multi-factor weighted scoring system is applied:
Component Score
Correlation 0–20
Z-Mean 0–15
Z-Variance 0–10
Tail Probability 0–10
Mean Drift 0–15
AR(1) Phi 0–15
Half-Life 0–15
Score interpretation:
70–100: Strong Cointegration Quality
40–70: Moderate
0–40: Weak
A pair is classified as cointegrated when:
Total Score ≥ Threshold (default = 70)
7. Main Cointegration Panel
Displays:
Static beta
Log-price correlation
Z-Mean, Z-Variance, Tail Probability
Drift Ratio
AR(1) Phi and Half-life
Composite score
Overall cointegration assessment
8. Beta Hedge Position Sizing (Average-Price Based)
To provide a more stable hedge ratio, hedge sizing is computed using average prices, not instantaneous prices:
AvgPriceA = SMA(PriceA, N)
AvgPriceB = SMA(PriceB, N)
Required B per 1 A = Beta * (AvgPriceA / AvgPriceB)
Using averaged prices results in a smoother, more reliable hedge ratio, reducing noise from bar-to-bar volatility.
The panel displays:
Required B security for 1 A security (average)
This represents the beta-neutral quantity of B required to hedge one unit of A.
Overview of Classical Stationarity & Cointegration Methods
The principal econometric tools commonly used in assessing stationarity and cointegration include:
Augmented Dickey–Fuller (ADF) Test
Phillips–Perron (PP) Test
KPSS Test
Engle–Granger Cointegration Test
Phillips–Ouliaris Cointegration Test
Johansen Cointegration Test
Since these procedures rely on regression residuals, matrix operations, and distribution-based critical values that are not supported in TradingView Pine Script, a practical multi-criteria scoring approach is employed instead. This framework leverages metrics that are fully computable in Pine and offers an operational proxy for evaluating cointegration-like behavior under platform constraints.
References
Engle & Granger (1987), Co-integration and Error Correction
Poterba & Summers (1988), Mean Reversion in Stock Prices
Vidyamurthy (2004), Pairs Trading
Explanation structured with assistance from OpenAI’s ChatGPT
Regards.

Static Beta for Pair and Quant Trading A beta coefficient shows the volatility of an individual stock compared to the systematic risk of the entire market. Beta represents the slope of the line through a regression of data points. In finance, each point represents an individual stock's returns against the market.
Beta effectively describes the activity of a security's returns as it responds to swings in the market. It is used in the capital asset pricing model (CAPM), which describes the relationship between systematic risk and expected return for assets. CAPM is used to price risky securities and to estimate the expected returns of assets, considering the risk of those assets and the cost of capital.
Calculating Beta
A security's beta is calculated by dividing the product of the covariance of the security's returns and the market's returns by the variance of the market's returns over a specified period. The calculation helps investors understand whether a stock moves in the same direction as the rest of the market. It also provides insights into how volatile—or how risky—a stock is relative to the rest of the market.
For beta to provide useful insight, the market used as a benchmark should be related to the stock. For example, a bond ETF's beta with the S&P 500 as the benchmark would not be helpful to an investor because bonds and stocks are too dissimilar.
Beta Values
Beta equal to 1: A stock with a beta of 1.0 means its price activity correlates with the market. Adding a stock to a portfolio with a beta of 1.0 doesn’t add any risk to the portfolio, but it doesn’t increase the likelihood that the portfolio will provide an excess return.
Beta less than 1: A beta value less than 1.0 means the security is less volatile than the market. Including this stock in a portfolio makes it less risky than the same portfolio without the stock. Utility stocks often have low betas because they move more slowly than market averages.
Beta greater than 1: A beta greater than 1.0 indicates that the security's price is theoretically more volatile than the market. If a stock's beta is 1.2, it is assumed to be 20% more volatile than the market. Technology stocks tend to have higher betas than the market benchmark. Adding the stock to a portfolio will increase the portfolio’s risk, but may also increase its return.
Negative beta: A beta of -1.0 means that the stock is inversely correlated to the market benchmark on a 1:1 basis. Put options and inverse ETFs are designed to have negative betas. There are also a few industry groups, like gold miners, where a negative beta is common.
LET'S START
Now I'll give my own definition.
Beta:
If we assume market caps are equal ,
it is an indicator that shows how much of the second instrument we should buy if we buy one of the first, taking into account the price volatility of two instruments.
But if the market caps are not equal:
For example, the ETF for A is $300.
The ETF for B is $600.
If static beta predicted by this script is 0.5:
300 * 1 * a = 600 * 0.5 * b
Then we should use 1 b for 1 a.
(Long a and short b or vice versa )
So, we can try pair trading for a/b or a-b.
However, these values are generally close to each other, such as 0.8 and 0.93. However, the closer we can adjust our lot purchases to bring the double beta to a value closer to 1, the higher the hedge ratio will be.
Large commercials use dynamic betas, which are updated periodically, in addition to static betas
However, scaling this is very difficult for individual investors with limited investment tools.
But a static beta of 5,000 bars is still much better than not considering any beta at all.
Note: The presence of a beta value for two instruments does not necessarily mean they can be included in pair trading.
It is also important (%99) to consider historically very high correlations and cointegration relationships, as well as the compatibility of security structures.
Note 2 : This script is designed for low timeframes.
Do not use betas from different timeframes.
Beta dynamics are different for each timeframe.
Note 3 : I created this script with the help of ChatGPT.
Source for beta definition ( ) :
www.investopedia.com
Regards.

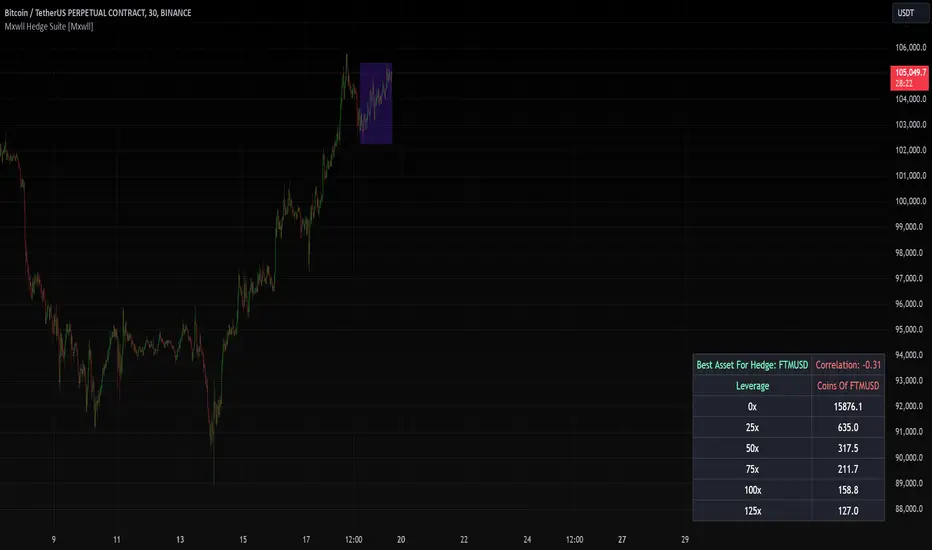
Mxwll Hedge Suite [Mxwll]Hello Traders!
The Mxwll Hedge Suite determines the best asset to hedge against the asset on your chart!
By determining correlation between the asset on your chart and a group of internally listed assets, the Mxwll Hedge Suite determines which asset from the list exhibits the highest negative correlation, and then determines exactly how many coins/shares/contracts of the asset must be bought to achieve a perfect 1:1 hedge!
The image above exemplifies the process!
The purple box on the chart shows the eligible price action used to determine correlation between the asset on my chart (BTCUSDT.P) and the list of cryptocurrencies that can be used as a hedge!
From this price action, the coin determined to have to greatest negative correlation to BTCUSDT.P is FTMUSD.
The image above further outlines the hedge table located in the bottom-right corner of your chart!
The hedge table shows exactly how many coins you’d need to purchase for the hedge asset at various leverages to achieve a perfect 1:1 hedge!
Hedge Suite works on any asset on any timeframe!
And that’s all! A short and sweet script that is hopefully helpful to traders looking to hedge their positions with a negatively correlated asset!
Thank you, Traders!
Plot the close-spread relationship between two price seriesThis indicator plots the close-spread relationship between two price series by calculating the change across two price series as a spread for each. Each spread is the rate of change in yesterday's closing price and the prior day's closing price. By default, weekend prices are defined to be 0.0 but can be included as user-definable input, if required.
User input:
Symbol for price series 1 - defaults to BITFINEX:BTCUSD
Symbol for price series 2 - defaults to NASDAQ:NDX
Market session time (string) - defaults to 00:00 to 23:59
Timezone - defaults to UTC-4

Market Hedge RatioRatio of crypto (total, Bitcoin, or Ethereum market cap) to major stable coins.
A low ratio suggests a lot of people are sitting in cash (sidelined if crypto rallies).
A high ratio suggests possible demand saturation.


Yield CurveThis script tracks the U.S. 2Yr/10Yr Spread and uses inversions of the curve to predict recessions. Whenever a red arrow appear on the yield curve, expect a recession to begin within the next 2 years. Use this signal to either exit the market, or hedge current positions. Whenever a green arrow appears on the yield curve, expect a recession to have nearly ended. Use this signal to enter the market, or cut current hedges against a recession. (I may update this script in the future to better incorporate the effective federal funds rate into exit points, but for now I am satisfied with the results).

Cross Pair [NeoButane]Creates candlesticks of a cross pair of any symbol you want. Ideally both pairs would be denominated in the same currency.
The candlesticks are plotted, a close value is available to use for applying indicators on, and a label shows what is being used.
Options to configure are choosing the symbols, displaying the ticker without the exchange name, and removing wicks. If the exchange prefix is 'BATS', 'FRED', or 'TVC', it is automatically removed.

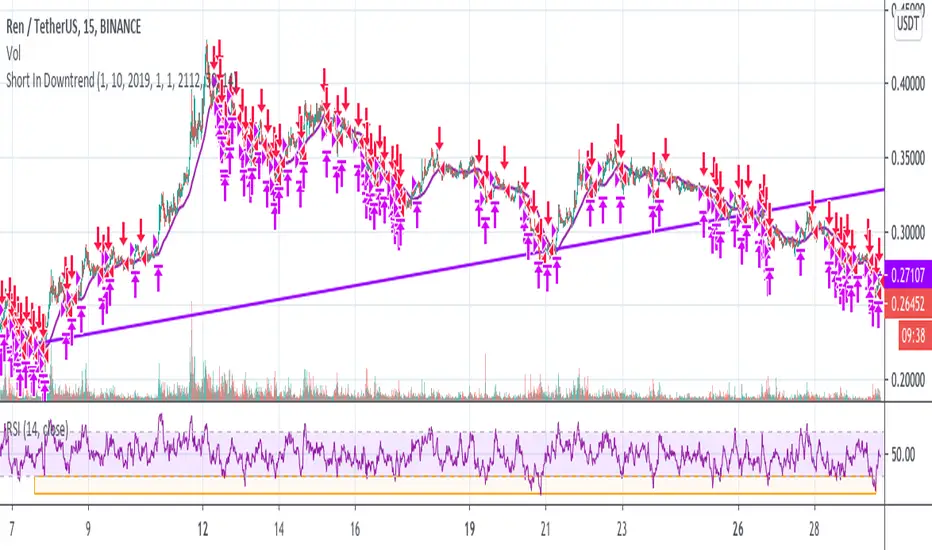
Short In Downtrend Below MA100 (Coinrule)This is a simple strategy to take advantage of downtrends. It's useful to run such a strategy as a hedge in times of market uncertainty.
The Sell Condition - Entry
The sell signal triggers when:
the coin has MA (100) greater than the price in a timeframe of 15 minutes, meaning that the coin is in a short-term downtrend.
the coin has an RSI greater than 30 in a timeframe of 15 minutes, indicating that it didn't reach oversold conditions yet, so there is still room for a further price drop.
On Coinrule, you can launch the strategy on real market conditions, setting up multiple sequential sell orders. The strategy would keep selling while the price stays below the MA(100). In that case, it's advisable to set low amounts for the sell orders. the position will grow gradually while the downtrend intensifies. Set a minimum time interval between the sell orders will also help to have control over the overall position size.
The Buy Condition - Exit
The bot connects to each trade a stop loss and a take profit. The percentages are optimized for short term trades on mid-cap coins. You can adjust the percentages depending on the specific coin you are trading. A ratio of 1:1.5 between the stop loss and the take profit could work as the strategy trades in the same direction of the trend.
Stop loss at 3% from the entry price
Take profit at 2% from the entry price
A slightly larger stop loss allows tolerating more volatility to reduce the case of stops triggering when it shouldn't.
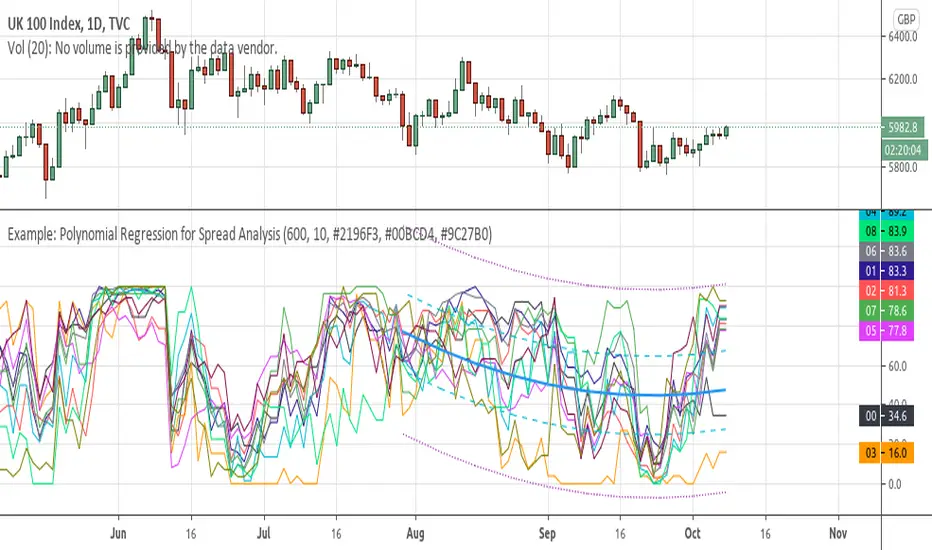
Example: Polynomial Regression for Spread AnalysisExample of applying polynomial regression channel to spreads or hedges between 2 assets.
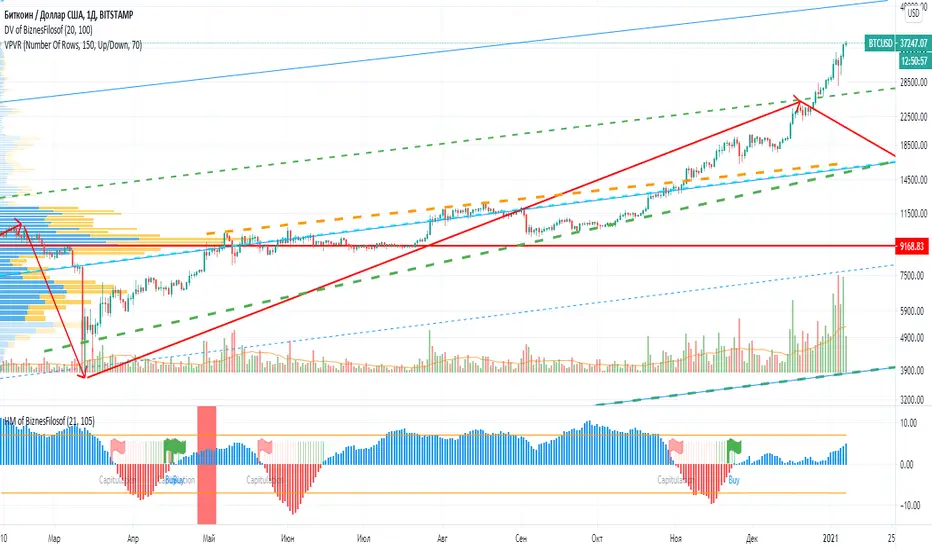
Hashrate Mining of BiznesFilosofIn addition to technical analysis, you also need to pay attention to fundamental analysis. Bitcoin has one of these indicators, it is the network hashrate. And it’s important to know when mining becomes disadvantageous. Those. when network participants turn off the equipment. And there are critical points that depend on the price and number of miners in the network.
When the blue bars of the indicator grow, then you can stand in long. When stools are reduced, then it is time to close positions or hedge risks in the derivatives market.
The vertical line indicates halving.
A red flag indicates a dangerous moment, and a green flag indicates the time of purchase.
The oscillator is based on fundamental indicators and the intersection of moving averages.
===
Кроме теханализа нужно ещё обращать внимание на фундаментальный анализ. У биткоина один из таких показателей, это хэшрейт сети. И важно зать, когда майнинг становится невыгоден. Т.е. когда участники сети отключают оборудование. И есть критические точки, зависящие от цены и количества майнеров в сети.
Когда синие столбики индикатора растут, тогда можно стоять в лонг. Когда столюики уменьшаются, тогда пора закрывать позиции или хеджировать риски на рынке деривативов.
Вертикальной линией обозначен халвинг.
Красный флаг показывает опасный момент, а зелёный флаг указывает на время покупок.
Осцилятор основан на фундаментальных показателях и пересечении скользящих средних.
Commercial Short IndexThis script takes the hedger (commercial short) from the COT report and normalize the chart for configurable time frames (e.g. 26 weeks, 152 weeks and 260 weeks).
Based on the "Commercial Index-Buschi" script by MagicEins.

U.S. Stocks & Options CVI to Bitcoin Correlation [NeoButane]Conceptual indicator based on trying to find an inverse correlation between bitcoin and traditional markets due to bitcoin's usefulness as a hedge against economic downturns.
How to use this script: you look at it and see if there is a correlation or not between bitcoin/Ethereum price and either U.S. stock CVi, buy volume, sell volume, calls, puts, or the call/put ratio.
