On Balance Volume Heikin-Ashi Transformed
The OBV Heikin Ashi indicator is a modified version of the On-Balance Volume indicator that incorporates the Heikin Ashi transformation. This technical tool aims to provide traders with a smoother representation of volume dynamics and price trends.
The OBV Heikin Ashi indicator combines the principles of OBV and Heikin Ashi to offer insights into the volume and price behavior of an asset. Understanding OBV and Heikin Ashi individually will provide a foundation for comprehending the uniqueness and utility of this indicator.
On-Balance Volume:
OBV is a volume-based indicator that measures the cumulative buying and selling pressure in the market. It considers the relationship between volume and price movements to determine the overall strength and direction of a trend. Rising OBV values suggest bullish buying pressure, while falling values indicate bearish selling pressure.
Heikin Ashi:
Heikin Ashi is a Japanese candlestick charting technique that aims to filter out noise and provide a smoother representation of price trends. It calculates each candlestick based on the average of the previous candle's open, close, high, and low prices. Heikin Ashi candles can reveal the underlying trend more clearly by reducing market noise.
Methodology:
The 𝘖𝘉𝘝 𝘏-𝘈 indicator applies the Heikin Ashi transformation to the OBV values. Each OBV value is replaced with a Heikin Ashi equivalent, which is calculated based on the average of the previous Heikin Ashi candle's open and close prices. This transformation smooths out the OBV values and helps identify the overall trend with reduced noise. Additionaly, 2 optional EMAs are included for convergence-divergence analysis.
By applying the Heikin Ashi transformation to OBV, the indicator aims to enhance the readability of volume and trend information, providing traders with a clearer understanding of market dynamics.
Utility:
The 𝘖𝘉𝘝 𝘏-𝘈 indicator can be a valuable tool for traders and investors in analyzing volume and price trends. It offers a smoother representation of OBV values, allowing for easier identification of trend reversals, bullish or bearish market conditions, and potential trading opportunities. Traders can utilize the indicator to confirm price trends, validate support and resistance levels, and enhance their overall trading strategies.
It is worth noting that the effectiveness of the indicator may vary depending on the specific market and trading strategy. It is recommended to combine its analysis with other technical indicators and perform thorough backtesting before making trading decisions.
Key Features:
2 Adjustable EMAs
Normalized Oscillator Mode
Example Charts:
See Also:
Z-Score Heikin-Ashi Transformed
Heikin-ashi

Z-Score Heikin-Ashi TransformedThe Z-Score Heikin-Ashi Transformed (𝘡 𝘏-𝘈) indicator is a powerful technical tool that combines the principles of Z-Score and Heikin Ashi to provide traders with a smoothed representation of price movements and a standardized measure of market volatility.
The 𝘡 𝘏-𝘈 indicator applies the Z-Score calculation to price data and then transforms the resulting Z-Scores using the Heikin Ashi technique. Understanding the individual components of Z-Score and Heikin Ashi will provide a foundation for comprehending the methodology and unique features of this indicator.
Z-Score:
Z-Score is a statistical measure that quantifies the distance between a data point and the mean, relative to the standard deviation. It provides a standardized value that allows traders to compare different data points on a common scale. In the context of the 𝘡 𝘏-𝘈 indicator, Z-Score is calculated based on price data, enabling the identification of extreme price movements and the assessment of their significance.
Heikin Ashi:
Heikin Ashi is a popular charting technique that aims to filter out market noise and provide a smoother representation of price trends. It involves calculating each candlestick based on the average of the previous candle's open, close, high, and low prices. This approach results in a chart that reduces the impact of short-term price fluctuations and reveals the underlying trend more clearly.
Methodology:
The 𝘡 𝘏-𝘈 indicator starts by calculating the Z-Score of the price data, which provides a standardized measure of how far each price point deviates from the mean. Next, the resulting Z-Scores are transformed using the Heikin Ashi technique. Each Z-Score value is modified according to the Heikin Ashi formula, which incorporates the average of the previous Heikin Ashi candle's open and close prices. This transformation smooths out the Z-Score values and reduces the impact of short-term price fluctuations, providing a clearer view of market trends.
This tool enables traders to identify significant price movements and assess their relative strength compared to historical data. Positive transformed Z-Scores indicate that prices are above the average, suggesting potential overbought conditions, while negative transformed Z-Scores indicate prices below the average, suggesting potential oversold conditions. Traders can utilize this information to identify potential reversals, confirm trend strength, and generate trading signals.
Utility:
The indicator offers valuable insights into price volatility and trend analysis. By combining the standardized measure of Z-Score with the smoothing effect of Heikin Ashi, traders can make more informed trading decisions and improve their understanding of market dynamics. 𝘡 𝘏-𝘈 can be used in various trading strategies, including identifying overbought or oversold conditions, confirming trend reversals, and establishing entry and exit points.
Note that the 𝘡 𝘏-𝘈 should be used in conjunction with other technical indicators and analysis tools to validate signals and avoid false positives. Additionally, traders are encouraged to conduct thorough backtesting and experimentation with different parameter settings to optimize the effectiveness of the indicator for their specific trading approach.
Key Features:
Optional Reversion Doritos
Adjustable Reversion Threshold
2 Adjustable EMAs
Example Charts:
See Also:
On Balance Volume Heikin-Ashi Transformed
RSI Primed [ChartPrime]
RSI Primed combines candlesticks, patterns, and the classic RSI indicator for advanced market trend indications
Introduction
Technical traders are always looking for innovative methods to pinpoint potential entry and exit points in the market. The RSI Prime indicator provides such traders with an enhanced view of market conditions by combining various charting styles and the Relative Strength Index (RSI). It offers users a unique perspective on the market trends and price momentum, enabling them to make better-informed decisions and stay ahead of the market curve.
The RSI Primed is a versatile indicator that combines different charting styles with the Relative Strength Index (RSI) to help traders analyze market trends and price momentum. It offers multiple visualization modes that serve specific purposes and provide unique insights into market performance:
Regular Candlesticks
Candlesticks with Patterns
Heikin Ashi Candles
Line Style
Regular Candlestick Mode
The Regular Candlestick Mode in RSI Primed depicts traditional Japanese candlesticks that most traders are familiar with. This mode bypasses any smoothing or modified calculations, representing real-price movements. Regular candlesticks offer a clear and straightforward way to visualize market trends and price action.
Candlestick with Patterns Mode
The Candlestick with Patterns Mode focuses on identifying high-probability candlestick patterns while incorporating RSI values. By leveraging the information captured by the RSI, this mode allows traders to spot significant market reversals or continuation patterns that could signal potential trading opportunities. Some recognizable patterns include engulfing bullish, engulfing bearish, morning star bullish, and evening star bearish patterns.
Heikin Ashi Candles Mode
The Heikin Ashi Candles Mode presents an advanced candlestick charting technique known for its excellent trend-following capabilities. Heikin Ashi Candles filter out noise in the market and provide a clear representation of market trends. In this mode, candlesticks are plotted based on RSI values of the open, high, low, and close prices, helping traders understand and utilize market trends effectively.
Line Style Mode
The Line Style Mode offers a simpler and minimalistic representation of the RSI values by using a line instead of candlesticks to visualize market trends. This mode helps traders focus on the overall trend direction and eliminates potential distractions caused by the complexity of candlestick patterns.
Candle Color Overlay Mode
The Candle Color Overlay Mode is a unique feature in the RSI Primed indicator that allows traders to visualize the RSI values on the chart's candles as a heat gradient. This mode adds a color overlay to the candlesticks, representing the RSI values in relation to the candlesticks' price action.
By displaying the RSI as a color gradient, traders can quickly assess market momentum and identify overbought or oversold conditions without having to switch between different modes or charts. The gradient ranges from cool colors (blue and green) for lower RSI values, indicating oversold conditions, to warm colors (orange and red) for higher RSI values, signifying overbought situations.
To enable the Candle Color Overlay Mode, traders can toggle the "Color Candles" option in the indicator settings. Once enabled, the color gradient will be applied to the candlesticks on the chart, providing a visually striking and informative representation of the RSI values in relation to price action. This mode can be used in tandem with any of the other charting styles, allowing traders to gain even more insights into market trends and momentum.
RSI Primed Implementation
The RSI Primed indicator combines the benefits of various charting styles with the RSI to help traders gain a comprehensive view of market trends and price momentum. It incorporates the Heikin Ashi and RSI values as inputs to generate several visualization modes, enabling traders to select the one that best suits their needs.
Chebyshev Digital Audio Filter in RSI Primed Indicator
A unique feature of the RSI Primed Indicator is the incorporation of the Chebyshev Digital Audio Filter, a powerful tool that significantly influences the indicator's accuracy and responsiveness. This signal processing method brings several benefits to the context of the RSI indicator, improving its performance and capabilities.
1. Improved Signal Filtering
The Chebyshev filter excels in its ability to remove high-frequency noise and unwanted signals from the RSI data. While other filtering techniques might introduce unwanted side effects or distort the RSI data, the Chebyshev filter accurately retains the main signal components, enhancing the RSI Primed's overall accuracy and reliability.
2. Faster Response Time
The Chebyshev filter offers a faster response time than most other filtering techniques. In the context of the RSI Primed Indicator, this means that the filtering process is quicker and more efficient, allowing traders to act swiftly during rapidly changing market conditions.
3. Enhanced Trend Detection
By effectively removing noise from the RSI data, the Chebyshev filter contributes to the enhanced detection of underlying market trends. This feature helps traders identify potential entry and exit points more accurately, improving their overall trading strategy and performance.
How to Use RSI Primed
Traders can choose from different visualization modes to suit their preferences while using the RSI Primed indicator. By closely monitoring the chosen visualization mode and the position of the moving average, traders can make informed decisions about market trends.
Green candlesticks or an upward line slope indicate a bullish trend, and red candlesticks or a downward line slope suggest a bearish trend. If the candles or line are above the moving average, it could signify an uptrend, whereas a position below the moving average may indicate a downtrend.
The RSI Primed indicator offers a unique and comprehensive perspective on market trends and price momentum by combining various charting styles with the RSI. Traders can choose from different visualization modes and make well-informed decisions to capitalize on market opportunities. This innovative indicator provides a clear and concise view of the market, enabling traders to make swift decisions and enhance their trading results.

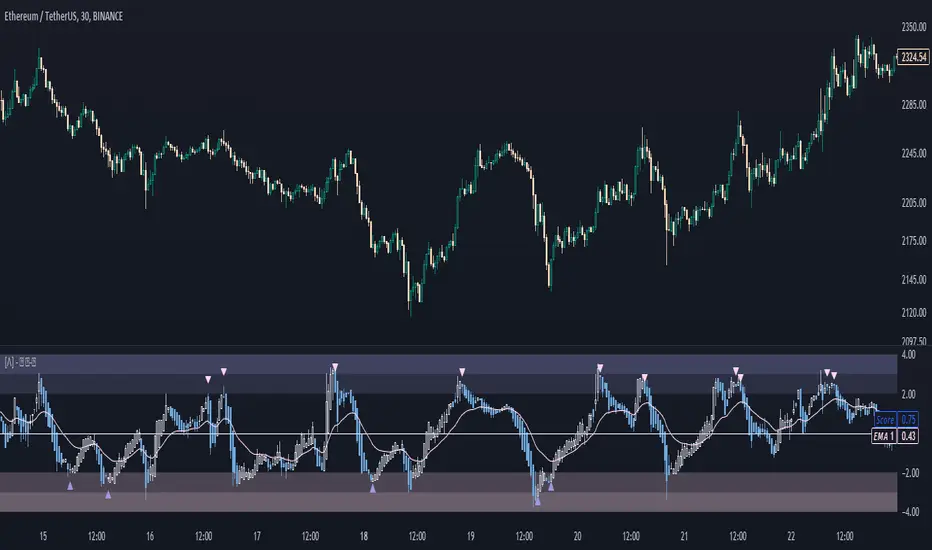
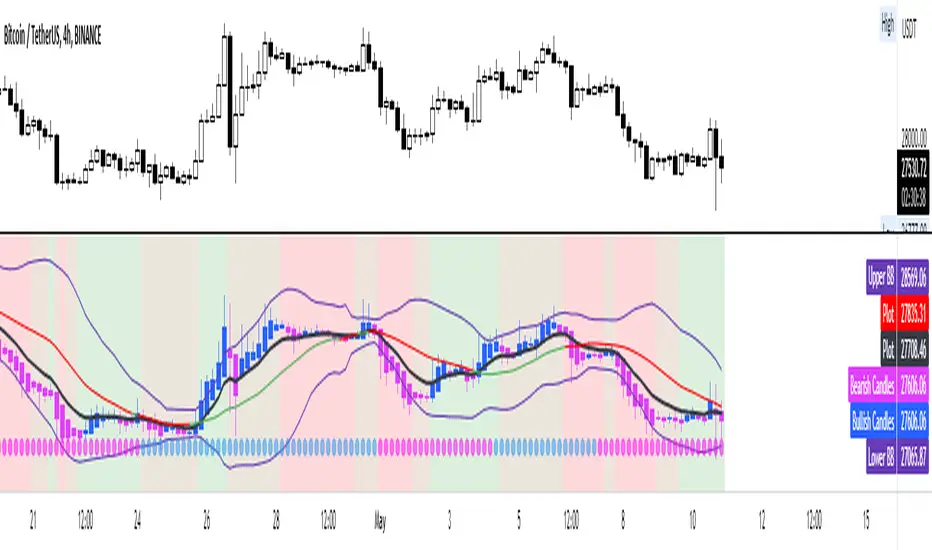
Heikin Ashi with EMA, BB, MomentumConvenient indicator to confirm a trend using heikin ashi candles.
The EMA 9 periods can be used as a trend confirmation using both the location of price and the slope of the EMA
Bollinger bands and their ma20 allows to account for volatility, range, squeeze, excess etc
This is all combined with a fast and slow momentum indicator based on the MACD.
The dots illustrate a slow/long-term momentum while the background color is the fast momentum.
Very useful indicator in my opinion to visualize the trend and momentum at the same time
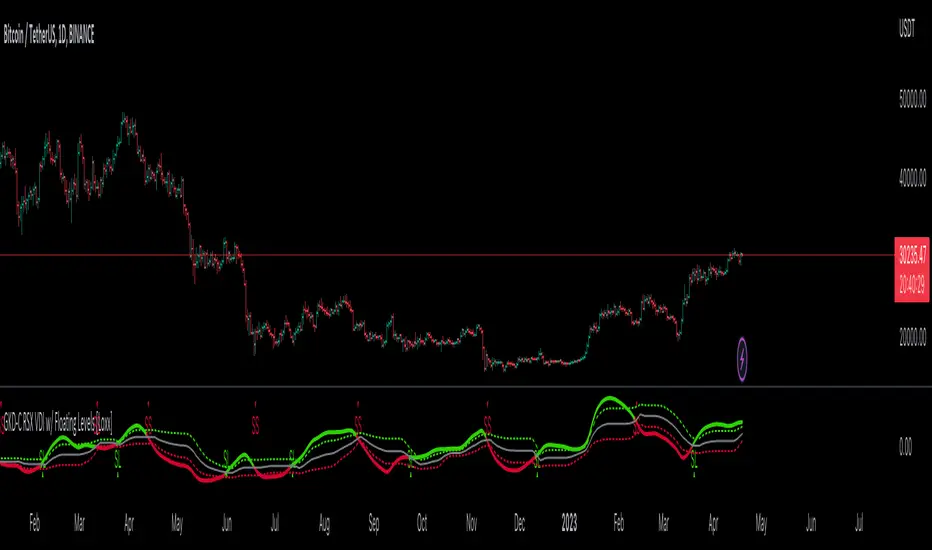
GKD-C RSX VDI w/ Floating Levels [Loxx]Giga Kaleidoscope GKD-C RSX VDI w/ Floating Levels is a Confirmation module included in Loxx's "Giga Kaleidoscope Modularized Trading System".
█ GKD-C RSX VDI w/ Floating Levels
What is the VDI (Volatility Direction Index)?
The Volatility Direction Index Index (VDI) is a technical analysis indicator developed by Loxx. It is designed to help traders and investors identify potential trend reversals, confirm existing trends, and recognize overbought or oversold market conditions. VDI is a momentum oscillator that measures the volatility and price direction of an asset over a specified period.
Here's a step-by-step breakdown of how to calculate VDI:
Choose a period (n) over which to calculate the VDI, typically 8 or 10.
Calculate the true range for each day:
True Range = max
Calculate the directional bias for each day:
If (Today's High - Previous Close) > (Previous Close - Today's Low), the directional bias is positive.
If (Today's High - Previous Close) < (Previous Close - Today's Low), the directional bias is negative.
Calculate the VDI for each day with a positive directional bias:
VDI Positive = * 100
Calculate the VDI for each day with a negative directional bias:
VDI Negative = * 100
Calculate the n-day sum of positive VDI values (Sum_Positive_VDI) and the n-day sum of negative VDI values (Sum_Negative_VDI).
Calculate the final Volatility Direction Index Index value:
VDI = (Sum_Positive_VDI - Sum_Negative_VDI) / (Sum_Positive_VDI + Sum_Negative_VDI) * 100
This VDI value can then be plotted on a chart over time to help traders and investors visualize the momentum and volatility of the asset's price.
VDI oscillates between -100 and +100. Positive VDI values indicate bullishness, while negative VDI values suggest bearishness. Values near the extremes (+100 or -100) can be considered overbought or oversold, potentially signaling a trend reversal. Traders often use additional technical analysis tools and techniques to confirm signals generated by the VDI.
What is the RSX?
The Jurik RSX is a technical indicator developed by Mark Jurik to measure the momentum and strength of price movements in financial markets, such as stocks, commodities, and currencies. It is an advanced version of the traditional Relative Strength Index (RSI), designed to offer smoother and less lagging signals compared to the standard RSI.
The main advantage of the Jurik RSX is that it provides more accurate and timely signals for traders and analysts, thanks to its improved calculation methods that reduce noise and lag in the indicator's output. This enables better decision-making when analyzing market trends and potential trading opportunities.
What is RSX VDI w/ Confidence Bands
This indicator calculates the RSX VDI and then wraps that calculation with uppper and lower floating levels, similar to Donchian channels. There are three types of signals: Levels cross, dynamic middle cross, and signal cross.
Additional Features
This indicator allows you to select from 33 source types. They are as follows:
Close
Open
High
Low
Median
Typical
Weighted
Average
Average Median Body
Trend Biased
Trend Biased (Extreme)
HA Close
HA Open
HA High
HA Low
HA Median
HA Typical
HA Weighted
HA Average
HA Average Median Body
HA Trend Biased
HA Trend Biased (Extreme)
HAB Close
HAB Open
HAB High
HAB Low
HAB Median
HAB Typical
HAB Weighted
HAB Average
HAB Average Median Body
HAB Trend Biased
HAB Trend Biased (Extreme)
What are Heiken Ashi "better" candles?
Heiken Ashi "better" candles are a modified version of the standard Heiken Ashi candles, which are a popular charting technique used in technical analysis. Heiken Ashi candles help traders identify trends and potential reversal points by smoothing out price data and reducing market noise. The "better formula" was proposed by Sebastian Schmidt in an article published by BNP Paribas in Warrants & Zertifikate, a German magazine, in August 2004. The aim of this formula is to further improve the smoothing of the Heiken Ashi chart and enhance its effectiveness in identifying trends and reversals.
Standard Heiken Ashi candles are calculated using the following formulas:
Heiken Ashi Close = (Open + High + Low + Close) / 4
Heiken Ashi Open = (Previous Heiken Ashi Open + Previous Heiken Ashi Close) / 2
Heiken Ashi High = Max (High, Heiken Ashi Open, Heiken Ashi Close)
Heiken Ashi Low = Min (Low, Heiken Ashi Open, Heiken Ashi Close)
The "better formula" modifies the standard Heiken Ashi calculation by incorporating additional smoothing, which can help reduce noise and make it easier to identify trends and reversals. The modified formulas for Heiken Ashi "better" candles are as follows:
Better Heiken Ashi Close = (Open + High + Low + Close) / 4
Better Heiken Ashi Open = (Previous Better Heiken Ashi Open + Previous Better Heiken Ashi Close) / 2
Better Heiken Ashi High = Max (High, Better Heiken Ashi Open, Better Heiken Ashi Close)
Better Heiken Ashi Low = Min (Low, Better Heiken Ashi Open, Better Heiken Ashi Close)
Smoothing Factor = 2 / (N + 1), where N is the chosen period for smoothing
Smoothed Better Heiken Ashi Open = (Better Heiken Ashi Open * Smoothing Factor) + (Previous Smoothed Better Heiken Ashi Open * (1 - Smoothing Factor))
Smoothed Better Heiken Ashi Close = (Better Heiken Ashi Close * Smoothing Factor) + (Previous Smoothed Better Heiken Ashi Close * (1 - Smoothing Factor))
The smoothed Better Heiken Ashi Open and Close values are then used to calculate the smoothed Better Heiken Ashi High and Low values, resulting in "better" candles that provide a clearer representation of the market trend and potential reversal points.
It's important to note that, like any other technical analysis tool, Heiken Ashi "better" candles are not foolproof and should be used in conjunction with other indicators and analysis techniques to make well-informed trading decisions.
Heiken Ashi "better" candles, as mentioned previously, provide a clearer representation of market trends and potential reversal points by reducing noise and smoothing out price data. When using these candles in conjunction with other technical analysis tools and indicators, traders can gain valuable insights into market behavior and make more informed decisions.
To effectively use Heiken Ashi "better" candles in your trading strategy, consider the following tips:
Trend Identification: Heiken Ashi "better" candles can help you identify the prevailing trend in the market. When the majority of the candles are green (or another color, depending on your chart settings) and there are no or few lower wicks, it may indicate a strong uptrend. Conversely, when the majority of the candles are red (or another color) and there are no or few upper wicks, it may signal a strong downtrend.
Trend Reversals: Look for potential trend reversals when a change in the color of the candles occurs, especially when accompanied by longer wicks. For example, if a green candle with a long lower wick is followed by a red candle, it could indicate a bearish reversal. Similarly, a red candle with a long upper wick followed by a green candle may suggest a bullish reversal.
Support and Resistance: You can use Heiken Ashi "better" candles to identify potential support and resistance levels. When the candles are consistently moving in one direction and then suddenly change color with longer wicks, it could indicate the presence of a support or resistance level.
Stop-Loss and Take-Profit: Using Heiken Ashi "better" candles can help you manage risk by determining optimal stop-loss and take-profit levels. For instance, you can place your stop-loss below the low of the most recent green candle in an uptrend or above the high of the most recent red candle in a downtrend.
Confirming Signals: Heiken Ashi "better" candles should be used in conjunction with other technical indicators, such as moving averages, oscillators, or chart patterns, to confirm signals and improve the accuracy of your analysis.
In this implementation, you have the choice of AMA, KAMA, or T3 smoothing. These are as follows:
Kaufman Adaptive Moving Average (KAMA)
The Kaufman Adaptive Moving Average (KAMA) is a type of adaptive moving average used in technical analysis to smooth out price fluctuations and identify trends. The KAMA adjusts its smoothing factor based on the market's volatility, making it more responsive in volatile markets and smoother in calm markets. The KAMA is calculated using three different efficiency ratios that determine the appropriate smoothing factor for the current market conditions. These ratios are based on the noise level of the market, the speed at which the market is moving, and the length of the moving average. The KAMA is a popular choice among traders who prefer to use adaptive indicators to identify trends and potential reversals.
Adaptive Moving Average
The Adaptive Moving Average (AMA) is a type of moving average that adjusts its sensitivity to price movements based on market conditions. It uses a ratio between the current price and the highest and lowest prices over a certain lookback period to determine its level of smoothing. The AMA can help reduce lag and increase responsiveness to changes in trend direction, making it useful for traders who want to follow trends while avoiding false signals. The AMA is calculated by multiplying a smoothing constant with the difference between the current price and the previous AMA value, then adding the result to the previous AMA value.
T3
The T3 moving average is a type of technical indicator used in financial analysis to identify trends in price movements. It is similar to the Exponential Moving Average (EMA) and the Double Exponential Moving Average (DEMA), but uses a different smoothing algorithm.
The T3 moving average is calculated using a series of exponential moving averages that are designed to filter out noise and smooth the data. The resulting smoothed data is then weighted with a non-linear function to produce a final output that is more responsive to changes in trend direction.
The T3 moving average can be customized by adjusting the length of the moving average, as well as the weighting function used to smooth the data. It is commonly used in conjunction with other technical indicators as part of a larger trading strategy.
█ Giga Kaleidoscope Modularized Trading System
Core components of an NNFX algorithmic trading strategy
The NNFX algorithm is built on the principles of trend, momentum, and volatility. There are six core components in the NNFX trading algorithm:
1. Volatility - price volatility; e.g., Average True Range, True Range Double, Close-to-Close, etc.
2. Baseline - a moving average to identify price trend
3. Confirmation 1 - a technical indicator used to identify trends
4. Confirmation 2 - a technical indicator used to identify trends
5. Continuation - a technical indicator used to identify trends
6. Volatility/Volume - a technical indicator used to identify volatility/volume breakouts/breakdown
7. Exit - a technical indicator used to determine when a trend is exhausted
What is Volatility in the NNFX trading system?
In the NNFX (No Nonsense Forex) trading system, ATR (Average True Range) is typically used to measure the volatility of an asset. It is used as a part of the system to help determine the appropriate stop loss and take profit levels for a trade. ATR is calculated by taking the average of the true range values over a specified period.
True range is calculated as the maximum of the following values:
-Current high minus the current low
-Absolute value of the current high minus the previous close
-Absolute value of the current low minus the previous close
ATR is a dynamic indicator that changes with changes in volatility. As volatility increases, the value of ATR increases, and as volatility decreases, the value of ATR decreases. By using ATR in NNFX system, traders can adjust their stop loss and take profit levels according to the volatility of the asset being traded. This helps to ensure that the trade is given enough room to move, while also minimizing potential losses.
Other types of volatility include True Range Double (TRD), Close-to-Close, and Garman-Klass
What is a Baseline indicator?
The baseline is essentially a moving average, and is used to determine the overall direction of the market.
The baseline in the NNFX system is used to filter out trades that are not in line with the long-term trend of the market. The baseline is plotted on the chart along with other indicators, such as the Moving Average (MA), the Relative Strength Index (RSI), and the Average True Range (ATR).
Trades are only taken when the price is in the same direction as the baseline. For example, if the baseline is sloping upwards, only long trades are taken, and if the baseline is sloping downwards, only short trades are taken. This approach helps to ensure that trades are in line with the overall trend of the market, and reduces the risk of entering trades that are likely to fail.
By using a baseline in the NNFX system, traders can have a clear reference point for determining the overall trend of the market, and can make more informed trading decisions. The baseline helps to filter out noise and false signals, and ensures that trades are taken in the direction of the long-term trend.
What is a Confirmation indicator?
Confirmation indicators are technical indicators that are used to confirm the signals generated by primary indicators. Primary indicators are the core indicators used in the NNFX system, such as the Average True Range (ATR), the Moving Average (MA), and the Relative Strength Index (RSI).
The purpose of the confirmation indicators is to reduce false signals and improve the accuracy of the trading system. They are designed to confirm the signals generated by the primary indicators by providing additional information about the strength and direction of the trend.
Some examples of confirmation indicators that may be used in the NNFX system include the Bollinger Bands, the MACD (Moving Average Convergence Divergence), and the MACD Oscillator. These indicators can provide information about the volatility, momentum, and trend strength of the market, and can be used to confirm the signals generated by the primary indicators.
In the NNFX system, confirmation indicators are used in combination with primary indicators and other filters to create a trading system that is robust and reliable. By using multiple indicators to confirm trading signals, the system aims to reduce the risk of false signals and improve the overall profitability of the trades.
What is a Continuation indicator?
In the NNFX (No Nonsense Forex) trading system, a continuation indicator is a technical indicator that is used to confirm a current trend and predict that the trend is likely to continue in the same direction. A continuation indicator is typically used in conjunction with other indicators in the system, such as a baseline indicator, to provide a comprehensive trading strategy.
What is a Volatility/Volume indicator?
Volume indicators, such as the On Balance Volume (OBV), the Chaikin Money Flow (CMF), or the Volume Price Trend (VPT), are used to measure the amount of buying and selling activity in a market. They are based on the trading volume of the market, and can provide information about the strength of the trend. In the NNFX system, volume indicators are used to confirm trading signals generated by the Moving Average and the Relative Strength Index. Volatility indicators include Average Direction Index, Waddah Attar, and Volatility Ratio. In the NNFX trading system, volatility is a proxy for volume and vice versa.
By using volume indicators as confirmation tools, the NNFX trading system aims to reduce the risk of false signals and improve the overall profitability of trades. These indicators can provide additional information about the market that is not captured by the primary indicators, and can help traders to make more informed trading decisions. In addition, volume indicators can be used to identify potential changes in market trends and to confirm the strength of price movements.
What is an Exit indicator?
The exit indicator is used in conjunction with other indicators in the system, such as the Moving Average (MA), the Relative Strength Index (RSI), and the Average True Range (ATR), to provide a comprehensive trading strategy.
The exit indicator in the NNFX system can be any technical indicator that is deemed effective at identifying optimal exit points. Examples of exit indicators that are commonly used include the Parabolic SAR, the Average Directional Index (ADX), and the Chandelier Exit.
The purpose of the exit indicator is to identify when a trend is likely to reverse or when the market conditions have changed, signaling the need to exit a trade. By using an exit indicator, traders can manage their risk and prevent significant losses.
In the NNFX system, the exit indicator is used in conjunction with a stop loss and a take profit order to maximize profits and minimize losses. The stop loss order is used to limit the amount of loss that can be incurred if the trade goes against the trader, while the take profit order is used to lock in profits when the trade is moving in the trader's favor.
Overall, the use of an exit indicator in the NNFX trading system is an important component of a comprehensive trading strategy. It allows traders to manage their risk effectively and improve the profitability of their trades by exiting at the right time.
How does Loxx's GKD (Giga Kaleidoscope Modularized Trading System) implement the NNFX algorithm outlined above?
Loxx's GKD v1.0 system has five types of modules (indicators/strategies). These modules are:
1. GKD-BT - Backtesting module (Volatility, Number 1 in the NNFX algorithm)
2. GKD-B - Baseline module (Baseline and Volatility/Volume, Numbers 1 and 2 in the NNFX algorithm)
3. GKD-C - Confirmation 1/2 and Continuation module (Confirmation 1/2 and Continuation, Numbers 3, 4, and 5 in the NNFX algorithm)
4. GKD-V - Volatility/Volume module (Confirmation 1/2, Number 6 in the NNFX algorithm)
5. GKD-E - Exit module (Exit, Number 7 in the NNFX algorithm)
(additional module types will added in future releases)
Each module interacts with every module by passing data between modules. Data is passed between each module as described below:
GKD-B => GKD-V => GKD-C(1) => GKD-C(2) => GKD-C(Continuation) => GKD-E => GKD-BT
That is, the Baseline indicator passes its data to Volatility/Volume. The Volatility/Volume indicator passes its values to the Confirmation 1 indicator. The Confirmation 1 indicator passes its values to the Confirmation 2 indicator. The Confirmation 2 indicator passes its values to the Continuation indicator. The Continuation indicator passes its values to the Exit indicator, and finally, the Exit indicator passes its values to the Backtest strategy.
This chaining of indicators requires that each module conform to Loxx's GKD protocol, therefore allowing for the testing of every possible combination of technical indicators that make up the six components of the NNFX algorithm.
What does the application of the GKD trading system look like?
Example trading system:
Backtest: Strategy with 1-3 take profits, trailing stop loss, multiple types of PnL volatility, and 2 backtesting styles
Baseline: Hull Moving Average
Volatility/Volume: Hurst Exponent
Confirmation 1: RSX VDI w/ Floating Levels as shown on the chart above
Confirmation 2: Williams Percent Range
Continuation: Fisher Transform
Exit: Rex Oscillator
Each GKD indicator is denoted with a module identifier of either: GKD-BT, GKD-B, GKD-C, GKD-V, or GKD-E. This allows traders to understand to which module each indicator belongs and where each indicator fits into the GKD protocol chain.
Giga Kaleidoscope Modularized Trading System Signals (based on the NNFX algorithm)
Standard Entry
1. GKD-C Confirmation 1 Signal
2. GKD-B Baseline agrees
3. Price is within a range of 0.2x Volatility and 1.0x Volatility of the Goldie Locks Mean
4. GKD-C Confirmation 2 agrees
5. GKD-V Volatility/Volume agrees
Baseline Entry
1. GKD-B Baseline signal
2. GKD-C Confirmation 1 agrees
3. Price is within a range of 0.2x Volatility and 1.0x Volatility of the Goldie Locks Mean
4. GKD-C Confirmation 2 agrees
5. GKD-V Volatility/Volume agrees
6. GKD-C Confirmation 1 signal was less than 7 candles prior
Volatility/Volume Entry
1. GKD-V Volatility/Volume signal
2. GKD-C Confirmation 1 agrees
3. Price is within a range of 0.2x Volatility and 1.0x Volatility of the Goldie Locks Mean
4. GKD-C Confirmation 2 agrees
5. GKD-B Baseline agrees
6. GKD-C Confirmation 1 signal was less than 7 candles prior
Continuation Entry
1. Standard Entry, Baseline Entry, or Pullback; entry triggered previously
2. GKD-B Baseline hasn't crossed since entry signal trigger
3. GKD-C Confirmation Continuation Indicator signals
4. GKD-C Confirmation 1 agrees
5. GKD-B Baseline agrees
6. GKD-C Confirmation 2 agrees
1-Candle Rule Standard Entry
1. GKD-C Confirmation 1 signal
2. GKD-B Baseline agrees
3. Price is within a range of 0.2x Volatility and 1.0x Volatility of the Goldie Locks Mean
Next Candle:
1. Price retraced (Long: close < close or Short: close > close )
2. GKD-B Baseline agrees
3. GKD-C Confirmation 1 agrees
4. GKD-C Confirmation 2 agrees
5. GKD-V Volatility/Volume agrees
1-Candle Rule Baseline Entry
1. GKD-B Baseline signal
2. GKD-C Confirmation 1 agrees
3. Price is within a range of 0.2x Volatility and 1.0x Volatility of the Goldie Locks Mean
4. GKD-C Confirmation 1 signal was less than 7 candles prior
Next Candle:
1. Price retraced (Long: close < close or Short: close > close )
2. GKD-B Baseline agrees
3. GKD-C Confirmation 1 agrees
4. GKD-C Confirmation 2 agrees
5. GKD-V Volatility/Volume Agrees
1-Candle Rule Volatility/Volume Entry
1. GKD-V Volatility/Volume signal
2. GKD-C Confirmation 1 agrees
3. Price is within a range of 0.2x Volatility and 1.0x Volatility of the Goldie Locks Mean
4. GKD-C Confirmation 1 signal was less than 7 candles prior
Next Candle:
1. Price retraced (Long: close < close or Short: close > close)
2. GKD-B Volatility/Volume agrees
3. GKD-C Confirmation 1 agrees
4. GKD-C Confirmation 2 agrees
5. GKD-B Baseline agrees
PullBack Entry
1. GKD-B Baseline signal
2. GKD-C Confirmation 1 agrees
3. Price is beyond 1.0x Volatility of Baseline
Next Candle:
1. Price is within a range of 0.2x Volatility and 1.0x Volatility of the Goldie Locks Mean
2. GKD-C Confirmation 1 agrees
3. GKD-C Confirmation 2 agrees
4. GKD-V Volatility/Volume Agrees
]█ Setting up the GKD
The GKD system involves chaining indicators together. These are the steps to set this up.
Use a GKD-C indicator alone on a chart
1. Inside the GKD-C indicator, change the "Confirmation Type" setting to "Solo Confirmation Simple"
Use a GKD-V indicator alone on a chart
**nothing, it's already useable on the chart without any settings changes
Use a GKD-B indicator alone on a chart
**nothing, it's already useable on the chart without any settings changes
Baseline (Baseline, Backtest)
1. Import the GKD-B Baseline into the GKD-BT Backtest: "Input into Volatility/Volume or Backtest (Baseline testing)"
2. Inside the GKD-BT Backtest, change the setting "Backtest Special" to "Baseline"
Volatility/Volume (Volatility/Volume, Backte st)
1. Inside the GKD-V indicator, change the "Testing Type" setting to "Solo"
2. Inside the GKD-V indicator, change the "Signal Type" setting to "Crossing" (neither traditional nor both can be backtested)
3. Import the GKD-V indicator into the GKD-BT Backtest: "Input into C1 or Backtest"
4. Inside the GKD-BT Backtest, change the setting "Backtest Special" to "Volatility/Volume"
5. Inside the GKD-BT Backtest, a) change the setting "Backtest Type" to "Trading" if using a directional GKD-V indicator; or, b) change the setting "Backtest Type" to "Full" if using a directional or non-directional GKD-V indicator (non-directional GKD-V can only test Longs and Shorts separately)
6. If "Backtest Type" is set to "Full": Inside the GKD-BT Backtest, change the setting "Backtest Side" to "Long" or "Short
7. If "Backtest Type" is set to "Full": To allow the system to open multiple orders at one time so you test all Longs or Shorts, open the GKD-BT Backtest, click the tab "Properties" and then insert a value of something like 10 orders into the "Pyramiding" settings. This will allow 10 orders to be opened at one time which should be enough to catch all possible Longs or Shorts.
Solo Confirmation Simple (Confirmation, Backtest)
1. Inside the GKD-C indicator, change the "Confirmation Type" setting to "Solo Confirmation Simple"
1. Import the GKD-C indicator into the GKD-BT Backtest: "Input into Backtest"
2. Inside the GKD-BT Backtest, change the setting "Backtest Special" to "Solo Confirmation Simple"
Solo Confirmation Complex without Exits (Baseline, Volatility/Volume, Confirmation, Backtest)
1. Inside the GKD-V indicator, change the "Testing Type" setting to "Chained"
2. Import the GKD-B Baseline into the GKD-V indicator: "Input into Volatility/Volume or Backtest (Baseline testing)"
3. Inside the GKD-C indicator, change the "Confirmation Type" setting to "Solo Confirmation Complex"
4. Import the GKD-V indicator into the GKD-C indicator: "Input into C1 or Backtest"
5. Inside the GKD-BT Backtest, change the setting "Backtest Special" to "GKD Full wo/ Exits"
6. Import the GKD-C into the GKD-BT Backtest: "Input into Exit or Backtest"
Solo Confirmation Complex with Exits (Baseline, Volatility/Volume, Confirmation, Exit, Backtest)
1. Inside the GKD-V indicator, change the "Testing Type" setting to "Chained"
2. Import the GKD-B Baseline into the GKD-V indicator: "Input into Volatility/Volume or Backtest (Baseline testing)"
3. Inside the GKD-C indicator, change the "Confirmation Type" setting to "Solo Confirmation Complex"
4. Import the GKD-V indicator into the GKD-C indicator: "Input into C1 or Backtest"
5. Import the GKD-C indicator into the GKD-E indicator: "Input into Exit"
6. Inside the GKD-BT Backtest, change the setting "Backtest Special" to "GKD Full w/ Exits"
7. Import the GKD-E into the GKD-BT Backtest: "Input into Backtest"
Full GKD without Exits (Baseline, Volatility/Volume, Confirmation 1, Confirmation 2, Continuation, Backtest)
1. Inside the GKD-V indicator, change the "Testing Type" setting to "Chained"
2. Import the GKD-B Baseline into the GKD-V indicator: "Input into Volatility/Volume or Backtest (Baseline testing)"
3. Inside the GKD-C 1 indicator, change the "Confirmation Type" setting to "Confirmation 1"
4. Import the GKD-V indicator into the GKD-C 1 indicator: "Input into C1 or Backtest"
5. Inside the GKD-C 2 indicator, change the "Confirmation Type" setting to "Confirmation 2"
6. Import the GKD-C 1 indicator into the GKD-C 2 indicator: "Input into C2"
7. Inside the GKD-C Continuation indicator, change the "Confirmation Type" setting to "Continuation"
8. Inside the GKD-BT Backtest, change the setting "Backtest Special" to "GKD Full wo/ Exits"
9. Import the GKD-E into the GKD-BT Backtest: "Input into Exit or Backtest"
Full GKD with Exits (Baseline, Volatility/Volume, Confirmation 1, Confirmation 2, Continuation, Exit, Backtest)
1. Inside the GKD-V indicator, change the "Testing Type" setting to "Chained"
2. Import the GKD-B Baseline into the GKD-V indicator: "Input into Volatility/Volume or Backtest (Baseline testing)"
3. Inside the GKD-C 1 indicator, change the "Confirmation Type" setting to "Confirmation 1"
4. Import the GKD-V indicator into the GKD-C 1 indicator: "Input into C1 or Backtest"
5. Inside the GKD-C 2 indicator, change the "Confirmation Type" setting to "Confirmation 2"
6. Import the GKD-C 1 indicator into the GKD-C 2 indicator: "Input into C2"
7. Inside the GKD-C Continuation indicator, change the "Confirmation Type" setting to "Continuation"
8. Import the GKD-C Continuation indicator into the GKD-E indicator: "Input into Exit"
9. Inside the GKD-BT Backtest, change the setting "Backtest Special" to "GKD Full w/ Exits"
10. Import the GKD-E into the GKD-BT Backtest: "Input into Backtest"
Baseline + Volatility/Volume (Baseline, Volatility/Volume, Backtest)
1. Inside the GKD-V indicator, change the "Testing Type" setting to "Baseline + Volatility/Volume"
2. Inside the GKD-V indicator, make sure the "Signal Type" setting is set to "Traditional"
3. Import the GKD-B Baseline into the GKD-V indicator: "Input into Volatility/Volume or Backtest (Baseline testing)"
4. Inside the GKD-BT Backtest, change the setting "Backtest Special" to "Baseline + Volatility/Volume"
5. Import the GKD-V into the GKD-BT Backtest: "Input into C1 or Backtest"
6. Inside the GKD-BT Backtest, change the setting "Backtest Type" to "Full". For this backtest, you must test Longs and Shorts separately
7. To allow the system to open multiple orders at one time so you can test all Longs or Shorts, open the GKD-BT Backtest, click the tab "Properties" and then insert a value of something like 10 orders into the "Pyramiding" settings. This will allow 10 orders to be opened at one time which should be enough to catch all possible Longs or Shorts.
Requirements
Inputs
Confirmation 1: GKD-V Volatility / Volume indicator
Confirmation 2: GKD-C Confirmation indicator
Continuation: GKD-C Confirmation indicator
Solo Confirmation Simple: GKD-B Baseline
Solo Confirmation Complex: GKD-V Volatility / Volume indicator
Solo Confirmation Super Complex: GKD-V Volatility / Volume indicator
Stacked 1: None
Stacked 2+: GKD-C, GKD-V, or GKD-B Stacked 1
Outputs
Confirmation 1: GKD-C Confirmation 2 indicator
Confirmation 2: GKD-C Continuation indicator
Continuation: GKD-E Exit indicator
Solo Confirmation Simple: GKD-BT Backtest
Solo Confirmation Complex: GKD-BT Backtest or GKD-E Exit indicator
Solo Confirmation Super Complex: GKD-C Continuation indicator
Stacked 1: GKD-C, GKD-V, or GKD-B Stacked 2+
Stacked 2+: GKD-C, GKD-V, or GKD-B Stacked 2+ or GKD-BT Backtest
Additional features will be added in future releases.
MTF Candle [Pt]The Multi-Timeframe (MTF) Candle Tool is a powerful indicator designed for traders who wish to analyze standard candle bars and Heikin Ashi candles of multiple timeframes simultaneously. This tool is ideal for traders who prefer to trade in higher timeframes while keeping a close eye on the lower timeframes for confirmation signals. The indicator works by overlaying standard candle bars or Heikin Ashi candles of a higher timeframe onto the current chart. This allows traders to quickly switch between the current timeframe and the higher timeframe, without having to switch charts.
Features
- Live, real time updating MTF candle
- Custom colors
- Heikin Ashi candle
- Heikin Ashi Inside bar highlight

SumIndTarget:
The SumInd indicator combines Heiking Ashi, Sar Parabolic, Koncord, RSI, DMI, MACD and Bollinger Bands to give buy or sell signals or trends. This are called base indicators.
The goal is to have a clear and quick buy or sell suggestion and to avoid evaluating all or some of the named indicators, especially if they give contradictory signals among them. This speed and simplicity helps the trader to see several tickers in less time. It is intended for all markets and time periods where the above-mentioned indicators can be used.
How it works:
SumInd already has the importance or "weight" of each indicator named above configured, but they can be modified. You can set 0% for no use, or any other value based on the weight you want to give it, between 1% and 200% where 100% is the normal use, and increases or decreases based on importance.
Each base indicator can give signals to buy, sell or just "wait and see".
Each base indicator is checked for a buy signal, in which case its weight is added to the positive or green line, and if there is a sell signal, its weight is subtracted from the sell or red line. in case of indeterminacy or 'wait and see', nothing is added to any signal.
The yellow or total line is the sum of the buy or green signal plus the sell or red signal.
If the yellow or total line rises above the buy level, the background changes to green and an up arrow appears at the bottom of the chart indicating the buy suggestion, because most of the indicators you are interested in gave a buy signal.
If the yellow line or total falls below the sell level, the background changes to red and a downward arrow appears in the upper area of the chart indicating the sell suggestion, because most of the indicators you are interested in gave a sell signal.
The Buy and Sell level can be changed according to the security of the suggestion you need.
Areas without arrows or marks are considered "wait and see" areas, the previous trend in principle continues. They can be marked with the default background if desired from the SumInd settings.
Details and criterials:
Each of the following indicators can be turned on or off and assigned different weights of importances, by whether or not it shares the following criteria:
Heikin Ashi candles: add or subtract half an assigned weight if there is a buy or sell candle and the other half weight if there are two consecutive candles with the same signal.
RSI: Adds or subtracts the assigned weight if the ema is below or above the signal.
Parabolic Sar: Adds half a weight in transition to buy or sell and another half weight if there are two consecutive signals of the same trend.
Koncord: Add or subtract the weight if the current trend (mountain) grows or decreases respectively from the 4th previous time signal, and also the value (red line) is less than 35 or exceeds 65 respectively.
DMI: Adds or subtracts a quarter of the weight assigned by the DMI signal multiplied by the value of DMI, if the positive or negative signal exceeds the other negative or positive signal by 15% respectively.
Bollinger Bands: Add or subtract the weight if the previous third signal touches or falls out of the zone and keeps growing or decreasing respectively.
MACd: Add or subtract one third of the weight if the last 3 time signals are rising or falling, Add or subtract another third if the fast signal is above or below the slow signal, and Add or subtract the last third of the weight if it is rising with the negative fast signal, or falling with the positive fast signal.

Open Interest with Heikin Ashi candlesA simple modification of the Tradingview free script of futures Open Interest to Heikin Ashi candles. It displays the volume of the Open Interest futures contracts by applying the HA formula.
I use it to clear out the "noise" of up's and down's especially in intraday small time frames when I am scalping in crypto.
Background color can be turned on/off.
Just to give back a little something to a community that gave me A LOT!
Let me know what you think and if you need anything to add.
Have fun :)
P.S. The way I use it is to try to find traps in the market and take (fast) advantage of them. When the OI are going up really fast in small time frames (which means either longs or shorts are going up) this creates a good opportunity for a squeeze (the trap).
Of course I use other indicators/oscillators to determine that but it gets me on my toes to look for... something ;)

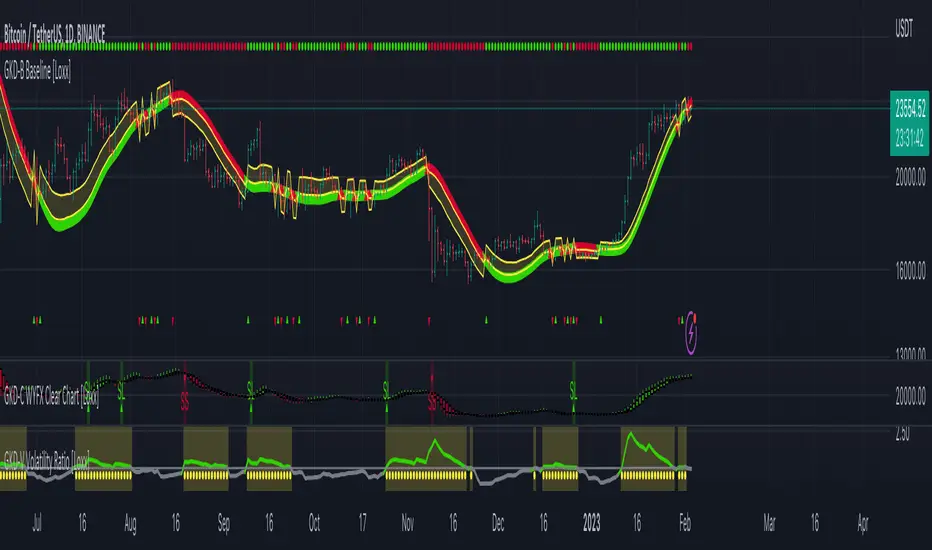
GKD-C WYFX Clear Chart [Loxx]Giga Kaleidoscope WYFX Clear Chart is a Confirmation module included in Loxx's "Giga Kaleidoscope Modularized Trading System".
█ Giga Kaleidoscope Modularized Trading System
What is Loxx's "Giga Kaleidoscope Modularized Trading System"?
The Giga Kaleidoscope Modularized Trading System is a trading system built on the philosophy of the NNFX (No Nonsense Forex) algorithmic trading.
What is an NNFX algorithmic trading strategy?
The NNFX algorithm is built on the principles of trend, momentum, and volatility. There are six core components in the NNFX trading algorithm:
1. Volatility - price volatility; e.g., Average True Range, True Range Double, Close-to-Close, etc.
2. Baseline - a moving average to identify price trend
3. Confirmation 1 - a technical indicator used to identify trends
4. Confirmation 2 - a technical indicator used to identify trends
5. Continuation - a technical indicator used to identify trends
6. Volatility/Volume - a technical indicator used to identify volatility/volume breakouts/breakdown
7. Exit - a technical indicator used to determine when a trend is exhausted
How does Loxx's GKD (Giga Kaleidoscope Modularized Trading System) implement the NNFX algorithm outlined above?
Loxx's GKD v1.0 system has five types of modules (indicators/strategies). These modules are:
1. GKD-BT - Backtesting module (Volatility, Number 1 in the NNFX algorithm)
2. GKD-B - Baseline module (Baseline and Volatility/Volume, Numbers 1 and 2 in the NNFX algorithm)
3. GKD-C - Confirmation 1/2 and Continuation module (Confirmation 1/2 and Continuation, Numbers 3, 4, and 5 in the NNFX algorithm)
4. GKD-V - Volatility/Volume module (Confirmation 1/2, Number 6 in the NNFX algorithm)
5. GKD-E - Exit module (Exit, Number 7 in the NNFX algorithm)
(additional module types will added in future releases)
Each module interacts with every module by passing data between modules. Data is passed between each module as described below:
GKD-B => GKD-V => GKD-C(1) => GKD-C(2) => GKD-C(Continuation) => GKD-E => GKD-BT
That is, the Baseline indicator passes its data to Volatility/Volume. The Volatility/Volume indicator passes its values to the Confirmation 1 indicator. The Confirmation 1 indicator passes its values to the Confirmation 2 indicator. The Confirmation 2 indicator passes its values to the Continuation indicator. The Continuation indicator passes its values to the Exit indicator, and finally, the Exit indicator passes its values to the Backtest strategy.
This chaining of indicators requires that each module conform to Loxx's GKD protocol, therefore allowing for the testing of every possible combination of technical indicators that make up the six components of the NNFX algorithm.
What does the application of the GKD trading system look like?
Example trading system:
Backtest: Strategy with 1-3 take profits, trailing stop loss, multiple types of PnL volatility, and 2 backtesting styles
Baseline: Hull Moving Average
Volatility/Volume: Volatility Ratio as shown on the chart above
Confirmation 1: WYFX Clear Chart as shown on the chart above
Confirmation 2: Williams Percent Range
Continuation: Fisher Transform
Exit: Rex Oscillator
Each GKD indicator is denoted with a module identifier of either: GKD-BT, GKD-B, GKD-C, GKD-V, or GKD-E. This allows traders to understand to which module each indicator belongs and where each indicator fits into the GKD protocol chain.
Giga Kaleidoscope Modularized Trading System Signals (based on the NNFX algorithm)
Standard Entry
1. GKD-C Confirmation 1 Signal
2. GKD-B Baseline agrees
3. Price is within a range of 0.2x Volatility and 1.0x Volatility of the Goldie Locks Mean
4. GKD-C Confirmation 2 agrees
5. GKD-V Volatility/Volume agrees
Baseline Entry
1. GKD-B Baseline signal
2. GKD-C Confirmation 1 agrees
3. Price is within a range of 0.2x Volatility and 1.0x Volatility of the Goldie Locks Mean
4. GKD-C Confirmation 2 agrees
5. GKD-V Volatility/Volume agrees
6. GKD-C Confirmation 1 signal was less than 7 candles prior
Continuation Entry
1. Standard Entry, Baseline Entry, or Pullback; entry triggered previously
2. GKD-B Baseline hasn't crossed since entry signal trigger
3. GKD-C Confirmation Continuation Indicator signals
4. GKD-C Confirmation 1 agrees
5. GKD-B Baseline agrees
6. GKD-C Confirmation 2 agrees
1-Candle Rule Standard Entry
1. GKD-C Confirmation 1 signal
2. GKD-B Baseline agrees
3. Price is within a range of 0.2x Volatility and 1.0x Volatility of the Goldie Locks Mean
Next Candle:
1. Price retraced (Long: close < close or Short: close > close )
2. GKD-B Baseline agrees
3. GKD-C Confirmation 1 agrees
4. GKD-C Confirmation 2 agrees
5. GKD-V Volatility/Volume agrees
1-Candle Rule Baseline Entry
1. GKD-B Baseline signal
2. GKD-C Confirmation 1 agrees
3. Price is within a range of 0.2x Volatility and 1.0x Volatility of the Goldie Locks Mean
4. GKD-C Confirmation 1 signal was less than 7 candles prior
Next Candle:
1. Price retraced (Long: close < close or Short: close > close )
2. GKD-B Baseline agrees
3. GKD-C Confirmation 1 agrees
4. GKD-C Confirmation 2 agrees
5. GKD-V Volatility/Volume Agrees
PullBack Entry
1. GKD-B Baseline signal
2. GKD-C Confirmation 1 agrees
3. Price is beyond 1.0x Volatility of Baseline
Next Candle:
1. Price is within a range of 0.2x Volatility and 1.0x Volatility of the Goldie Locks Mean
3. GKD-C Confirmation 1 agrees
4. GKD-C Confirmation 2 agrees
5. GKD-V Volatility/Volume Agrees
█ WYFX Clear Chart
What is WYFX Clear Chart?
WYFX Clear Chart a variation of Heiken-Ashi candles that uses 62 different types of smoothing.
Requirements
Inputs
Confirmation 1 and Solo Confirmation: GKD-V Volatility / Volume indicator
Confirmation 2: GKD-C Confirmation indicator
Outputs
Confirmation 2 and Solo Confirmation: GKD-E Exit indicator
Confirmation 1: GKD-C Confirmation indicator
Continuation: GKD-E Exit indicator
Additional features will be added in future releases.
Cloak & Dagger Heikin-ashiThis indicator is intended to reduce market noise by averaging "Heikin-ashi" a few more times.
You can set the number of averages and how the closing price is calculated.
The Modes:
There are several presets.
The "Mode 1" is more conservative and flips fewer times, but with less noise.
(Averaged by 5 times, Close calculated by oc2)
The "Mode 2" is more aggressive, with more flips and faster timing.
(Averaged by 10 times, Close calculated by ohlc4)
Triggers:
Triggers the inversion of the bar. It can be visualized and alerts can be set.

[Pt] TICK + Heikin Ashi RSI IndicatorThis indicator combines NYSE TICK and RSI to aim to provide a view of NYSE market trend strength.
What is TICK
NYSE TICK, also known as the TICK index, is a technical analysis indicator that shows the number of stocks on the New York Stock Exchange (NYSE) that are trading on an uptick or a downtick in a particular period of time. The TICK index is calculated by subtracting the number of stocks trading on a downtick from the number of stocks trading on an uptick. A reading of +1000 on the TICK index, for example, would indicate that there are 1000 more stocks trading on an uptick than on a downtick. The TICK index is often used as a measure of market sentiment, as it can provide insight into whether there is more buying or selling pressure in the market at a given time. A high TICK index reading may suggest that there is strong buying pressure, while a low TICK index reading may indicate that there is more selling pressure in the market.
By default, I am using -800 and 800 for oversold and overbought levels. These are configurable. Also, this indicator includes TICK divergence signals.
The TICK index is usually very volatile, so this indicator is best suited for lower timeframes, such as 1 to 5 min charts.
Idea of TICK neutral zone
As part of this indicator I've identified what I consider as "neutral" range for the TICK. Based on my own personal experience, the market tends to be in consolidation or choppy in this range. By default, I've defined this range to be -200 to 200. This range is configurable.
Signals
In combination with RSI and Heikin Ashi RSI (HARSI), which help smooths out the RSI values and make it easier to identify trends and potential reversal points, this indicator aims to generate Bullish vs Bearish signals based on the following conditions:
- bullish / bearish HARSI candle
- Inside bar on HARSI candle
- TICK trend (above or below Neutral zone)
- RSI trend (above or below 0, but not overbought or oversold)
- RSI / HARSI convergence and divergence
When all bullish conditions are met, the signal turns bright green. Bright red when all bearish conditions are met. These generated signals aims to provide users easy to read visual cues to help with their trades.
A table is also provided in attempt to identify the trend in real time:
TICK trend:
- Bullish, Extended
- Bullish
- Neutral w/ Bullish bias
- Neutral w/ Bearish bias
- Bearish
- Bearish, Extended
RSI:
- Bullish
- Bearish
Note on scale
This indicator is based on the scale for TICK, hence the RSI and HARSI are scaled. By default, standard overbought RSI value of 70 = 800 on this scale, whereas oversold value of 30 = -800.
Credits:
Heikin Ashi RSI code was borrowed from @JayRogers - Heikin Ashi RSI Oscillator

MAGIC MACDMAGIC MACD ( MACD Indicator with Trend Filter and EMA Crossover confirmation and Momentum). This MACD uses Default Trading view MACD
from Technical indicators library and adding a second MACD along with 3 EMA's to detect Trend and confirm MACD Signal.
Eliminates usage of 3different indicators (Default MACD , MACD-2,EMA5, EMA20, EMA50)
Basic IDEA.
Idea is to filter Histogram when price is above or below 50EMA. Similar to QQE -mod oscillator but Has a EMA Filter
1.Take DEFAULT MACD crossover signals with lower period
2.check with a Higher MACD Histogram.
3.Enter upon EMA crossover signal and Histogram confirmation.
Histogram changes to GRAY when price is below EMA 50 or above EMA 50 (Follows Trend)
4.Exit on next Default MACD crossover signal.
Overview :
Moving Average Convergence Divergence Indicator Popularly Known as MACD is widely used. MACD Usually generates a lots of False signals
and noise in Lower Time Frames, making it difficult to enter a trade in sideways market. Divergence is a major issue along with sideways
movement and tangling of MACD and Signal Lines. There is no way to confirm a Default MACD signal, except to switch time frames and
verify.
Magic MACD Can be used to in combination with other signals.
This MACD uses two MACD Signals to verify the signal given by Default MACD . The Histogram Plot shown is of a higher period
MACD (close,5,50,30) values. When a signal is generated on a lower MACD it is verified by the histogram with higher time period.
Technicals Used:
1. Lower MACD-1 values 12,26 and signal-9 (crossover Signals)
2. Higher MACD-2 values 5,50 and signal-30 (Histogram)
3. EMA 50 (Histogram Filter to allow only if price above or below Ema 50)
4. EMA 5 and EMA 20 for crossover confirmation of trend
What's is in this Indicator?
1.Histogram-(higher period 5,50 and 30signal)
2. MACD crossover Signals-(lower period Default MACD setting)
3.Signal Lines-( EMA 5 & 20)
Implemented & Removed in this Indicator
1. Default MACD and Signal Lines are removed completely
2. MACD crossover are taken on lower periods and plotted as signals(Blue Triangle or Red Triangle)
3. Histogram is plotted from a higher Period providing a clear picture with Higher Time period
4. EMA 5 and EMA 20 are used for MACD signal confirmation
How to use?
Up Signal
1. MACD Default (12,26,30) up signals are shown in Blue
2. Wait till the Histogram changes Blue
3. Look for EMA signals crossover near by
Down Signal
1. MACD Default (12,26,30) up signals are shown in Red
2. Wait till the Histogram changes Red
3. Look for EMA signals crossover near by
Do's
Consider only opposite color as signals
1. Red Triangle on Blue Histogram(likely to move down direction)
2. Blue Triangle on Red Histogram (Likely to move up direction)
Don'ts
1.Ignore Blue Signal on Blue Histogram (pull back signals can be used to enter trade if you miss first crossover)
2.Ignore Red Signal on Red Histogram(pull back signals can be used to enter trade if you miss first crossover)
3.Ignore Up and Down signals till Gray or Blacked out area is finished in Histogram
Tips:
1. EMA plot also shows pull back areas along with signals
2.side by side opposite signals shows sides ways movement
3. EMA 5,20 is plotted on MACD Histogram for Additional Benefit
Thanks & Credits
To Tradingview Team for allowing me to use their default MACD version and coding it in to a MAGIC MACD by adding a few lines of code that
makes it more enhanced.
Warning...!
This is purely for Educational purpose only. Not to be used as a stand alone indicator. Usage is at your own Risk. Please get familiar with its working before implementing. Its not a Financial Advice or Suggestion . Any losses or gains is at your own risk.

Real Price Line + Dots (for Heikin Ashi)Real Price Line + Dots (for Heikin Ashi)
This indicator is designed for use on Heikin Ashi charts. Its purpose is to enable traders to benefit from price averaging and smoothing effects of Heikin Ashi candles whilst also enabling them to see the current real price line, and optionally, real price close dots on the Heikin Ashi candlesticks.
Features include:
- Optional real price line
- Optional real price close dots
- Customisable colours
- Customisable line style
- Customisable line width
What are Heikin Ashi candles?
Heikin Ashi means 'average bar' in Japanese, Heikin Ashi charts do not show real price as standard, due to the way the Open, High, Low and Close values are calculated using averages, This is done in order to create a smoother appearance and reduce the market 'noise'.
You can read more about Heikin Ashi candlesticks here.
NOTE:
- If real price dots appear behind the candles, you may need to select the triple dot menu on the indicator then select "Visual order" > "Bring to front" , so that the dots are shown above the candles.
- When using this indicator on a Heikin Ashi chart, the standard Tradingview price line will not show accurate real price. Therefore when using the price line in this indicator, the standard price line should be disabled within the Tradingview 'Chart settings' dialog > 'Symbol' tab > uncheck 'Last', under the 'Price line' section.

heikin ashi calculation call with higher timeframe
Hello, guys
This indicater displays the previous value of higher timeframe without request.security() function.
You can change the candle style ( heikinashi or normal) on the set box.
you can choose the higher timeframe also.
I made this to avoid the repainting.
Without Box() function, i only used plotcandle and fill.
It was good fun.
Good luck !!

Rate of Change Candle Standardized (ROCCS)ROCCS is a standardized rate of change oscillator with "error bars". Rate of change helps traders gauge momentum in a market by comparing the current price with the price "n" periods ago. What makes this special is you get to see the momentum of the momentum via the candle view. The candle transformation utilizes a moving average to smooth the signal however this is only used for the close price. The high and low prices are not smoothed. The moving average has an adjustable period, and so does the standardization.
I hope you can find great use in this upgraded roc indicator.

Close CandlesClosing candle takes any input and turs it into a candle stick chart. You can go from a regular candle chart by setting the length to 1, to heikin ashi by setting the length to 4. One of the features of this scripts is the ability to reuse the function. This function is a great addition to most scripts as it makes it really easy to give your script a candle view. As always I hope that you find this release useful. If you find any bugs please let me know. The same goes with any features you might want to request. This includes requesting custom indicators. Enjoy!
RF+ Replay for Heikin AshiRF+ Replay for Heikin Ashi
RF+ Replay for Heikin Ashi generates fully customisable Heikin Ashi candlesticks presented on a standard chart, enabling traders to utilise the Tradingview Replay feature with Heikin Ashi candlesticks when analysing and backtesting HA style strategies.
The features of this indicator include:
- Fully customisable Heikin Ashi Candles, including custom colour options for candle bodies, borders and wicks.
- Optional real-time, real-price close dots painted onto each candlestick.
- A optional set of 2 x Range Filters designed to indicate short term trend identification upon color change, ideal for low timeframe scalping.
- A optional set of 3 x fully customisable Moving Averages.
- An option to enable Heikin Ashi calculated data for the Range Filters and Moving Averages, so they present as they would on a Heikin Ashi non-standard chart type, without having to use an actual Heikin Ashi chart. Enabled by default.
- An optional sessions indicator, to highlight your prefered trading session for the purpose of backtesting.
- An optional watermark featuring customisable text and well as symbol and timeframe information, as seen in the screenshot of this indicator.
Instructions for use:
1) Because this indicator generates candlesticks and presents them onto your chart, you will need to hide the existing candlesticks so you do not see two sets of candles. You can do this by going into your Tradingview chart settings and making the candle bodies, borders and wicks fully transparent. You can then save this as a layout template. You can access your Chart Settings by clicking on the cog icon, or by right clicking on the chart itself and selecting 'Chart Settings' from the list.
2) Ensure you have the standard chart type selected - you do not need to select a Heikin Ashi type chart.
3) You will now be able to analyise and even backtest your Heikin Ashi style strategies including the use of the Tradingview Replay feature found at the top of the chart.
Heikin Ashi means 'average bar' in Japanese, which speaks to the fact that Heikin Ashi candles are calculated differently to standard Japanese candlesticks. The general idea of Heikin Ashi candles is to 'smooth' the appearance of price movement, by the use of averages within their calculation. It is important to understand that the Open and Close values of a Heikin Ashi candlestick do not reflect real Open and Close prices. You can use the real price dots feature to clearly see the real time and real price Close of each candle.
The formula for calculating a Heikin Ashi candlestick is as follows:
High = Maximum of High, Open, or Close (whichever is highest)
Low = Minimum of Low, Open, or Close (whichever is lowest)
Open = Open (previous bar) + Close (previous bar) /2
Close = (Open + High + Low + Close) / 4
If you found this useful, be sure to leave a like, comment and subscribe to show your support.
Until next time.

6 Multi-Timeframe Supertrend with Heikin Ashi as Source
This is a multiple multi-timeframe version of famous supertrernd only with Heikin Ashi as source. Atr which stands in the heart of supertrend is calculated based on heikin-ashi bars which omits a great deal of noises.
with 6 multiplication of the supertrend, its simply much easier to spot trend direction or use it as trailing stop with several levels available.
this is a great tool to assess and manage your risk and calculate your position volume if you use the heikin ashi supertrend as your stoploss.

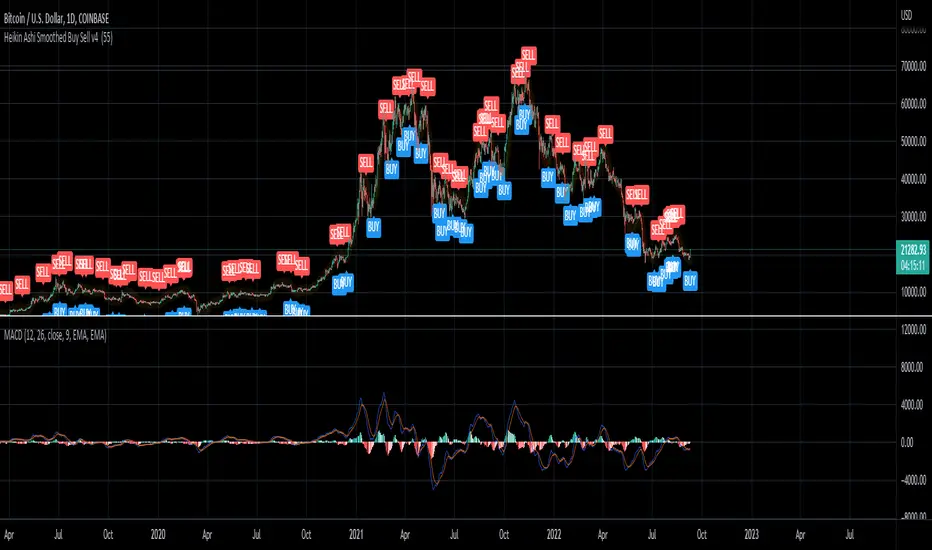
Heikin Ashi Smoothed Buy Sell (Sunseeder) I like to use it on the daily. This helps with indicating buy signals on the DXY, BITCOIN and ETH charts. You're able to customize the colors of the buy signals etc. Enjoy!
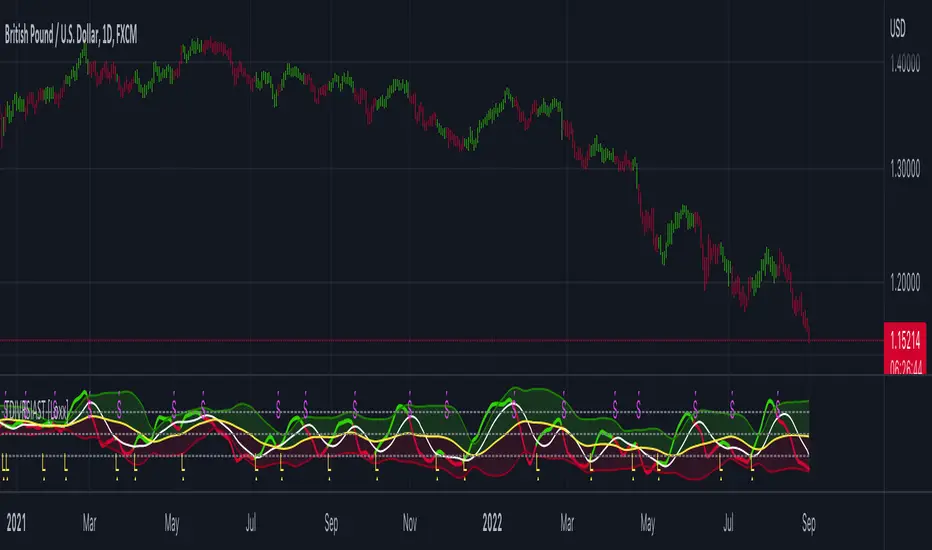
TDI w/ Variety RSI, Averages, & Source Types [Loxx]This hybrid indicator is developed to assist traders in their ability to decipher and monitor market conditions related to trend direction, market strength, and market volatility. Even though comprehensive, the Traders Dynamic Index (TDI) is easy to read and use. This version of TDI has 7 different types of RSI, 38 different types of Moving Averages, 33 source types, and 5 types of signals as well as alerts and coloring. Default RSI type is set to Jurik's RSX. This indicator can be used on any timeframe.
Green/Red line = RSI Price line
White line = Trade Signal line
Dark Green/Red lines = Volatility Band
Yellow line = Market Base Line
Gray dashed lines = Horizontal boundary lines, oversold/overbought
5 Signal Types w/ Alerts
Signal Crosses = Green/Red line crosses over or under White line
Floating Boundary Crosses = Green/Red line crosses over or under upper Dark Green/ lower Red lines
Horizontal Boundary Crosses = Green/Red line crosses over or under Gray dashed upper/lower lines
Floating Middle Crosses = Green/Red line crosses over or under Yellow line
Horizontal Middle Crosses = Green/Red line crosses over or under Gray dashed middle line
Manual Signal Types (no alerts included, this requires manual analysis)
Volatility Band Signals (Dark Green/Red lines) = When the Dark Green/Red lines are expanding, the market is strong and trending. When Dark Green/Red lines are constricting, the market is weak and in a range. When the Dark Green/Red lines are extremely tight in a narrow range, expect an economic announcement or other market condition to spike the market
Beyond these simple signal rules, there are various other signals or methods that can be used to derive long/short/exit signals from TDI included slope of the Green/Red line and bounces off the Yellow line.
Included
Loxx's Expanded Source Types
Loxx's Variety RSI
Loxx's Moving Averages
Signals
Alerts
Bar coloring
ARKA-Stoplight Trend AnalysisBars turn green when the 5-period moving average is above the 15-period moving average, and the 15-period moving average is above the 30-period moving average. If all three degrees of the trend are positive, the trend is up, and we can more confidently enter on the long side by confirming our trading system.
Bars turn red when the 5-period moving average is below the 15-period moving average and the 15-period moving average is below the 30-period moving average. If all three degrees of the trend are negative, the trend is a downside, and we can enter on the short side by confirming our trading system.
The bars turn yellow when the three moving averages are not in the two ways mentioned above, it is a sign of weakness and side market. In this situation, because the direction of the market is not yet clear, we do not have an entry and we wait.
MTF Heikinashi BarOVERVIEW
This indicator shows whether Heikin Ashi is up or down, represented by a bar. This indicator is compatible with MTF.
CONCEPTS
What do you want to know about market analysis?
Do you want a hard analysis? You can look for it.
All I want to know is whether the commonly known technical analysis is 'UP' or 'DOWN'.
All I want to know is whether the current market price is going up or down. Not only for the current, but also for the monthly, weekly, and daily status.
I want to make a decision in a moment. Without even thinking about it.
That is why I created a color-coded bar indicator to show the status.
No need to frown anymore.
DETAILS
Heikin means average. Ashi means legs. In this case, it means a candle.
Close = (Close + Open + High + Low) / 4
For more information, click here.
tradingview.com
Heikin Ashi Up ⇒ green
Heikin Ashi Down ⇒ red
