Multi-TF Quarter & Session Candle Indicator-aamirlang [Beta]Key Features:
Quarter Identification: It detects 90-minute HTF candles on 5-minute charts and labels them as Q1, Q2, Q3, Q4 for clear session tracking.
Session Identification (Asia, London, NY, PM): Identifies sessions on 15-minute and 60-minute charts and labels them automatically. So that you can visually see whats happening on Higher TimeFrame.
CISD Detection: Highlights Critical Swing Directions to pinpoint potential market reversals.
Sweep Detection: Automatically draws sweeps to indicate price levels tested or broken.
Multi-Timeframe Support: Works seamlessly on 1m, 5m, 15m, 60m, Daily, Weekly, and Monthly charts.
How It Works:
If you do not see higher TF Candles please enable them from the Menu.
Detects and prints HTF candle and automatically detects Quarters and Sessions.
Automatically maps 5m to 90m (Quarter of a Session) HTF and labels Q1/Q2/Q3/Q4 to each candle so that you can visually see how a session is going on and what to expect in comming sessions.
Automatically detects a Session and labels sessions Asia/London/NY/PM.
When working in Higher TF other that 4H, It prints Daily candles by labeling them.
Other timeframes show normal candle time or standard D/W/M formatting.
CISD module identifies critical swing directions.
Sweeps are drawn automatically to highlight tested levels.
By using this Indicator:
Quickly identify session and quarter candles without manual calculations.
Detect intraday swing directions and potential reversal zones.
Visualize volatility for better risk management.
Perfect for intraday, swing, and long-term analysis.
Credits:
Credit to: @traderdaye for Quarterly theory.
and to all the beautiful people on Tradingview who contributed.
Note:
This is free and version so it may contain error or bugs please leave a comment for any bugs, suggestions and queries.
Enjoy Trading.
Htfanalysis

RSI HTF Hardcoded (A/B Presets) + Regimes [CHE]RSI HTF Hardcoded (A/B Presets) + Regimes — Higher-timeframe RSI emulation with acceptance-based regime filter and on-chart diagnostics
Summary
This indicator emulates a higher-timeframe RSI on the current chart by resolving hardcoded “HTF-like” lengths from a time-bucket mapping, avoiding cross-timeframe requests. It computes RSI on a resolved length, smooths it with a resolved moving average, and derives a histogram-style difference (RSI minus its smoother). A four-state regime classifier is gated by a dead-band and an acceptance filter requiring consecutive bars before a regime is considered valid. An on-chart table reports the active preset, resolved mapping tag, resolved lengths, and the current filtered regime.
Pine version: v6
Overlay: false
Primary outputs: RSI line, SMA(RSI) line, RSI–SMA histogram columns, reference levels (30/50/70), regime-change alert, info table
Motivation
Cross-timeframe RSI implementations often rely on `request.security`, which can introduce repaint pathways and additional update latency. This design uses deterministic, on-series computation: it infers a coarse target bucket (or uses a forced bucket) and resolves lengths accordingly. The dead-band reduces noise at the decision boundaries (around RSI 50 and around the RSI–SMA difference), while the acceptance filter suppresses rapid flip-flops by requiring sustained agreement across bars.
Differences
Baseline: Standard RSI with a user-selected length on the same timeframe, or HTF RSI via cross-timeframe requests.
Key differences:
Hardcoded preset families and a bucket-based mapping to resolve “HTF-like” lengths on the current chart.
No `request.security`; all calculations run on the chart’s own series.
Regime classification uses two independent signals (RSI relative to 50 and RSI–SMA difference), gated by a configurable dead-band and an acceptance counter.
Always-on diagnostics via a persistent table (optional), showing preset, mapping tag, resolved lengths, and filtered regime.
Practical effect: The oscillator behaves like a slower, higher-timeframe variant with more stable regime transitions, at the cost of delayed recognition around sharp turns (by design).
How it works
1. Bucket selection: The script derives a coarse “target bucket” from the chart timeframe (Auto) or uses a user-forced bucket.
2. Length resolution: A chosen preset defines base lengths (RSI length and smoothing length). A bucket/timeframe mapping resolves a multiplier, producing final lengths used for RSI and smoothing.
3. Oscillator construction: RSI is computed on the resolved RSI length. A moving average of RSI is computed on the resolved smoothing length. The difference (RSI minus its smoother) is used as the histogram series.
4. Regime classification: Four regimes are defined from:
RSI relative to 50 (bullish above, bearish below), with a dead-band around 50
Difference relative to 0 (positive/negative), with a dead-band around 0
These two axes produce strong/weak bull and bear states, plus a neutral state when inside the dead-band(s).
5. Acceptance filter: The raw regime must persist for `n` consecutive bars before it becomes the filtered regime. The alert triggers when the filtered regime changes.
6. Diagnostics and visualization: Histogram columns change shade based on sign and whether the difference is rising/falling. The table displays preset, mapping tag, resolved lengths, and the filtered regime description.
Parameter Guide
Source — Input series for RSI — Default: Close — Smoother sources reduce noise but add lag.
Preset — Base lengths family — Default: A(14/14) — Switch presets to change RSI and smoothing responsiveness.
Target Bucket — Auto or forced bucket — Default: Auto — Force a bucket to lock behavior across chart timeframe changes.
Table X / Table Y — Table anchor — Default: right / top — Move to avoid covering content.
Table Size — Table text size — Default: normal — Increase for presentations, decrease for dense layouts.
Dark Mode — Table theme — Default: enabled — Match chart background for readability.
Show Table — Toggle diagnostics table — Default: enabled — Disable for a cleaner pane.
Epsilon (dead-band) — Noise gate for decisions — Default: 1.0 — Raise to reduce flips near boundaries; lower to react faster.
Acceptance bars (n) — Bars required to confirm a regime — Default: 3 — Higher reduces whipsaw; lower increases reactivity.
Reading
Histogram (RSI–SMA):
Above zero indicates RSI is above its smoother (positive momentum bias).
Below zero indicates RSI is below its smoother (negative momentum bias).
Darker/lighter shading indicates whether the difference is increasing or decreasing versus the previous bar.
RSI vs SMA(RSI):
RSI’s position relative to 50 provides broad directional bias.
RSI’s position relative to its smoother provides momentum confirmation/contra-signal.
Regimes:
Strong bull: RSI meaningfully above 50 and difference meaningfully above 0.
Weak bull: RSI above 50 but difference below 0 (pullback/transition).
Strong bear: RSI meaningfully below 50 and difference meaningfully below 0.
Weak bear: RSI below 50 but difference above 0 (pullback/transition).
Neutral: inside the dead-band(s).
Table:
Use it to validate the active preset, the mapping tag, the resolved lengths, and the filtered regime output.
Workflows
Trend confirmation:
Favor long bias when strong bull is active; favor short bias when strong bear is active.
Treat weak regimes as pullback/transition context rather than immediate reversals, especially with higher acceptance.
Structure + oscillator:
Combine regimes with swing structure, breakouts, or a baseline trend filter to avoid trading against dominant structure.
Use regime change alerts as a “state change” notification, not as a standalone entry.
Multi-asset consistency:
The bucket mapping helps keep a consistent “feel” across different chart timeframes without relying on external timeframe series.
Behavior/Constraints
Intrabar behavior:
No cross-timeframe requests are used; values can still evolve on the live bar and settle at close depending on your chart/update timing.
Warm-up requirements:
Large resolved lengths require sufficient history to seed RSI and smoothing. Expect a warm-up period after loading or switching symbols/timeframes.
Latency by design:
Dead-band and acceptance filtering reduce noise but can delay regime changes during sharp reversals.
Chart types:
Intended for standard time-based charts. Non-time-based or synthetic chart types (e.g., Heikin-Ashi, Renko, Kagi, Point-and-Figure, Range) can distort oscillator behavior and regime stability.
Tuning
Too many flips near decision boundaries:
Increase Epsilon and/or increase Acceptance bars.
Too sluggish in clean trends:
Reduce Acceptance bars by one, or choose a faster preset (shorter base lengths).
Too sensitive on lower timeframes:
Choose a slower preset (longer base lengths) or force a higher Target Bucket.
Want less clutter:
Disable the table and keep only the alert + plots you need.
What it is/isn’t
This indicator is a regime and visualization layer for RSI using higher-timeframe emulation and stability gates. It is not a complete trading system and does not provide position sizing, risk management, or execution rules. Use it alongside structure, liquidity/volatility context, and protective risk controls.
Disclaimer
The content provided, including all code and materials, is strictly for educational and informational purposes only. It is not intended as, and should not be interpreted as, financial advice, a recommendation to buy or sell any financial instrument, or an offer of any financial product or service. All strategies, tools, and examples discussed are provided for illustrative purposes to demonstrate coding techniques and the functionality of Pine Script within a trading context.
Any results from strategies or tools provided are hypothetical, and past performance is not indicative of future results. Trading and investing involve high risk, including the potential loss of principal, and may not be suitable for all individuals. Before making any trading decisions, please consult with a qualified financial professional to understand the risks involved.
By using this script, you acknowledge and agree that any trading decisions are made solely at your discretion and risk.
Best regards and happy trading
Chervolino.

Rogue 4H ORRogue 4H OR – Opening Range
The Rogue 4H Daily OR is a powerful Opening Range tool designed to help traders identify key intraday levels and capitalize on failed breakout setups.
Key Features:
Custom Opening Range: Define your OR start and end times (default 4H) to suit any market – stocks, forex, or crypto.
Locked Levels: Once the OR session ends, the high and low are locked and projected across the trading day.
Fakeout Signals: Triangular buy/sell markers plot when price breaks out of the OR and then closes back inside, signaling potential reversal entries.
Daily Reset: Signals and ranges reset each trading day for clean analysis.
Session Cutoff: Optional cutoff time prevents late-day signals from cluttering your chart.
How to Use:
Adjust the OR start/end time to match your trading session (e.g., 09:30–13:30 for US stocks, 00:00–04:00 for crypto).
Watch for false breakouts → a close above the OR high that falls back inside signals a short, while a close below the OR low that reclaims the range signals a long.
Use the signals in confluence with trend, volume, or other confirmation tools for best results. **This is not financial advice.**
Designed for traders who thrive on intraday range dynamics and want a visual, session-based tool to spot high-probability setups.
**This is not financial advice**

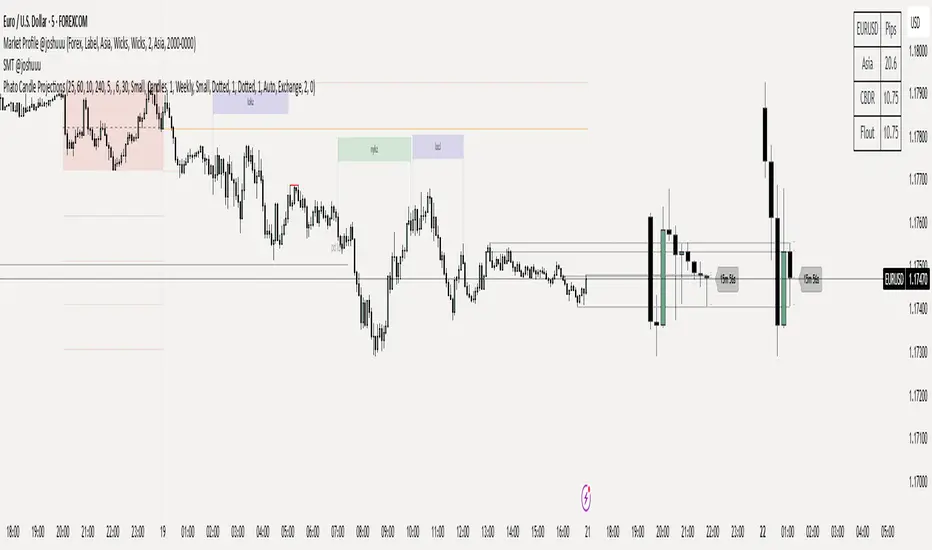
Phato Candle ProjectionsThis is a fire indicator which shows htf candles on the higher timeframe on one chart + it shows timer and you can select which timeframes you wanna see
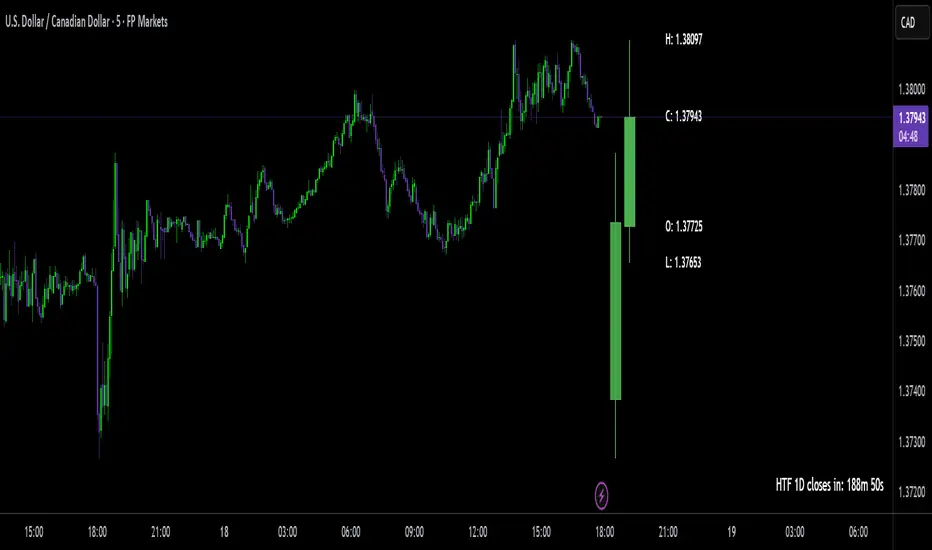
HTF Big Candle ProjectionsWhat it does
This indicator overlays higher-timeframe (HTF) “big candles” at the right edge of any chart and keeps them perfectly parallel with price while you zoom or pan. In End-of-Chart (EOC) mode, all objects are anchored by bar index (not time) and clamped to TradingView’s ≤500 bars into the future rule, so they move 1:1 with the chart—no drift, no lag. A fallback mode preserves time-anchored labels if you prefer them.
Why it’s different / useful
Most MTF overlays drift when you scale or pan because they anchor by time or mix coordinate systems. This script anchors every end-of-chart object (bodies, wicks, OHLC guide lines, labels, range readout) in bar-index space, so the overlay scales identically to real bars. It also includes a safe-clamp to the 500-bar forward limit, automatic TF mapping for D/W/M charts, and optional projections from the previous HTF candle.
How it works (technical overview)
HTF data: The indicator fetches HTF OHLC using request.security() (no lookahead) and updates the current HTF candle live on each chart bar.
EOC placement (ON): Big candles are rendered with index-anchored boxes + wicks (box.new + line.new). X-positions are computed from bar_index + offset, then clamped to stay within the forward limit.
Fallback placement (OFF): Label coordinates switch to time-anchored for familiarity; candle bodies remain parallel via index logic.
OHLC helpers: Optional high/low/close guide lines extend right from the active HTF candle; OHLC labels and a range label can be placed to the side; a remaining-time widget shows how long until the HTF bar closes.
No lookahead / repaint caveat: The current HTF candle naturally evolves until it closes; that’s expected behavior for real-time HTF overlays.
Inputs & features
Place at end of chart (EOC mode toggle): index-anchored layout with ≤500-bar clamp.
Right Candle Timeframe: auto-map for D/W/M (D→W, W→M, M→3M) or set manually.
Offsets & width: right-edge offset (bars), left-candle offset, body width (bars), minimum gap between candles.
Wicks: show/hide (fallback mode draws wicks; index mode draws them via lines).
OHLC guide lines: toggle H/L/C, choose style/width/color, with right-side projection distance.
OHLC labels: side selection, text size, background/text colors, side offset.
Range label: toggle, side offset, size; option to show pip units (1/mintick).
Prev candle projections: optional HTF high/low lines from the left candle.
Remaining-time panel: live countdown to the HTF bar close.
Colors: bullish/bearish bodies and wicks.
How to use
Add to any chart (works best on intraday charts when viewing D/W/M candles).
Keep “Place at end of chart” ON for perfect parallel tracking while zooming/panning.
Choose Right Candle Timeframe (or use auto for D/W/M).
Adjust Body Width and Label/Line Offsets to taste. If you push offsets too far, the script auto-clamps objects to respect the 500-bar forward limit.
Optionally enable Prev Candle HL projections, OHLC labels, and the Range readout.
Publish with a clean chart so the overlay is easy to understand at a glance.
Notes & limitations
Forward plotting limit: TradingView only allows drawing ≤500 bars into the future. The script clamps all end-of-chart objects automatically; if you request more, it will shorten projections to remain compliant.
Sessions & symbols: Exotic sessions or illiquid symbols may produce uneven HTF boundaries. If needed, set the Right Candle Timeframe manually.
No signals, no promises: This is a visualization tool—it does not generate trade signals or promise performance. Use it alongside your own analysis and risk management.
Settings quick reference
EOC mode: ON (index-anchored) / OFF (time-anchored labels).
Right Candle TF: Auto D→W→M→3M or manual TF.
Offsets: Right edge, left candle, label/range/line projections.
Body Width: Candle thickness in bars.
Lines/Labels: OHLC guides, OHLC labels, Range label.
Prev HL: Previous HTF high/low projections.
Timer: Remaining time in the current HTF bar.
Colors: Bull/Bear bodies, wicks.
Disclaimer
For educational purposes only. Not financial advice. Past performance does not guarantee future results. Always test on your own and trade responsibly.
Author’s note on originality
This script focuses on bar-index anchored EOC rendering with comprehensive forward-clamping and dual label modes, aiming to solve the common drift/desync issues seen in MTF overlays during chart scaling.
HTF High/Low Targets This script plots the previous Highs and Lows of the 1HR, 4HR, Daily, and Weekly timeframes.
Each level is color-coded, extends across the chart, and includes labels to help you spot key areas of past support and resistance.
Use this tool to:
- Confirm intraday price reactions at HTF zones
- Identify high-probability reversal or breakout areas
- Get notified with built-in alerts when price crosses a level
You can toggle each timeframe level on/off in the settings panel.
Great for:
- Day traders and scalpers who trade off 1-minute or 5-minute charts
-Swing traders looking for confluence with HTF zones
- Anyone using a multi-timeframe analysis approach
Created by @mychaellesliemedia.

HTF CandlesHTF Candles, Plot of a Higher/Lower Timeframe Candles on any chart.
This HTF / LTF candle plot displays the previous 3 daily candles with the current update of the price with reference to a lower time frame.
Candles includes 3 Candles of HTF
last HTF candle includes 4 previous candles from LTF
Candle High Low Open Close are plotted.
these OHLC values act as Support and Resistance With reference to current Price.
very useful in making HTF and LTF analysis with reference to current timeframe.

Structure Pilot Vision [Wang Indicators]Built and refined with Dave Teaches, the HTF Vision Pro supercharges the trader, providing them with the tools to approach price with a layered analysis.
Providing the trader the instruments to put on the spotlight significant zones to anticipate price deliveries
HTF CANDLE VISION
Displays up to 3 series of HTF Candles
Shows candlesticks from a higher time frame (e.g., daily, 4-hour, weekly) on a lower time frame chart (e.g., 1-hour, 15-minute). This allows traders to simultaneously observe both short-term and long-term market dynamics.
Customizable Time Frames: Users can select any higher time frame to overlay on the current chart. Common time frames include daily, weekly, and monthly candles, but other custom time frames can also be used.
Color Coding: The HTF candles are color-coded for easy differentiation from the lower time frame candles. Users can customize colors to suit their preferences.
Open, High, Low, Close (OHLC) Representation: The indicator displays the full candlestick pattern for the chosen HTF, including the open, high, low, and close values. This helps traders easily identify key price levels and trends.
Settings :
Number of candles
Space between the chart and the HTF candles
Space between candles sets
Size : from Tiny (2x regular candle size) to Large (x8 regular candle size)
Space between candles
Colors of candles, borders and wicks
Incorporating a Higher Time Frame (HTF) candle into your Lower Time Frame (LTF) chart can be immensely beneficial for traders looking to enhance their analysis and decision-making process.
Use Cases for HTF Candles on LTF Charts:
Trend Confirmation:
Use Case: A trader might be looking at a 15-minute chart (LTF) but wants to confirm if the short-term trends align with the daily trend (HTF). Plotting a daily candle on the 15-minute chart helps visualize whether the short-term movements are part of a broader, longer-term trend.
Support and Resistance Identification:
Use Case: By plotting a weekly candle on a daily chart, traders can quickly identify levels that have acted as significant support or resistance in the past on the higher time frame, which might not be as visible or influential on the daily chart alone.
Entry and Exit Points Enhancement:
Use Case: When preparing to enter a trade based on a 1-hour chart, overlaying a 4-hour candle can provide insights into potential reversal points or continuation patterns that are more significant on the higher time frame, thus refining entry and exit strategies.
Volatility and Breakout Analysis:
Use Case: Seeing how a single HTF candle (like a monthly candle on a weekly chart) closes can give traders an idea of the market's volatility or the strength behind breakouts. A long wick on the HTF candle might suggest a rejected breakout or a potential reversal.
Risk Management:
Use Case: Using an HTF candle can help set more informed stop-loss levels. For instance, if a trader uses a 4-hour candle on a 1-hour chart, they might place their stop-loss just beyond the low of the HTF candle, assuming this represents a significant level of support or resistance.
Contextual Trading Decisions:
Use Case: For scalpers or day traders, understanding where the current price action sits within the context of a higher timeframe can lead to better decision-making. For instance, trading within an HTF consolidation range might suggest less aggressive moves, while being near the top or bottom of such a range might indicate potential for larger movements.
Market Sentiment Analysis:
Use Case: The color (red for bearish, green for bullish) and size of the HTF candle can give a quick visual cue of the market sentiment over that period, helping traders assess whether they are going with or against the broader market flow.
Swing Trading:
Use Case: Swing traders might plot a weekly candle on a daily chart to align their trades with the direction of the weekly trend, ensuring they're not fighting the broader market momentum.
Educational and Visual Reference:
Use Case: For educational purposes, having an HTF candle overlay can serve as a visual reminder for students or new traders about how price movements on different time frames can influence each other, aiding in teaching concepts like "the trend is your friend."
Wang use cases :
The way it is intended to be used is as follow
If you trade the 1 min chart and have a set of 5 min HTF candles plotted on your charts it could be used as follow :
As long as the 5 min keep providing close below the last 5 min candle if you're short you're safe ... if the 5 min candle stop closing below the last ones and start giving up-close you should consider closing your trade
Another use of HTF Candle is to find fractals responsible (up or down internal mouv before the breakout that creates a new zone). This fractal acts as supply and demand zone responsible for maintening the trend or for a reversal.
See examples below :
These fractals are interesting zones because they often cause the price to react, so following a flip in the fractal, you can take a short in bearish zones and a long in bullish zones. Fractals are easier to detect thanks to the HTF candles function, and allow you to enter positions with greater confidence. They can be used in the same way as the 70%, 50% and 30% interest zones, or they can be used simultaneously.
Use with zones :
▫️ VERTICAL BARS VISION ▫️
The vertical bars provide a view of market fractality: on a low time frame chart, they show the size of a candle in a higher time frame, and thus give a better understanding of the price fractality essential to the strategy we use.
Example :
For your information, when you modify data in the vertical bars or HTF candles parameters, the two are synchronized automatically.
The Vertical HTF Candle Closures Indicator is a simple yet effective tool that helps traders visually track the closing times of higher time frame (HTF) candles (such as 4H, 1H, 15M) on a lower time frame chart (e.g., 1-minute).
This feature plots vertical lines on the chart at the exact closure time of each selected HTF, allowing traders to quickly recognize key moments when the HTF candles close, or better yet when we trade above / below the last one and reverse ''sweepy sweepy'' .
Its more like a vertical and more micro visualisation than the HTF Candles.
Wang usage :
its a great tool to be able to reverse engineer what's in a HTFcandle precisely its a good combination with HTF candle projections to train the eyes of the traders about Whats is inside a candle that formed on the higher time frame
Limitation & know issues :
The chart may become cluttered with too many lines if multiple time frames are selected. Adjusting the line style or disabling certain time frames can help reduce visual noise.
On low time frame (<30s), some bar may notshow exactly on time (e.g : in 10sec timeframe, the 15min bar can be displayed at 01:15:10 instead of 01:15:00).
Because of the data provider and the interpreter of Trading View, if there is not data for a candle, Trading view just "skip" the candle. Sometime, those skip are on the candle that goes to 15min, 1 hour or 4 hour. As this is a Trading View issue. There is pretty much nothing we can do.
Some users may experience vertical bars at 1am, 5am, 9am ... instead of 0am, 4am, 8am ... That is because of the difference between the Timezone set on the chart and the timezone of the market they trade. Vertical bar will always refer to the symbol displayed

HTF FVG and Wick Fill trackingImbalances in the charts are some of the clearest and most traded price areas. Two of the best and most used are fair value gaps FVGs and large candle wicks. In both of these price appears to move in such a way that most are left behind having 'missed' the move. But in reality price will often come back to these price points to re-balance and absorb the liquidity that was left behind.
This indicator takes these areas and makes viewing and tracking them clearer than ever. It does this, by first allowing the user to overlay a higher timeframe candle on the current chart. This in itself provides an in depth look at a higher timeframe candle both as it forms and in its final form.
Next the indicator identifies either the FVG or large wicks, on the chosen higher timeframe, all while the chart remains on a lower timeframe. As seen here the fair value gaps are clearly highlighted, taken from a 4 hour timeframe, while the actual chart is on 15 minutes. This allows the user even greater accuracy in identifying their key trading areas.
Utilizing the indicators unique feature, these areas can optionally be extended forward to the current timeframe and 'filled' in realtime. Areas that are filled to the users defined level, will be removed from the chart.
With supplementary settings for how much history to show, how large of a wick should be highlighted and complete control over the colour scheme, users will be able to track and understand the filling of imbalances like never before.

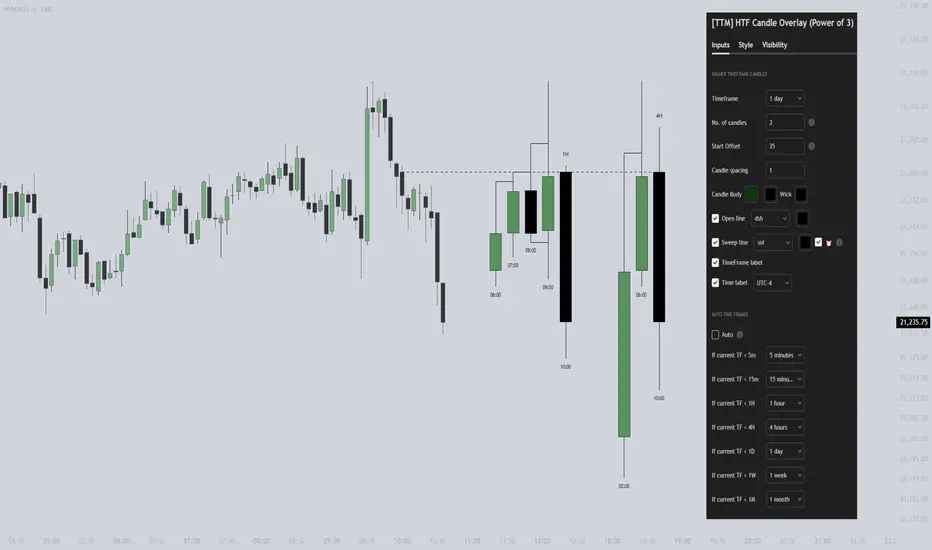
[TTM] HTF Candle Overlay (Power of 3)🌟 Overview 🌟
Introducing the all-new Higher Timeframe Candle Overlay indicator, crafted from the foundational principles of AMD (Accumulation, Manipulation, and Distribution) and PO3 (Power of 3). Elevate your trading strategy with this innovative tool, designed to provide deeper insights into market dynamics.
Explore ICT's resources for detailed insights on leveraging this in your trading strategy.
🌟 Features 🌟
Display up to 20 historical candles from any timeframe higher than the current chart's timeframe.
Auto Timeframe feature dynamically sets the higher timeframe based on the current chart's timeframe. For instance, on a 15-minute chart, you can display 1-hour candles, and on a 1-hour chart, you can display 4-hour candles, eliminating the need to update the timeframe settings manually.
Load multiple instances of the indicator with different timeframes (e.g., 4H and Daily, as shown in the preview image).
Option to Show/Hide Candle open line.
Option to Show/Hide Candle Timeframe.
Option to Show/Hide each candle's time/day.
🌟 Coming Soon 🌟
Fair value gaps highlighted on HTF overlay candles.
Happy Trading!
TheTickMagnet
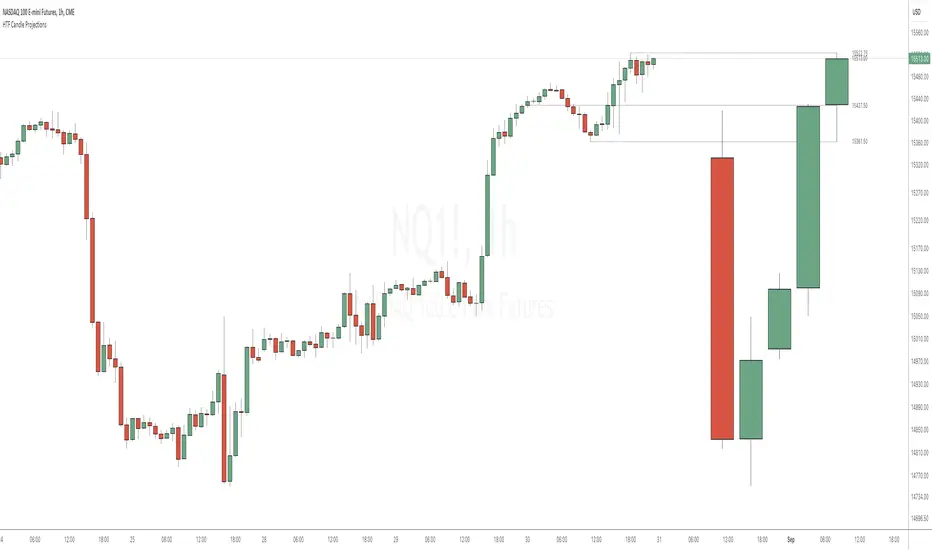
HTF Candle ProjectionsThe HTF Candle Projections indicator shows a number of candles from a higher time frame (HTF) projected to the right of the candles in the current timeframe. This can be very useful if you want to analyze two different timeframes without the need to switching between the different timeframes.
This indicator is highly inspired by the HTF Power of Three indicator by @toodegrees but is fully free and open source, it also have support for showing more than just one candle in the projection. It is also inspired by the HTF Candle Insights (Expo) indicator by @Zeiierman but differ in the way that it update the HTF candles in real time and also have support for showing Open/High/Low projections that also updates in real time.
This indicator is released under TradingViews default license ( Mozilla Public License 2.0 )
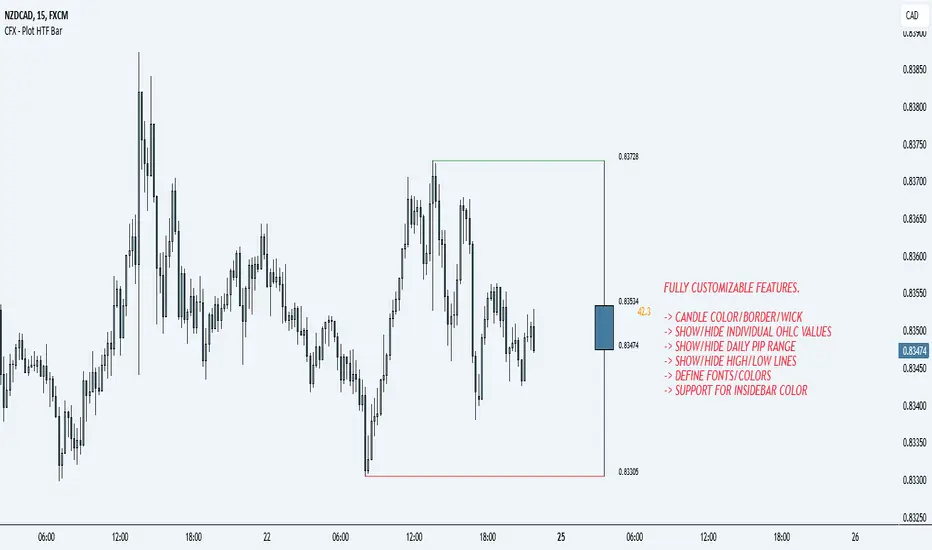
CFX - Plot HTF BarIf you lose track of what's going on while being on the lower timeframes, you can use this indicator in order to plot the higher timeframe bar to the right hand side of the chart.
Supports multiple timeframes
Supports different colors
Supports different color for inside bars
Supports toggle-able pip range
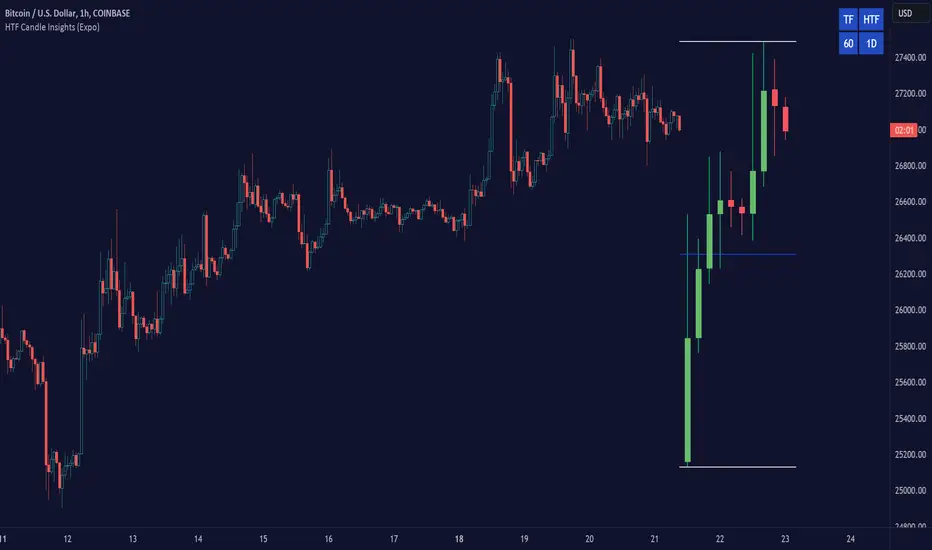
HTF Candle Insights (Expo)█ Overview
The HTF Candle Insights indicator helps traders see what's happening in larger time frames (HTF) while they're looking at smaller ones. This tool lets traders get a complete picture of market trends and price movements, helping them make smarter trading choices. It's really useful for traders who want to understand the main market trends without constantly switching between different chart timeframes.
In simpler terms , this indicator brings the big picture into the smaller frame, so traders don't miss out on what's important while focusing on the details.
█ How It Works
The indicator plots HTF candles on the existing chart, allowing users to view them concurrently with the candles of the current timeframe. This dual visual representation helps in discerning the prevalent market trends and significant price levels from both the current and higher timeframes.
█ How to Use
Trend Analysis
Traders can leverage this indicator to analyze overall market trends by observing HTF candles alongside the current timeframe candles. Recognizing HTF trends aids in aligning trades with the dominant market movement, potentially increasing the probability of successful trades.
Support and Resistance Identification
By viewing the high, low, and mid-levels of HTF candles, traders can identify potential support and resistance zones, enabling them to establish strategic entry and exit points, place stop-losses effectively, and manage risk proficiently.
█ Settings
Timeframe and Candle Amount:
Users can specify the higher timeframe and the number of HTF candles they wish to visualize on their current chart.
Visual Adjustments:
Traders can customize the color schemes for upward and downward candles and their wicks, and adjust the visibility and colors of the range lines, allowing for a tailored visual experience.
Range Lines:
Users have the option to display the high/low range of the displayed candles, and, if preferred, the mid-range line, enabling them to gain insights into significant price levels and ranges.
Table Display:
The indicator offers the ability to display a table, which provides an overview of the current chart's timeframe and the specified HTF.
-----------------
Disclaimer
The information contained in my Scripts/Indicators/Ideas/Algos/Systems does not constitute financial advice or a solicitation to buy or sell any securities of any type. I will not accept liability for any loss or damage, including without limitation any loss of profit, which may arise directly or indirectly from the use of or reliance on such information.
All investments involve risk, and the past performance of a security, industry, sector, market, financial product, trading strategy, backtest, or individual's trading does not guarantee future results or returns. Investors are fully responsible for any investment decisions they make. Such decisions should be based solely on an evaluation of their financial circumstances, investment objectives, risk tolerance, and liquidity needs.
My Scripts/Indicators/Ideas/Algos/Systems are only for educational purposes!
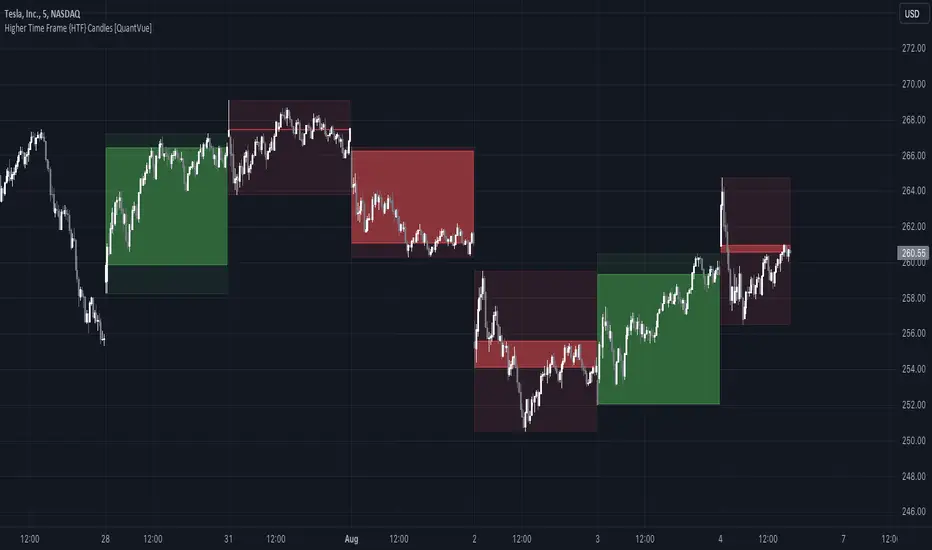
Higher Time Frame {HTF} Candles [QuantVue]Introducing the Higher Time Frame {HTF} Candles from QuantVue!
This script was developed to help you visually emphasize higher time frame (HTF) candles.
Higher time frames reduce the 'noise' inherent in lower time frames, providing a clearer, more accurate picture of the market's movements.
By examining higher time frames, you can better identify trends, reversals, and key areas of support and resistance.
The Higher Time Frame Candles indicator overlays higher time frame data directly onto your current chart.
You can easily specify the higher time frame candles you'd like to view, and the indicator will overlay the higher time frame candles directly over the corresponding current time frame bars.
This indicator by default will display the most current higher time frame candle plus the previous 5 candles.
Give this indicator a BOOST and COMMENT your thoughts!
We hope you enjoy.
Cheers.
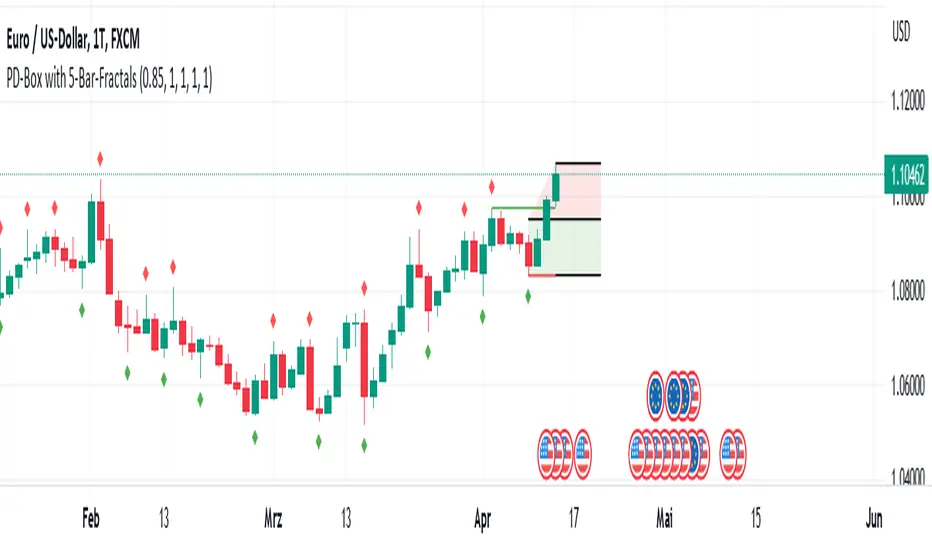
PD-Box with Fractal Points V1 (by Jonny86FXPro)PD-Box with Fractal Points V1 (by Jonny86FXPro)
This indicator has several functions:
Premium/Discount Box: The two most recent fractal highs and lows form a premium/discount box that provides valuable information about potential price movements.
Fractal Breaker Lines: Two fractal breaker lines are integrated for the high and low points to better visually represent the break of a fractal point.
Customizable: The genius of this indicator is that you can customize everything to your own needs. Whether you want to display lines, or change the colors of the box or lines, everything is possible.
Automatic Adjustment: Once a fractal point is broken, the premium discount automatically adjusts to the current price. Once a new fractal point is formed, the box is automatically adjusted again.
HTF Analysis: Use this indicator for your HTF analysis and determine in which direction the price could develop.
Premium Discount Box Information: When the price is in the premium range, there is a higher probability of a sell-off. However, if the price breaks upward, there is a good chance that it will continue to rise. The opposite is true for the discount range.
Power Behind Each Move: It is important how the price hits the fractal point. If there is power behind each move, the chances are very good that it will continue in that direction. If there is no real power behind it, it could be an indication of a trend reversal.
Weak Breaks: In the premium range, a weak upward break could lead to a bearish move, and in the discount range, a weak downward break through the fractal low point could lead to a move in the bullish direction.
As you can see, this powerful indicator has many functions that can help you determine trend direction and potential price movements.
Quick overview of functions:
Designed for higher timeframes such as 4H chart.
Identifies the last two fractal highs and lows to create a premium/discount box.
Includes two fractal breaker lines for the high and low points to better visually represent fractal breaks.
Customizable to fit individual needs, including the ability to show/hide lines and change box/line colors.
Automatically adjusts premium/discount levels to current price when a fractal point is broken.
Can be used for higher timeframe analysis to determine potential price direction.
Premium/discount box provides insight into potential market direction based on price movement within its range.
Fractal break with strong market momentum indicates a higher chance of trend continuation.
Fractal break with weak market momentum may suggest a potential trend reversal.
A powerful indicator that can greatly assist in determining trend direction.
HTF Candles: 3x Multi-Timeframe Candle Boxes #Pip-Whisperer
- Modify 3 Timeframes to display Candle Boxes over your Chart
- Thats it.
- Enjoy!
- If anyone implements candlestick pattern detection to this before me, please send me link, that would be sick!

HTF CandlesThis Indicator overlay candles from a timeframe input.
Use it to see Higher Time candles on your current chart
Heikin ashi optionnal

[VDB]HTF-Momentum-SpeedThis script is for plotting momentum and speed of higher timeframe using MACD Histograms.
Settings are hardcoded to 35/70/20 for momentum while speeds change slow length to 100, 200 and 300.
There is an option to use the user defined higher timeframe is case auto selection is inappropriate.
DISCLAIMER: This indicator has been created for educational reference only and do not constitute investment advice. This indicator should not be relied upon as a substitute for extensive independent market research before making your actual trading decisions. Market data or any other content is subject to change at any time without notice. Liability for any loss or damage, including without limitation any loss of profit, which may arise directly or indirectly from use of this indicator is accountability of user using it.

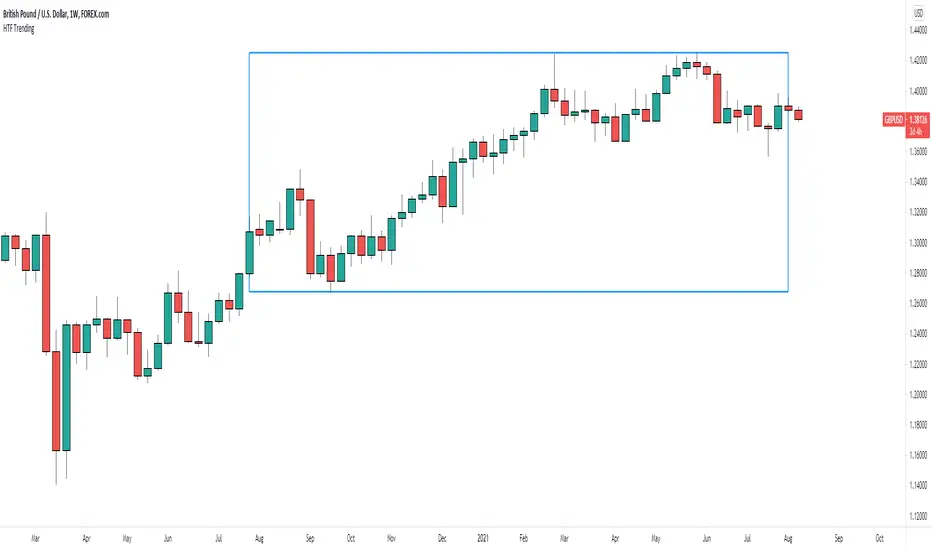
HTF Trending AnalysisThis is a very simple tool I created for historical analysis. Its intent is to simply draw a box from the current date to a month/year that you specify. Maybe you will have some other uses for it
Fair Value Gap / FVG - HTF Orderflow bias / trendCalculates Fair Value Gap (FVG) as a counter and plots it below price.
FVG Counter value resets to +ve or -ve once the FVG counter reverses direction.
Use this script to find a bias to trade with.
Best used on HTF (like 1W, 1D), so the bias can be transferred to LTF (like 4H, 1H).
If you end up using this script, please leave a comment below on how you used it. I can try to incorporate those ideas in an update.
Cheers!

Buy/Sell Volume confirmation for BO_Entry_ExitThis script helps to identify the volume strength basis EMA and various EMA multipliers, There are provisions provided to enable and disable when the volume is gaining momentum and the volume for a particular candle touches the Break Out criteria. Users will be able to modify the criteria for Volume strength and Volume break out Indication. It will also show the buyers & sellers strength of a volume bar which the uses will be able to enable and disable.
HTF Candlestick Patterns [TradingView] vX by DGTCandlesticks are graphical representations of price movements for a given period of time. They are commonly formed by the opening, high, low, and closing prices of a financial instrument. They have their origins in the centuries-old Japanese rice trade and have made their way into modern day price charting.
It’s important to note that candlestick patterns aren’t necessarily a buy or sell signal by themselves. They are instead a way to look at market structure and a potential indication of an upcoming opportunity. It is always useful to look at candlestick patterns in context like any other market analysis tool and candlestick patterns are most useful when used in combination with other techniques. There are countless candlestick patterns that traders can use to identify areas of interest on a chart, where some candlestick patterns may provide insights into the balance between buyers and sellers, others may indicate a reversal, continuation, or indecision.
Reversal patterns are quite useful when used in context. Reversal patterns should form at the bottom of a downtrend or at the top of an uptrend. Otherwise, they are not a reversal patterns, but continuation patterns. Most reversal patterns require confirmation such as price move in the direction of reversal accompanied by appropriate trading volume. The reversal patterns can further be confirmed through other means of traditional technical analysis—like trend lines, momentum, oscillators, or volume indicators—to reaffirm buying or selling pressure. The patterns themselves do not guarantee that the trend will reverse. Investors should always confirm reversal by the subsequent price action before initiating a trade.
This study implements some of the most commonly used candlestick patterns in a context with directional movement indicator. On request users can adjust the strong trend threshold from dialog box, eighter can disabled correlation with directional movement indicator. To add additional sight to analysis the simple moving averages of 20, 50, 100 and 200 periods are added (configurable)
You may add additional indicators of your choice. Colored DMI, BB Cloud or Price Distance to its MAs may help
Enjoy it!
Disclaimer: The script is for informational and educational purposes only. Use of the script does not constitutes professional and/or financial advice. You alone the sole responsibility of evaluating the script output and risks associated with the use of the script. In exchange for using the script, you agree not to hold dgtrd tradingview user liable for any possible claim for damages arising from any decision you make based on use of the script
