Momentum + Heatmap with RSI Cross (Nikko)📘 User Manual: Momentum + Heatmap with RSI Cross (Nikko)
Version: 1.0
Author: Cryptonikkoid
Platform: TradingView – Pine Script v6
License: Mozilla Public License 2.0
Release Date: June 2025
🔍 Overview
The Momentum + Heatmap with RSI Cross is an advanced visual indicator designed to replace traditional oscillators by merging multiple indicators into one. It blends Vortex, Stochastic, RSI, and MACD into a unified, mathematically enhanced momentum signal. This tool highlights trend shifts, potential reversals, and momentum build-up with intuitive visuals and alert signals.
The indicator includes:
A hybrid oscillator reflecting directional strength and momentum.
A heatmap background representing RSI × Vortex energy.
Buy/Sell triangle alerts based on RSI-style crossovers.
A clean layout optimized for decision-making speed.
⚙️ How It Works
Vortex Strength
The indicator computes Vortex Positive (VI+) and Vortex Negative (VI–) over a user-defined period.
The difference between the two creates a directional bias signal (viDiff).
Stochastic Momentum
The viDiff value is normalized through a stochastic oscillator, producing smoothed %K and %D curves.
These curves serve as the base for momentum signals.
RSI and Long-Term RSI
The RSI is computed and normalized to a 0–1 scale.
A long-term RSI (5× period) is also calculated to act as a trend anchor.
MACD Filtering
A MACD calculation determines whether the market is in a bullish or bearish condition.
The hybrid signals are flipped accordingly to follow the broader trend.
Hybrid Oscillator Construction
%K and %D are multiplied by exponential factors of RSI and long RSI.
This adds acceleration to the signals when momentum is increasing rapidly.
RSI Cross Detection
When the hybrid %K crosses above hybrid %D, a Sell triangle appears (potential peak).
When it crosses below, a Buy triangle appears (momentum reversal).
Heatmap Background
A visual background shows the interaction between Vortex and RSI energy.
Colors shift from deep purple (low momentum) to blue (strong bullish energy).
The heatmap can be toggled on/off for clarity.
Alerts
Built-in alert conditions allow you to be notified instantly on buy/sell signals.
🧠 How to Use
Apply the Indicator
Add it to any chart on TradingView.
It works best on trending assets and volatile conditions like crypto or indices.
Read the Hybrid Oscillator
Use the hybrid %K and %D like a momentum wave.
Strong upward waves + a green heatmap = potential long.
Sharp downward spikes + fading heatmap = caution or potential exit.
Watch the Triangles
A green triangle below a bar suggests a buy signal — momentum is reversing upward.
A red triangle above a bar signals momentum exhaustion — potential sell or take profit.
Heatmap Guidance
When the background is faint or fades to purple, it indicates weak conditions.
Blueish tones signal growing bullish strength.
Use with Price Action
Combine triangle alerts with support/resistance, price structure, or volume.
This indicator is not a standalone entry tool, but a strong directional filter.
✅ Benefits
Single Indicator Solution: Replaces multiple tools like MACD, RSI, and Stochastic.
Momentum + Trend Fusion: Combines short-term reversals with long-term trend confirmation.
Visual Simplicity: Clear oscillator waves, triangle icons, and color-coded heatmaps reduce decision fatigue.
Built-in Alerts: Get notified the moment momentum shifts.
Customizable: You can tweak lengths and smoothing for your asset and timeframe.
⚠️ Limitations
Slight Lag: Smoothing adds stability but can delay signals by a few candles.
Whipsaw in Sideways Markets: Like all momentum tools, performance is better in trending conditions.
Requires Confirmation: Best used with other tools like structure or volume to confirm trades.
Experimental Math: This is an experimental formulation; more feedback could help fine-tune signal logic.
🔁 What's New Compared to Traditional Indicators
Unlike using RSI, MACD, or Stochastic separately, this indicator:
Integrates all three into a unified momentum model.
Adds long-term RSI filtering to reduce noise.
Uses exponential scaling to enhance signal acceleration.
Features heatmap visualization to intuitively show energy buildup.
Provides actionable visual alerts without relying solely on numeric values.
🛠️ Tips and Customization
Adjust the rsiLength, viLength, and MACD settings for different markets (e.g. faster for scalping, slower for swing).
Toggle off the heatmap if you prefer a cleaner look using the checkbox.
Use higher timeframes (4h, 1D) for swing trading or lower timeframes (15m–1h) for intraday.
Combine with volume spikes or trendlines to enhance trade confirmation.
Add alertcondition() messages to trigger webhook or mobile alerts.
🎯 Final Thoughts
Momentum + Heatmap with RSI Cross simplifies the complexity of momentum analysis into a smooth, visually intuitive signal. It helps identify entry zones early, avoid chasing reversals blindly, and gives clear exit alerts based on dynamic crossovers.
If you want cleaner charts with smarter momentum tracking — this tool is built for that.
Hybrid

TradFi Fundamentals: Momentum Trading with Macroeconomic DataIntroduction
This indicator combines traditional price momentum with key macroeconomic data. By retrieving GDP, inflation, unemployment, and interest rates using security calls, the script automatically adapts to the latest economic data. The goal is to blend technical analysis with fundamental insights to generate a more robust momentum signal.
Original Research Paper by Mohit Apte, B. Tech Scholar, Department of Computer Science and Engineering, COEP Technological University, Pune, India
Link to paper
Explanation
Price Momentum Calculation:
The indicator computes price momentum as the percentage change in price over a configurable lookback period (default is 50 days). This raw momentum is then normalized using a rolling simple moving average and standard deviation over a defined period (default 200 days) to ensure comparability with the economic indicators.
Fetching and Normalizing Economic Data:
Instead of manually inputting economic values, the script uses TradingView’s security function to retrieve:
GDP from ticker "GDP"
Inflation (CPI) from ticker "USCCPI"
Unemployment rate from ticker "UNRATE"
Interest rates from ticker "USINTR"
Each series is normalized over a configurable normalization period (default 200 days) by subtracting its moving average and dividing by its standard deviation. This standardization converts each economic indicator into a z-score for direct integration into the momentum score.
Combined Momentum Score:
The normalized price momentum and economic indicators are each multiplied by user-defined weights (default: 50% price momentum, 20% GDP, and 10% each for inflation, unemployment, and interest rates). The weighted components are then summed to form a comprehensive momentum score. A horizontal zero line is plotted for reference.
Trading Signals:
Buy signals are generated when the combined momentum score crosses above zero, and sell signals occur when it crosses below zero. Visual markers are added to the chart to assist with trade timing, and alert conditions are provided for automated notifications.
Settings
Price Momentum Lookback: Defines the period (in days) used to compute the raw price momentum.
Normalization Period for Price Momentum: Sets the window over which the price momentum is normalized.
Normalization Period for Economic Data: Sets the window over which each macroeconomic series is normalized.
Weights: Adjust the influence of each component (price momentum, GDP, inflation, unemployment, and interest rate) on the overall momentum score.
Conclusion
This implementation leverages TradingView’s economic data feeds to integrate real-time macroeconomic data into a momentum trading strategy. By normalizing and weighting both technical and economic inputs, the indicator offers traders a more holistic view of market conditions. The enhanced momentum signal provides additional context to traditional momentum analysis, potentially leading to more informed trading decisions and improved risk management.
The next script I release will be an improved version of this that I have added my own flavor to, improving the signals.

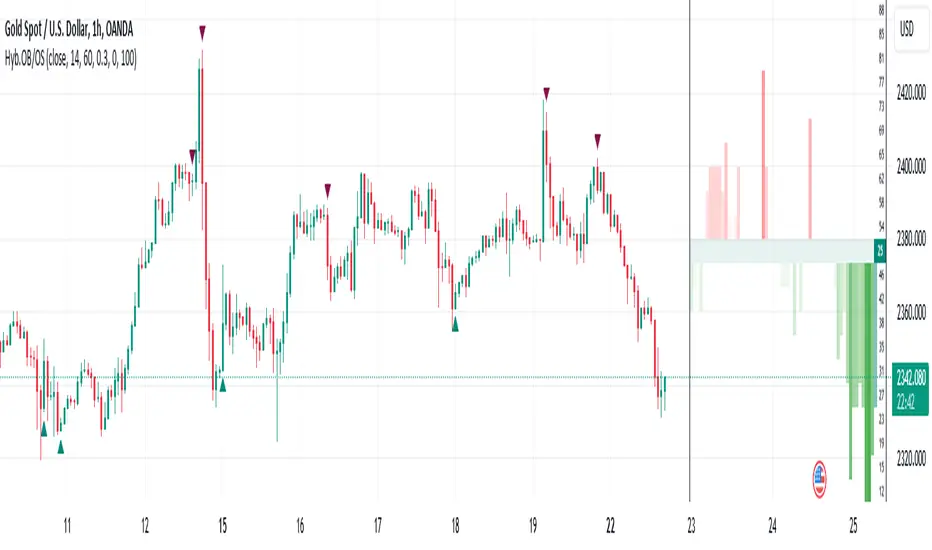
Hybrid Overbought/Oversold OverlayIntroduction
This is a new representation of my well-known oscillator Hybrid Overbought/Oversold Detector overlaid on the chart. The script utilizes the following 12 different oscillators to bring forth a new indicator which I call it Hybrid OB/OS .
Utilized Oscillators
The utilized oscillators here are:
Bollinger Bands %B
Chaikin Money Flow (CMF)
Chande Momentum Oscillator (CMO)
Commodity Channel Index (CCI)
Disparity Index (DIX)
Keltner Channel %K
Money Flow Index (MFI)
Rate Of Change (ROC)
Relative Strength Index (RSI)
Relative Vigor Index (RVI/RVGI)
Stochastic
Twiggs Money Flow (TMF)
The challenging part of utilizing mentioned oscillators was that some of their formulas range are not similar and some of them does not have a mathematical range at all. So I used a normalization function to normalize all their output values to (0, 100) interval.
Overbought/Oversold Levels Calculation
I noticed that the levels which considered as OB/OS level by various traders for each of the utilized oscillators are so different, e.g., many traders consider 30 as OS level and 70 as OB level for RSI and some others take 20 and 80 as the levels, or some traders consider 20 and 80 as OS/OB levels for Stochastic oscillator. Also these levels could be different on different assets, e.g., OB/OS levels for CCI on EURUSD chart might be 80 and 20 while the levels on BTCUSDT chart might be 75 and 25, and so on.
So I decided to make a routine to automate the calculation of these levels using historical data. By this feature, my indicator would calculate the corresponding levels for the oscillators on current chart and then decide about the overbought/oversold situation of each one, which leads to a more accurate Hybrid OB/OS indication.
As the result, if all 12 individual oscillators say it's overbought/oversold, the Hybrid OB/OS shows 100% overbought/oversold, vice versa, if none of them say it's overbought/oversold, the Hybrid OB/OS shows 0, and so on.
The Overlaying Oscillator Problem!
A programming-related challenge here was that Pine Script assigns two separate spaces to the oscillators and the overlaid indicators, and the programmers are limited to use just one of them in each of their codes.
Knowing this, I was forced to simulate the oscillator space on the chart and display my oscillator as a diagram somehow. Of course it won't be as nice as the oscillator itself, because the relation between the main chart bars and the oscillator bars could not be obtained, but it's better than nothing!
Settings and Usage
The indicator settings contain some options about the calculations, the diagram display and the signals appearance. By default they are fine, but you could change them as you prefer.
This indicator is better to be used alongside other indicators as a confirmation (specially in counter-trend strategies I believe). Also it generates an external signal which you could use it in your own designed indicators as well.
Feel free to test it and also the former form of the Hybrid OB/OS . Good Luck!
RSI TrendRSI Hull Trend is a hybrid indicator with RSI of HULL Signal. The Hull MA is combined with RSI to see if the Hull MA Buy/Sell Signal is in overbought or oversold condition. Buy Sell Signals are plotted based on settings of OB/OS or RSI. This indicator is very useful to see if the Trend is in Exhaustion or Beginning of a Trend. Entry and Exit conditions can be more precise based on OB/OS condition of price action. In addition normal RSI trend is plotted with trend color from Hull MA. Best Performance with Heiken Ashi Candles.
OB/OS Settings provided
Hull Buy/Sell Signals plotted
Double RSI FAST and DEFAULT signal with crossover
Bar Color applied based on Hull RSI Trend
Hull Trend + RSI + Price Action

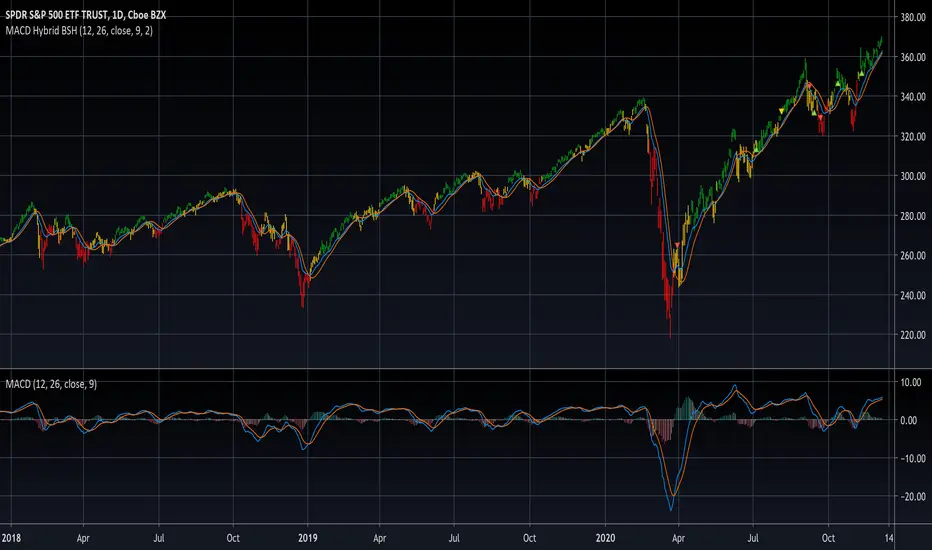
MACD Hybrid BSHMACD = Moving Average Convergence and Divergence
Hybrid = Combining the two main MACD signals into one indicator
BSH = Buy Sell Hold
This indicator looks for a crossover of the MACD moving averages (12ema and 26ema) in order to generate a buy/sell signal and a crossover of the MACD line (12ema minus 26ema) and MACD signal line (9ema of MACD line) in order to generate a completely seperate buy/sell signal. The two buy/sell signals are combined into a hybrid buy/sell/hold indicator which looks for one, neither, or both signals to be "buys." If both signals are buys (fast crossed above slow), a "buy" signal is given (green bar color). If only one signal is a buy, a "hold" signal is given (yellow bar color). If neither signal is a buy, a "sell" signal is given (red bar color). Note: MACD moving averages crossing over is the same thing as the MACD line crossing the zero level in the MACD indicator.
It makes sense to have the MACD indicator loaded as a reference when using this but it isn't required. The lines plotted on the chart are the 12ema and a signal line which is the MACD signal line shown relative to the 12ema rather than the MACD line. The 26ema is not plotted on the chart because the chart becomes cluttered, plus the moving averages crossing over is indicated with the MACD indicator.
This indicator should be used with other indicators such as ATR (1), RSI (14), Bollinger bands (20, 2), etc. in order to determine the best course of action when a signal is given. One way to use this as a strict system is to take a neutral cash position when a yellow "hold" signal is given, to go long when a
green "buy" signal is given, and to go short when a red "sell" signal is given. It can be observed that for many tickers and timeframes that green-yellow-green and red-yellow-red sequences are stronger signals than green-yellow-red and red-yellow-green signals.
Note: Chart type must be "bars" in order for the bar colorization to work properly
Dividend Valuation [DDM] display liked Support/Resistance Zone
This Indicator will show you a horizontal line of the stock valuation with the DDM method.
The DDM method is so much simple which has a formula:
Price = EPS * DividendPayout / %Yield
In this case,
-I set the default for Dividend Payout = 40.
This number I refer to from my Research that a lot of stock with have some potential of growth usually has payout around 40% from EPS.
And so far the Payout ratio can use to the term of "Margin of Safety" too, You can set this value to what safety you want.
-The EPS, This value I get from a script that already has in Trading View. And I set it for the TTM version.
-The %Yield, I have 3 lines that you can adapt form the yield that you want.
From this horizontal lines of dividend yield, I hope it can use to be like the Resistance and Support line that guides you to buy or sell a stock you want. And can adapt to your Hybrid Style.
Hope this indicator will help you, May good health to be you :)
------------------------------------------------------------------------------------------------------------------------------------------------------------
สวัสดีมิตรสหายเทรดเดอร์ชาวไทยทุกท่าน
วันนี้ผมได้ลองเขียนอินดิเคเตอร์ตัวหนึ่ง ที่จะแสดงค่าออกมาเป็นเส้นแนวนอน ที่สะท้อนค่า Valuation แบบ DDM ออกมานะครับ
การประเมิน Valuation แบบ DDM นั้น เป็น 1 ในวิธีประเมินค่าหุ้นที่แอบง่ายอยู่ระดับหนึ่งเลย โดยใช้ตัวชี้วัดเพียงอย่างเดียว นั่นคือ "เงินปันผล" ที่ท่านจะได้
ผมเชื่อว่ามีมิตรสหายหลายท่านที่เข้ามาในตลาด ย่อมหวังผลตอบแทนในรูปแบบเงินปันผล ซึ่งจะเปรียบเสมือน Passive Income ที่ส่งเงินให้ท่านทุกปีๆ ไม่ต้องมานั่งเครียดที่หน้าจอ ดูกราฟทุกวี่วัน ลงทุนกับบริษัท ลงทุนกับระบบ ให้เขาทำงานให้กับเราเป็นต้น
ทั้งหลายนี้จึงเป็นที่มาในการเขียนอินดิเคเตอร์นี้ขึ้นมาครับ
อินดิเคเตอร์นี้เรียบง่ายมาก เพียงแค่ท่านใส่ตัวแปรไปแค่ 3-4 ตัวแปรเท่านั้น
ตัวแปรแรกคือ ใส่อัตราการจ่ายปันผล หรือ Dividend Payout
ค่านี้เแสดงถึงว่า หุ้น 1 ตัว เมื่อได้กำไรสุทธิรายปีแล้ว ( EPS ) เขาจะจ่ายอออกมาในสัดส่วนเท่าไรจากกำไรสุทธิพวกนั้น โดยมีระดับตั้งแต่ 1-100 %
โดยมากแล้ว จากที่ผมได้ทำการวิจัยส่วนตัว พบว่าหุ้นส่วนมากใน SET100 และอื่นๆ มักจ่ายปันผลออกมาในระดับ 40% อันเป็นค่าที่ผมตั้งไว้เป็น Default
นอกจากนี้แล้วการตั้ง Dividend Payout ไว้ในระดับที่ต่ำ อาจเป็นการตั้ง Margin of Safe ty ที่ไม่เลวด้วยนั่นเองครับ
ตัวแปรอีก 3 ตัวที่เหลือ จะเป็นตัวเลือกของ % เงินปันผล
ซึ่งท่านสามารถเลือกเงินปันผลที่ท่านด้วยการได้เลยครับ โดยค่าที่ผมตั้งไว้นั้นจะอยู่ระหว่าง 2-4% ท่านสามารถปรับเปลี่ยนได้
ซึ่งเป็นค่าที่อยู่ในระดับกลางๆ สำหรับการลงทุนแบบ Value Investing เลยครับ (แต่ทั้งนี้ทั้งนั้น ท่านสามารถศึกษาศาสตร์นี้ได้จากหนังสือหลายเล่มเลยครับ)
หลังจากใส่ค่าตัวแปรทั้งหมดแล้ว ค่าที่แสดงในกราฟ ก็จะเป็นเส้นตรงแนวตั้ง 3 เส้น ที่เปรียบเสมือนแนวรับแนวต้านให้ท่านได้ทำกลยุทธ์ ไม่ว่าจะวาง Risk Reward Ratio หรือจะเก็บสะสมหุ้นก็แล้วแต่ท่านเลย
ทั้งนี้ทั้งนั้นแล้ว ผมหวังว่าอินดิเคเตอร์นี้ จะทำให้ท่านที่เป็นนักลงทุนสาย Hybrid มีความสุขในการปรับใช้นะครับ
หวังว่าท่านจะชอบอินดิเคเตอร์นี้ ไม่มาก ก็น้อย และเป็นสะพานเชื่อมให้กับเทรดเดอร์สายกราฟเทคนิคสามารถคุยกับเทรดเดอร์สายพื้นฐานจ๋าๆ ผ่าน Assumption ของวิธีการประเมินมูลค่าหุ้นโดยใช้เงินปันผล หรือ DDM กันนะครับ
ขอให้มิตรสหายเทรดเดอร์ทุกท่าน
รักษาสุขภาพให้แข็งแรงปลอดภัย
มีสุขภาพแข็งแรงครับ :)

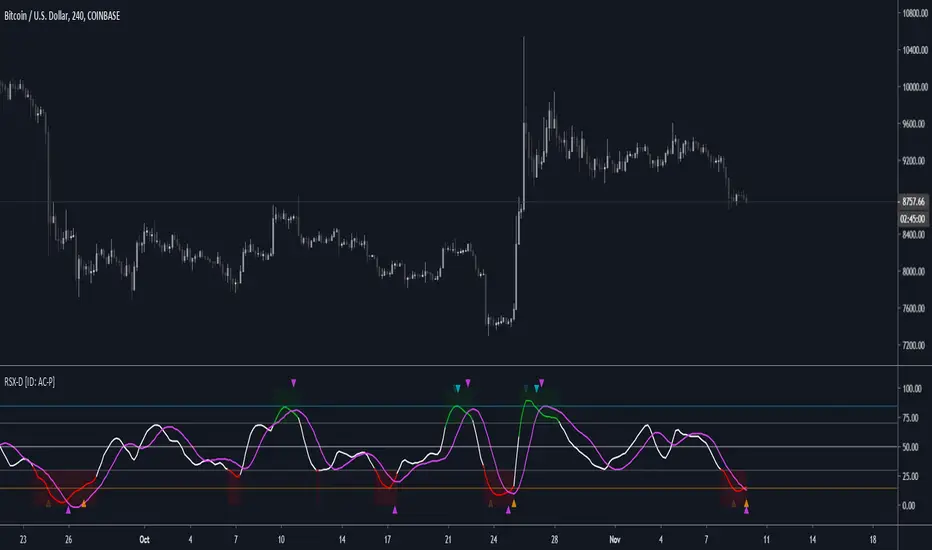
RSX-D [ID: AC-P]The "AC-P" version of Jaggedsoft's RSX Divergence and Everget's RSX script is my personal customized version of RSX with the following additions and modifications:
LSMA-D line that averages in three LSMA components to form a composite, the LSMA-D line. Offset for the LSMA-D line is set to -2 to offset latency from averaging togther the LSMA components to form a composite - recommended to adjust to your timeframe and asset/pair accordingly.
Divergence component from JustUncle, RicardoSantos, and Neobutane divergence scripts
Crossover indication and alerts for Midline, and custom M1 and M2 levels for both RSX and the LSMA-D line from Daveatt's CCI Stochastic Script
EMA21/55 zone cross highlighting option
SMA9/EMA45 MA option from my RSI sma/ema Cu script
Libertus Divergences and Pivot labels from Jaggedsoft's RSX Divergence script are hidden/off by default
Designed for darkmode by default. Minor visual changes from Jaggedsoft's and Everget's script(s) for darkmode and visual aesthetic.
Please Note:
Divergences that use fractal-based detection logic, offset, or a combination of both generally have a 1-2 bar/candle lag. This is an INHERENT limitation of divergence detection with fractals and offsets. Divergences generally will have a higher strikerate on HTF than LTF due to the 1-2 bar lag. While I'm not going to rule out a programming solution or math construct/formula that attempts to alleivates the 1-2 bar lag for divergences, this script is not it - please keep that in mind when using divergence components with a fractal base and offset.
LSMA-D is a composite of three LSMA lines, all with offset options. Different lengths and Offset values can compensate/adjust for the smoothing/latency from RSX, but only up to a certain point. For each LSMA, the least square regression line is calculated for the previous time periods, so the idea is that with finely tuned adjustments, you can get crossover/crossunder signals from the RSX with the LSMA-D line that you simply can't get with the SMA9/EMA45 due to the already smoothed RSX.
The defaults for the RSX and various components for the LSMA-D here will MOSTLY LIKELY NOT WORK OR BE APPLICABLE to every timeframe and asset that you trade - adjust, backtest, and test accordingly. The defaults are here are MEANT to be adjusted to the asset class and timeframe that you are trading.
If you're not familiar with the LSMA, tradingview author Alexgrover has a few great scripts that go into detail how the LSMA works, in addition to different interpretations and implementations of the LSMA.
References/Acknowledgements:
//@version=4
// Copyright (c) 2019-present, Alex Orekhov (everget)
// Jurik RSX script may be freely distributed under the MIT license.
//
//-------------------------------------------------------------------
// Acknowledgements:
//---- Base script:
// RSX Divergence — SharkCIA by Jaggedsoft
//
// Jurik Moving Average by Everget
//
//---- Divergences/Signals:
// Libertus RSI Divergences
//
// Price Divergence Dectector V3 by JustUncle
//
// Price Divergence Detector V2 by RicardoSantos
//
// Stochastic RSI with Divergences by Neobutane
//
// CCI Stochastic by Daveatt
//
//---- Misc. Reference:
// RSI SMA/EMA Cu by Auroagwei
//
// CBCI Cu by Auroagwei
//
// Chop and explode by fhenry0331
//
// T-Step LSMA by RafaelZioni
//
// Scripts by Jaggedsoft for structure and formatting
// Scripts by Everget for structure and formatting
//-------------------------------------------------------------------
// RSX-D v08
// Author: Auroagwei
// www.tradingview.com
//-------------------------------------------------------------------
Function : Stochastic Money Flow IndexThis function is similar to the stochastic rsi function.
The only difference is that Money Flow Index is used instead of rsi.
Oversold and overbought values were changed to 80 and 20.
Because the MFI's overbought and overbought zones are 20 and 80.
In MFI, I think that it can be more beneficial in liquid markets than stochastic rsi since volume is taken into account in contrast to RSI.
Regards.

[AU] Waves+ Waves+ v0R7b
Plus version of Waves with components from both Waves Advanced and Mnemosyne. Essentially, Waves+ is highly configurable hybrid wavetrend oscillator and Fibonacci oscillator.
Slow wavetrend component replaced by Follower/Base from Mnemosyne indicator
TTM Squeeze Loose/Strict + Explosion Zones now enabled by default
Extreme Caution Fast Wavetrend Line, Fast wavetrend and Extreme Caution Fast WT cross signal now available
Disabled/removed to speed up script performance and load time: Divergence component, stoch k crossovers, T1 signals. Draw objects reduced from 89 to 64 to conform to Pinescript v4 requirements.
Large inactive code blocks stripped/removed to speed up performance and load time

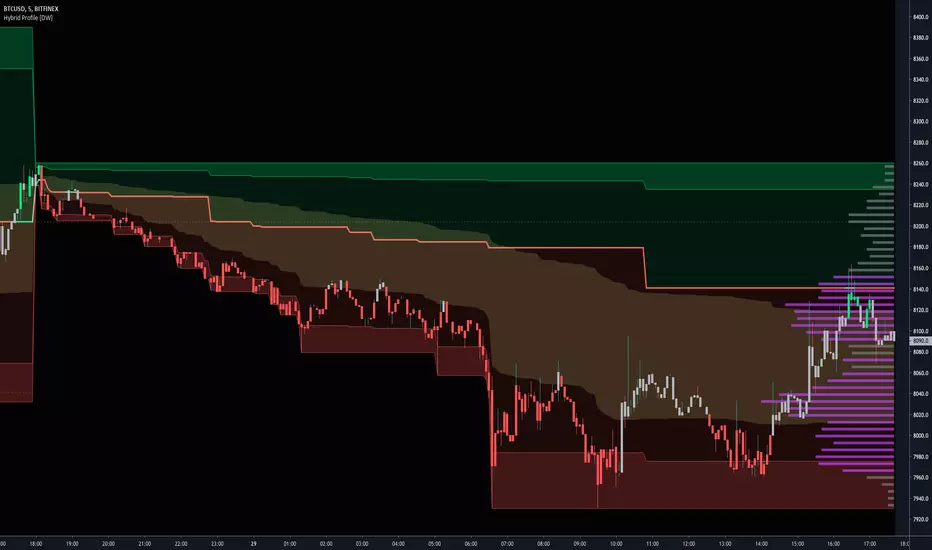
Hybrid Profile [DW]This is an experimental study inspired by J. Peter Steidlmayer's Market Profile tool with an alternative set of calculations for analyzing price action and distribution over a defined interval.
This tool is geared toward finding price reactive points for better entry and exit positions.
In this script, price range over a user defined interval (up to 4000 bars) is divided into 50 sections, then TPOs are counted for each section to generate the distribution histogram. Histogram lines are calculated in real time, and recalculate on each new bar.
Areas of significance are displayed as purple lines in the histogram, making it incredibly simple to identify levels that price will likely react to. The significance sensitivity can be manually adjusted for desired output.
Rather than using POC, I created a series of proprietary calculations to generate what I call the Point Of Focus (POF). This line is similar to POC, but does not always follow the highest count in the distribution.
The POF is designed to experience less whipsaws than POC, which makes trading using the POF much simpler since its value is more consistent. On historical data, price has shown to either revert to or launch from the POF rather frequently.
Unlike a conventional Market Profile, this profile doesn't have a "value area". Instead it has a Mean Value Zone, which is calculated using a series of custom VWAP calculations. The output is similar to VA, but much smoother.
This script has a built in tick volume substitution for charts with no real volume data, making all elements of the script compatible with any cryptocurrency, stock, currency pair, or index you want to analyze.
A bar color scheme is included within this script which can be used to help determine dominant trend and local extremes of the interval.
This tool is not necessarily better or worse than the classic Market Profile, nor is it a replacement for Volume Profile.
However, this is a powerful alternative that can both simplify and improve your technical analysis.