CryptoPeep Renko StrategyIf you would like to be kept upto date please follow us and try our indicators and strategies here: uk.tradingview.com
This strategy is invite only. Please request an invite in comments below and if you like click the like button.
I-BTC

Cryptopeep Volume StrategyFinally a strategy based on volume with good results. Please let me know what you think in the comments below.
If you would like to be kept up to date please follow us and try our indicators and strategies here: uk.tradingview.com
If you agree with the above please like.


Long Term Swing Position Indicator Alpha VersionThis is a early version of a swing trading indicator I have been working on. It uses EMAs and ADX to find entries. This will eventually be integrated into my main trading indicator. The strategy is defaulted to start with 17,000 capital and trade with 100 percent of equity. You can test different ranges of dates by going into the settings and changing the end dates of the backtest. It is defaulted to test from 1/1/2018 to the current time. Keep in mind if you keep it set to use 100% equity it will not be able to enter positions if the initial capital is less than the price of 1 bitcoin -3.31% at the beginning of the test range. It currently has a pretty low success rate, but the average winning trade is significantly larger than the average losing trade so it still makes a significant profit. This has only been tested so far on the 15 minute and 30 minute charts for Bitfinex:BTCUSD.
The end goal for this indicator is to allow me to enter long term future positions to hold while I trade swaps on the short and medium term. This will allow me to increase profits.
This strategy will be changing significantly in the future as I test various ideas and setting configurations to maximize the effectiveness, but feel free to use it however you want.
My main indicator is currently in beta and will be finished before this one is completed, so if you want a solid indicator to trade with in the immediate future, I suggest checking that one out at
Please comment or direct message me if you have any questions of critiques, I will always respond within 24 hours. If you find out anything interesting while testing the strategy I would also appreciate it if you dropped me a message letting me know.

LSX: Mystery BTC strategy with 100% hit rateI said in the main crypto chat, that it was easy to create a BS strategy with a 100% profit rate, so here's the proof.
Looks awesome right? I can promise you, if you trade with this, it will sooner or later blow your account.
Keeping the inner workings of it a secret, just like the scammers do.
Why am I publishing this? To show why investing in these 'mystery strategies' is a terrible idea. That's also why I've hidden the code, so it looks more attractive than it really is.
Say safe, don't get scammed. Don't get rekt.

My Custom indicator & Strategy for trading BTC in 5min UTHello,
If your goal is to make some BTC, this script might be for you.
I tested it on the ETH/BTC Binance chart.
About the indicator :
In short, it will help you for several things :
Avoid losing BTC when the trend goes bearish.
Earn BTC during any bullish trend.
Earn BTC when the market is in trading range by bouncing off trend lines, while anticipating a new potential trend.
I based my algorithm on several technical tools such as volume, RSI, pivot, for a total of 6 boolean conditions mixed together with AND and OR gates, resulting in those entry points (shapes)
About the Strategy :
I only used long entries and exits. No shorting.
The commission rate is set to 0.05% (binance)
The backtesting results in only 40€ of net profit for a 1000€ inital capital, it may seem litle BUT during the testing period (18 days, 40 trades) the coin (ETH) dropped in BTC value ( -25% ). You make 4% while a simple Holder would lose -25%, which is 29% difference.
Since I worked hard on this script, I'll grant access to only those willing to make a small donation, that'd really help me reach my goal of making a living with trading. I will also give you any info you want and give you everything need to set up alerts. Thank you very much.

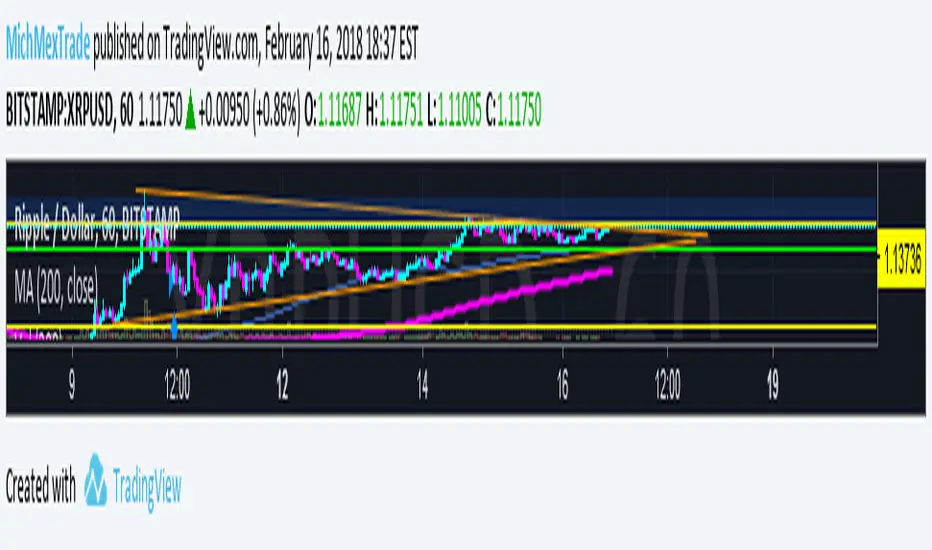
MA Cross CriptoEXLSimple Buy and Sell indicator for Cryuptos
Works way better:
XRPUSD - H1
BTCUSD - H4
ETHUSD - H4
With enough patience this indicator can make you good money!
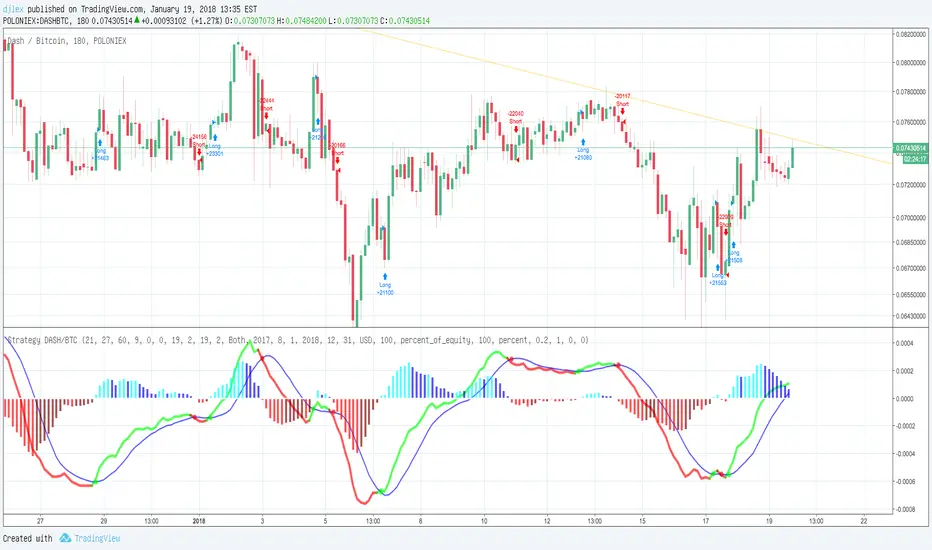
MACD Strategy V2.0 DASH/BTC 3H
MACD STRATEGY Calculate for DASH/BTC 3H with 100 Dollar and FEE? s (0.2%)
Autoview qualified Study Script
For Margin Trading (Poloniex)
ULTIMATE PINE INJECTOR V1.2 INSERT
MACD Created by user ChrisMoody
NO REPAINT
With Stopp Loss and Trailing Stopp and Backtest
6 Mon = 600%
Top/Bottom Strategy with advanced settingsRecommended for BTCUSD 4H.
-red arrow - sell (strong downtrend)
-purple arrow - week downtrend
-green arrow - buy (strong uptrend)
-blue arrow - week uptrend
-yellow - buy


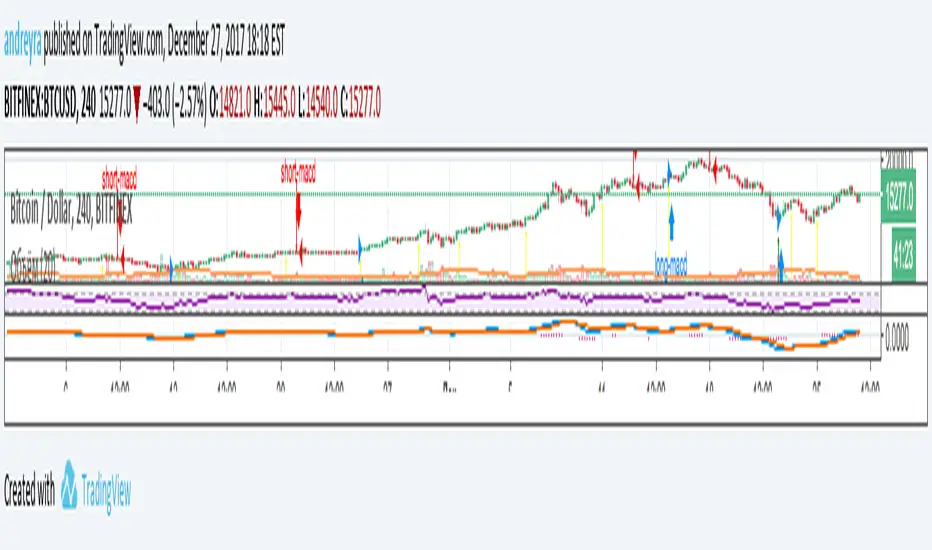
Andrey's Top/Bottom StrategyRecommended for BTCUSD -2.88% 4H.
-red arrow - sell (strong downtrend)
-purple arrow - week downtrend
-green arrow - buy (strong uptrend)
-blue arrow - week uptrend
-yellow - buy
The Love B♥tPrivate invite only script - currently "LIVE TESTING".
Back test results look great. Doesn't repaint. A lot of people might be saying, why use H.A. and all that and its not reliable etc.
The current testing you see of NEO is using 1% commission rate to account for the price difference and also the usual 0.25% commission rate.
Also, sometimes with H.A., you will buy lower than listed price or buy higher than listed price. However, with the testing I have done, it averages out.
I recommend using anywhere between 1-4 hour charts.
The strategy is using a combination of few different indicators along with moving averages.

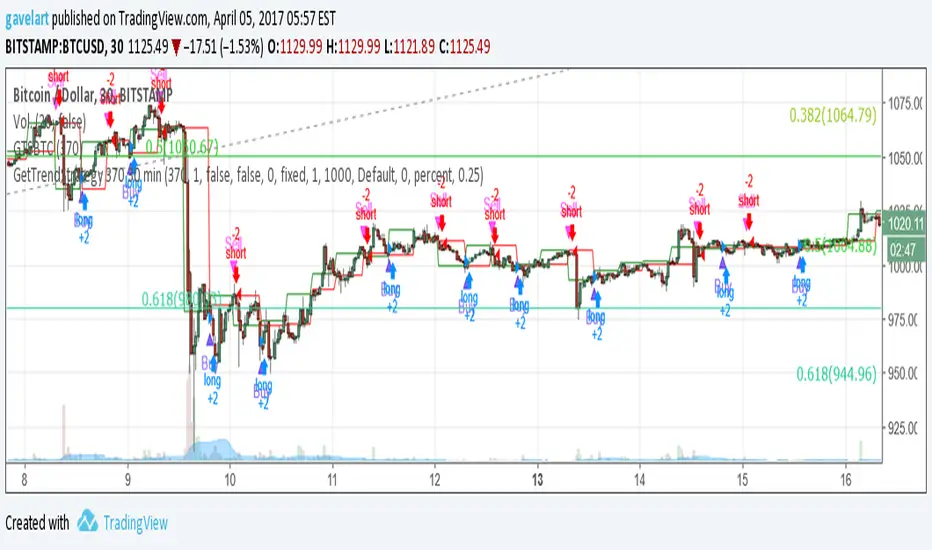
GetTrendStrategy 370 30 minModificación de la estrategia “GetTrendStrategy” optimizada para Bitcoin.
daily wickedness dha betabeta of an idea to catch tops and exit before drops on BTC using a custom wickedness factor.
strategy is only going long.
The strategy starts with 2014 and ends 2017.
Its main purpose is to survive a bear market like 2014 only trading longpositions without taking too much damage.

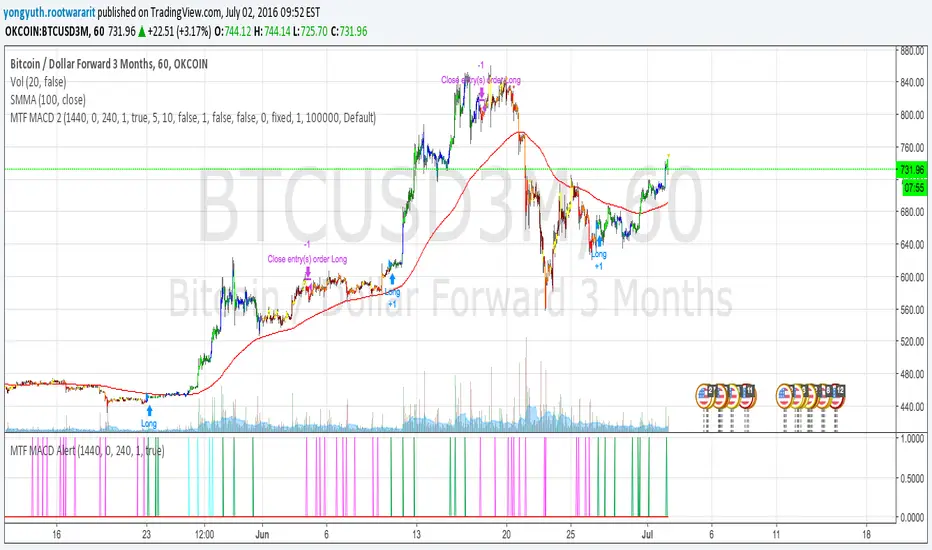
MTF MACD 2 By YuthavithiIf you want a good strategy without repaint. This one might be for you. Excellent profitable for BTCUSD3M for OKCoin.
It uses multiple time frame MACD for trading decision. To avoid repaint, set the delay period = 1 for both long term and midterm.
The idea is that, if long term, mid term and current time frame all agree on traidng direction, the trade will take place.
I also uses it in my automated trading bot with good result.
www.tradingview.com
MACDouble + RSI (rec. 15min-2hr intrv) Uses two sets of MACD plus an RSI to either long or short. All three indicators trigger buy/sell as one (ie it's not 'IF MACD1 OR MACD2 OR RSI > 1 = buy", its more like "IF 1 AND 2 AND RSI=buy", all 3 match required for trigger)
The MACD inputs should be tweaked depending on timeframe and what you are trading. If you are doing 1, 3, 5 min or real frequent trading then 21/44/20 and 32/66/29 or other high value MACDs should be considered. If you are doing longer intervals like 2, 3, 4hr then consider 9/19/9 and 21/44/20 for MACDs (experiment! I picked these example #s randomly).
Ideal usage for the MACD sets is to have MACD2 inputs at around 1.5x, 2x, or 3x MACD1's inputs.
Other settings to consider: try having fastlength1=macdlength1 and then (fastlength2 = macdlength2 - 2). Like 10/26/10 and 23/48/20. This seems to increase net profit since it is more likely to trigger before major price moves, but may decrease profitable trade %. Conversely, consider FL1=MCDL1 and FL2 = MCDL2 + (FL2 * 0.5). Example: 10/26/10 and 22/48/30 this can increase profitable trade %, though may cost some net profit.
Feel free to message me with suggestions or questions.

MACD, backtest 2015+ only, cut in half and doubledThis is only a slight modification to the existing "MACD Strategy" strategy plugin!
found the default MACD strategy to be lacking, although impressive for its simplicity. I added "year>2014" to the IF buy/sell conditions so it will only backtest from 2015 and beyond ** .
I also had a problem with the standard MACD trading late, per se. To that end I modified the inputs for fast/slow/signal to double. Example: my defaults are 10, 21, 10 so I put 20, 42, 20 in. This has the effect of making a 30min interval the same as 1 hour at 10,21,10. So if you want to backtest at 4hr, you would set your time interval to 2hr on the main chart. This is a handy way to make shorter time periods more useful even regardless of strategy/testing, since you can view 15min with alot less noise but a better response.
Used on BTCCNY OKcoin, with the chart set at 45 min (so really 90min in the strategy) this gave me a percent profitable of 42% and a profit factor of 1.998 on 189 trades.
Personally, I like to set the length/signals to 30,63,30. Meaning you need to triple the time, it allows for much better use of shorter time periods and the backtests are remarkably profitable. (i.e. 15min chart view = 45min on script, 30min= 1.5hr on script)
** If you want more specific time periods you need to try plugging in different bar values: replace "year" with "n" and "2014" with "5500". The bars are based on unix time I believe so you will need to play around with the number for n, with n being the numbers of bars.
