EMA ICHI BB [Rogulabo]3 indicators in 1.
Included Indicators are:
- EMA 8,13,21,55,100,200,450
- Ichimoku
- Bollinger Band
These can be used to determine changes in trends when:
- EMA's collide, trajectories shift, or certain levels are reached.
- Ichimoku cloud is above or below the candles.
- Bollinger Band's width changes, or range is broken.
Reasons for 3 in 1 assembly:
This indicator is intended to be used by students, and followers of Dan Takahashi
(a prominent educator of investing in Japan who is also a user of TradingView) .
Those who wants to use and learn with the same setup as Dan, would greatly benefit from this since,
the complex setting up process which can be a pain for beginners can be skipped with a simple click.
Every stylistic choice of color and placement were made to make it similar to the chart used by Dan.
Simple customizations are available such as:
- Changing color
- Changing the values
- Hide/show controls
Notes:
This is intended to be used alongside “STOCH RSI ” for the complete the setup.
Any questions, please refer to:
@rogulabo
==
高橋ダンさんが使用されてるチャートと同様のセットアップの為にご活用ください。
複数のインジケータをグループにしておりますので、無料版を使われてる方は効率よく使っていただけると思います。
また、“STOCH RSI ”どいうタイトルのインジケータも同時に公開しておりますので、セットアップを完成させたい方はこちらもご活用ください。
以下のインジケータを含みます。
・EMA線
・一目均等表
・ボリンジャーバンド
カスタマイズされたい方はご自由に値を変更ください。
ご質問は @rogulabo までよろしくお願いいたします。
一目均衡表

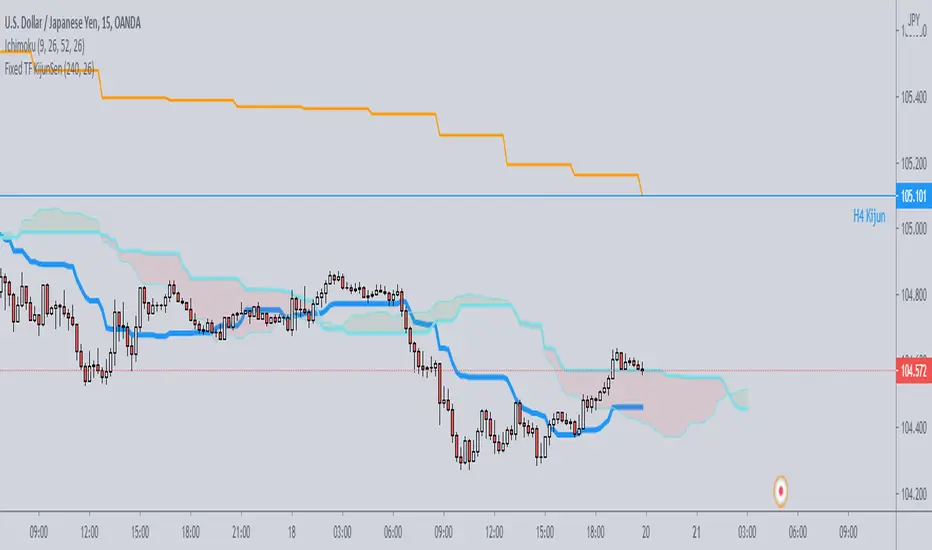
Fixed TF KijunSenJust a simple script which plots on any timeframe the kijunsen of a single specific timeframe, selectable by the user.
Useful for strategies which need to work on various timeframes, but need the kijun of that specific timeframe to be always visible for the analysis.
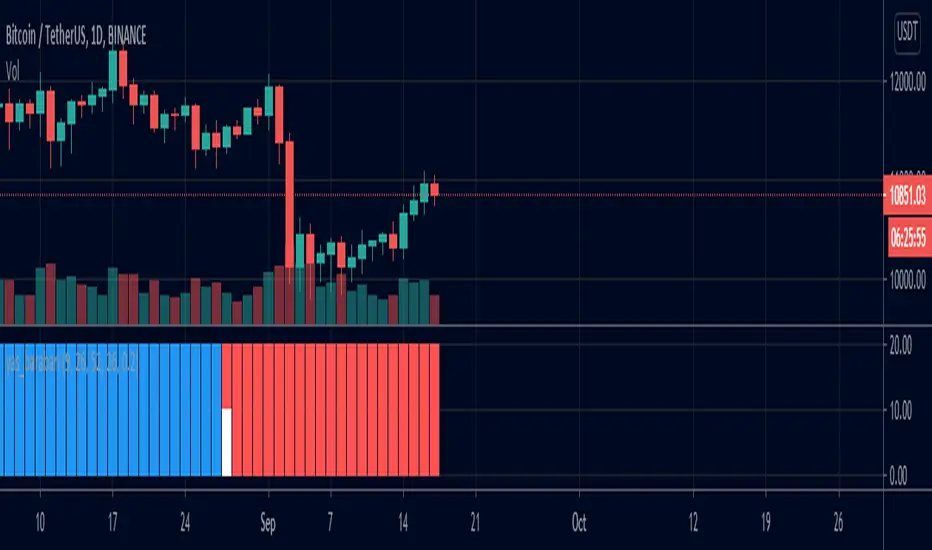
yas_barabariby this indicator u can find where the tenken-sen and kijen-sen is equal
yellow bar means the t/k is equal
red bar means tenken is under kijen-sen
blue bar means kijen is below tenken-sen
white bar on top means t+17 equal kijen-sen
Ichimoku Kinko Hyo and moreI am publishing my updated Ichimoku ++ study with a more suitable title. Future updates will take place with this version.
Description:
The intention of this script is to build/provide a kind of work station / work bench for analysing markets and especially Bitcoin . Another goal is to get maximum market information while maintaining a good chart overview. A chart overloaded with indicators is useless because the structure of the chart is more difficult to see. The chart should be clear and market structure should be easy to see. The script allows you to add indicators and signals in different visualizations to better assess the quality of signals and the sentiment of the market.
A general advise:
Use the included indicators and signals in a confluent way to get stoploss, buy and sell entry points. SR clusters can be identified for use in conjunction with Fractals and other indicators as entry and exit pints. My other scripts can also help. Prefer 4 hours, daily and a longer time frame. There is no "Holy Grail" :).

Adaptive IchimokuThis is part 10 of 11 in the system named Ninetales/Volt V2 you can find on Tradingview.
No. You may not add custom values, testing all the variables of Ichimoku is a giant pita. You can uncheck ones you dont like though.

[DN]DNKUMOThis script draws some of MA line with momentum bar on your chart.
These lines looks like ICHIMOKU. You could use this script like ICHIMOKU, I hope :-)

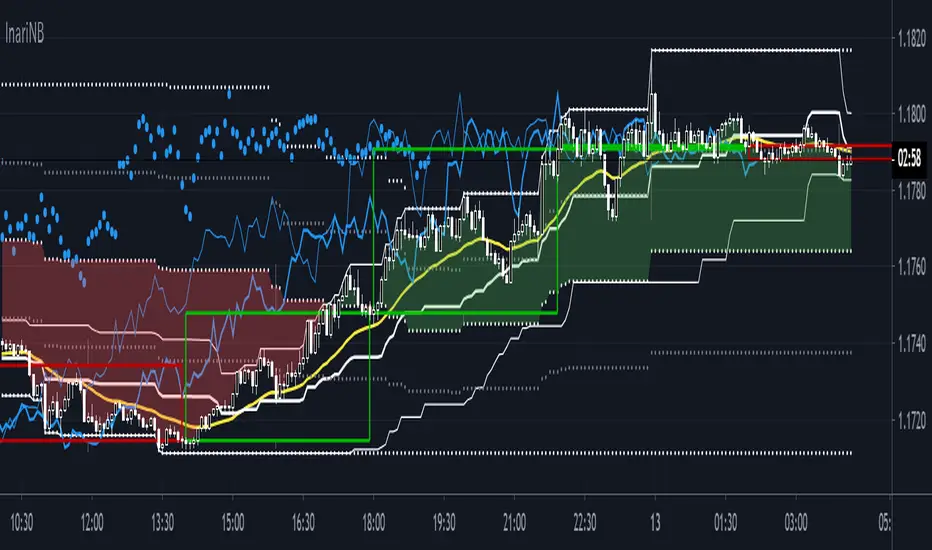
InariN CloudSInariN CloudS (INCS) is my custom model of InariN.
I usually use INCS in 300 ticks (other software) and 5 minutes charts for day trading.
Please read script "InariN simple" for basic usage.
I share background and fundamental ideas of day trading and INCS here.
I start with the practical conclusion and then explain INCS.
Maybe you'll notice that most indicators are unnecessary at the end of this text.
Anyway I compile fundamental ideas that I wanted to know as a beginner.
(I'll update to finish this text, please wait for some time.)
///Premise of trading///
Market's purpose...facilitating trading
Trader's purpose...making money
Market is stronger than trader and trader need adjust to market.
However trader have controllable side.
Market's control...Trend, Volatility
Trader's control...Money management, Making Risk:Reward, Choosing and exercising trading strategy
///Simple rule (Conclusion)///
I made simple rule "Just Do It Now" to check essential ideas on every trade.
Traders can use thousands of indicators but only use three choices "Buy, Sell and No trade".
If you have bad result, you had better suspect not your indicators but your three choices at first.
(This is one of the best advice I have ever heard by N jijii.)

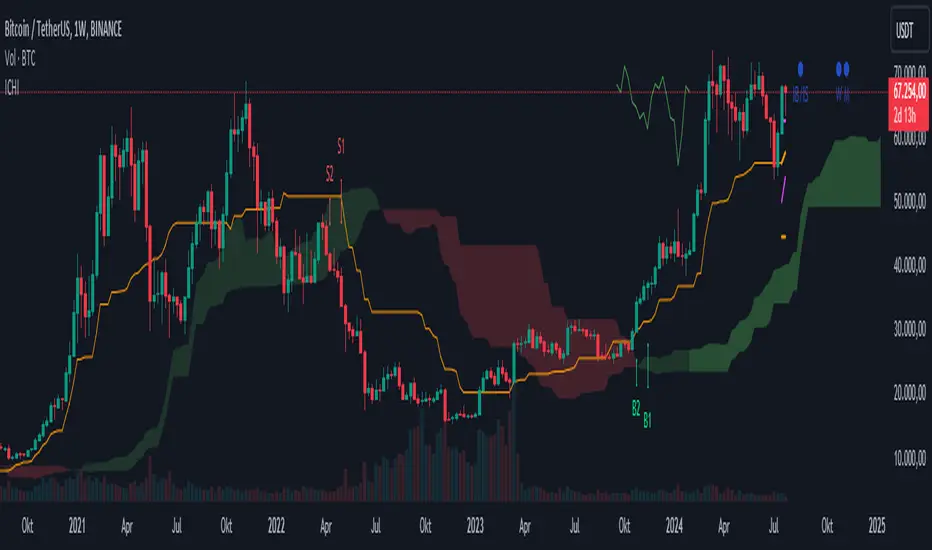
Ichimoku Kinko Hyo + FractalsIn contrast to my Ichimoku ++ Study this is a pure Ichimoku Konko Hyo Study with Bill Williams Fractals (I couldn't leave out the fractals as these levels are too important for Ichimoku trading).
In this study you can find many visualisation options for the Ichimoku Indicator and the signals the Ichimoku Tradingsystem can provide.
Tenkan-sen and Kijun-sen are provided optionally as mtf levels.
An mtf price cloud relationship is shown in the upper right.
The included signals are:
B1/S1 is a strong filtered signal. The condition for long entry is:
price > Kumo AND Chikou > price AND Chikou > Kumo AND Tenkan > Kijun AND Komo is green
B2/S2 is a less filtered signal. The condition for long entry is:
price > Kumo AND Chikou > price AND Tenkan > Kijun
IB/IS is a confluence signal. The condition for a long/short entry is: more than 50% of the 8 defined conditions must trigger a long signal. Below 50% long, it is a short signal because more than 50% of the entry conditions have triggered a short signal.
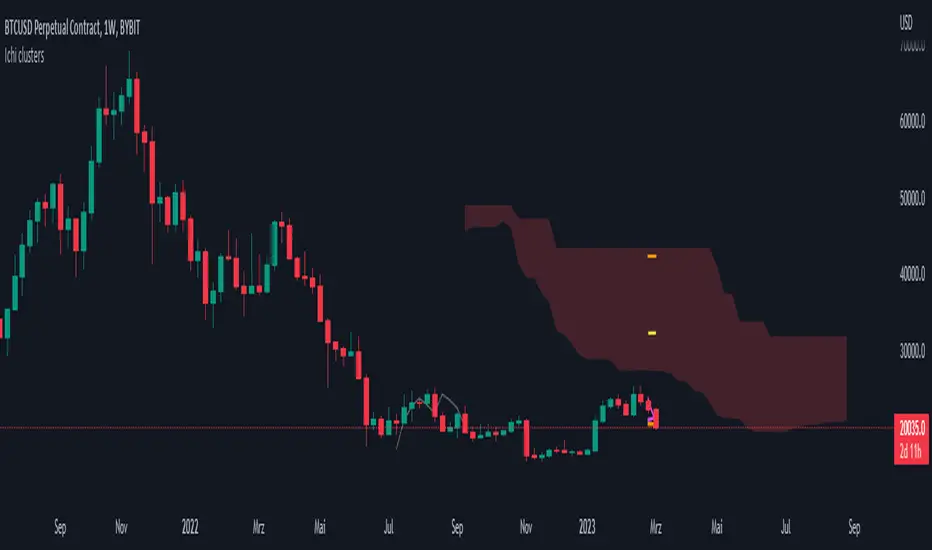
Ichimoku Kinko Hyo - mtf clustersThis script can show mtf-clusters from higher time frames. Tenkan-sen, Kijun-sen, Senko-span A and Senko-span B are displayed in the current time frame from higher time frames (the range is from 1 minute to the monthly time frame). Sometimes these levels form clusters that act as strong levels of support and resistance.
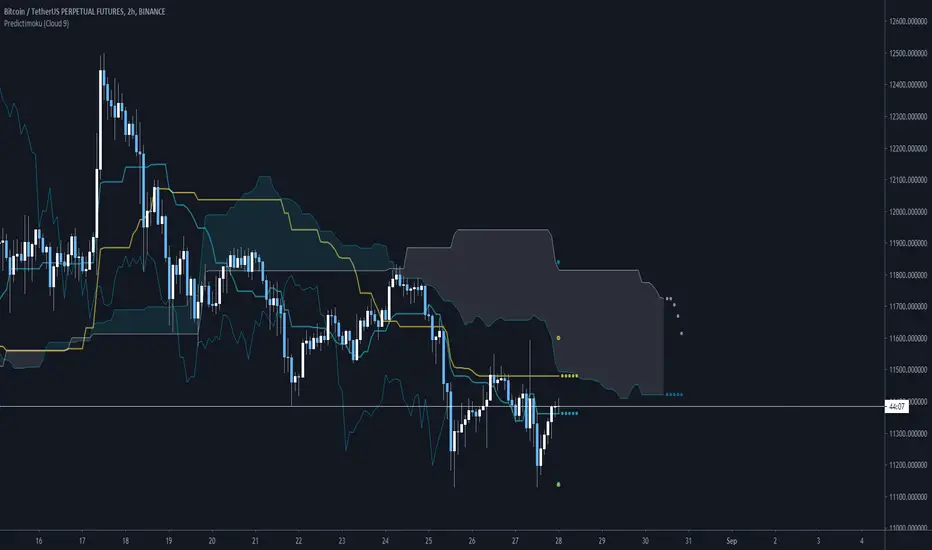
Predictimoku (Cloud 9) - Modified Ichimoku by Cryptorhythms [CR] Predictimoku (Cloud 9) - Modified Ichimoku by Cryptorhythms
📜Intro
New spin on the old standby ichimoku!
Predictimoku (Cloud 9): This indicator uses a proprietary algo to forecast the kijun tenkan & senkou spans accurately out into the future.
📋Background
Unfortunately you may have seen it around twitter as part of a paid for course with indicator set. These influencers claim its "their proprietary indicator". Well the truth is that the source code was stolen from me without payment by some folks who will remain nameless... Then they published the indicator as a private script to avoid moderation/ban (cowards!)
Lesson learned... this is why you never trust anyone until the money is in your hand. And if you see the indicator in the wild as part of some "guru's" overpriced course you will know who the thieves are!
But I wouldnt let that injustice or their shady behavior stand. So that now means you all will get access to it because I am providing it free for the public! :)
📋Features and How to Use
You use this indicator in all the same ways as you would use traditional ichimoku, the underlying structure is the same. Though the default settings are using doubled lookback lengths as per "crypto standard."
The extra functionality comes in the form of accurate and non repainting forecast of up to 17 bars for the kijun, tenkan and senkou spans! This can be useful in many ways for instance it can show you ahead of time when a kumo twist will happen, or a tenkan/kijun cross, etc!
💠Here is an example of the 17 bar forecast:
💠Here is an example of the Trading Range option to show you where price would need to go to force a recalculation of the forecasts. It also provides areas of interest for PA reactions.
💠Last an example of the fibonacci spread. By default the Auto Fib's lookback length is set to 60 to match the kijun lookback. This generally produces a nice framework for near future price action.
💠Look for some more new and unique ichimoku based indicators coming soon from us! :)
About Us
👍 We hope you enjoyed this indicator and find it useful! We post free crypto analysis, strategies and indicators regularly. This is our 84th script on Tradingview! Check signature for more information.
Pink panther It is a simple indicator, you can use it with all time frames. So the pink line present the last high potential area that price try to breakout , and to use it you must consider three main things :
1- price on your time frame above Ichimoku cloud.
2- RSI above 50.
3- MACD crossover.
how to execute your order?
when price break the pink line and close 1 minute candle .
Shenlong V2.3 - Trend cycleShenlong V2 is a script developed to facilitate the interpretation of long and short entries according to various conditionals that play with the trend.
The use of trend clouds has been implemented, which can be used as dynamic support / resistance . They also allow us to identify the current price cycle according to these guidelines, marking with a LONG or SHORT depending on the cycle in question. The appearance settings are user configurable. You can set alerts (long o short) to be aware of movements.
The use of recommended stop loss has been implemented, this can be used as a trailing stop to ensure profits or give the possibility of catching the trend, since it will move as the price forms its structure.
An information panel on stop prices has been implemented for ease of use.

InariN BasicInariN is original work by N jijii.
I think InariN is modern interpretation of Ichimoku Cloud.
Please read script "InariN simple" for basic usage.
Multi time flame candles in this script is great work Candlestick Plot MTF by mortdiggiddy.
Supplementary explanation :
N jijii decided basic numbers as Ichimoku.
"I" first swing is 9. Only first swing is 9 because all numbers is consisted of nine numbers except start point 0 (his philosophy).
The second and subsequent is 8 because tangent point of previous swing is not counted (his philosophy).
"V" second swing is 9 + 8 = 17. "N" third swing is 9 + 8 + 8 = 25.
"N N = N2" is 25 +24 = 49. "N4" is 97. "N9"is 217.
He used basic numbers for parameters.
I think his idea is unique but the important point is this basic numbers are about popular numbers traders usually use and we can use as the same.
N2 and N9 spans is slightly difficult to use (Ichimoku lagging span).
Basically N span is used to measure Time Retracement and momentum.
If you want to practice Time Retracement , please check script "Ichimoku Time Retracement".
Enjoy!!
Ichimoku Candles V1Candles breakout use numbers ichimoku 9 17 26 52 65 129
+ candles up is white
+ candles up is yellow
+ symbol & number 17 ,52, 129 breakout HL zone (the previous candles)
+ symbol & no number breakout HL zone (the previous candles 9 ,26, 65 )
+ xcross top & bottom is 9 , 17
+ triangleup top candles is 26 , 52
+ flag bottom candles is 65 , 129
Best when combined with Ichimoku for Crypto , FX.....
Ichimoku Time RetracementThis is educational tool for understand pullback measurement .
Price pullback and Time pullback is basic concept for ichimoku.
I change parameters to understand relationship of each line easily and add lines .
Enjoy!!

Dexie Indicator v1.0The Dexie Indicator is a Forex indicator system built for the 5 min chart. It is suitable for Forex traders and Nadex users and provides BUY/SELL signals with alerts and comes with a series of 8 custom built Moving Averages designed to reduce the need for chart drawing.
This indicator can be used by beginners out of the box and requires very little trading experience to be successful.
The more advanced trader can work with this tool to greatly increase their success rate and make for a much more enjoyable trading experience.
Please contact for more details.
Dexie Indicator with BUY/SELL signals displayed only:
Dexie Indicator with BUY/SELL signals, Bollinger Bands and custom Moving Averages:
Dexie Indicator with all custom Moving Averages displayed:
Dexie Indicator slower Moving average bull cross example:
Dexie Indicator slower Moving average bear cross example:

Dexie Indicator v1.0The Dexie Indicator is a complete Forex trading system built for the 5 min chart. It is suitable for Nadex users and provides BUY/SELL signals with alerts and comes with a series of 8 custom built Moving Averages designed to reduce the need for chart drawing.
This indicator can be used by beginners out of the box and requires very little trading experience to be successful.
The more advanced trader can work with this tool to greatly increase their success rate and make for a much more enjoyable trading experience.
Please contact for more details.
Dexie Indicator with BUY/SELL signals displayed only:
Dexie Indicator with BUY/SELL signals, Bollinger Bands and custom Moving Averages
Dexie Indicator with all custom Moving Averages displayed

Ichimoku Cloud - AlertsIchimoku cloud
IC is a trend - following system with an indicator similar to moving averages
It predicts price movements
Offers a unique perspective of support and resistance levels.
Conversion Line (Turning Line)
- Measures Short Term Trend
- SIgnals an area of minor support and resistance
Base Line (Confirmation Line)
Measures Medium term trend
Used as Trailing Stop Level.
Lagging Span (Lagging Line)
Used for Confirmation of signals
Can also serve as Support and Resistance Level
Kumo Cloud
Formed of two lines: Span A (Green Line) and Span B (Red Line)
Dynamic Support and Resistance .
HOW TO READ ICHIMOKU INDICATOR
Conversion Line
If the Market Price is above the Conversion Line = Short Term Upward Movement
If the Market Price is below the Conversion Line = Short Term Downward Movement
Increasing Conversion Line = Upward Short Term Trend
Decreasing Conversion Line = Downward Short Term Trend
Base Line
If the Market Price is above the baseline = Medium - term upward trend
If the Market price is below the baseline = Medium - Term downward Trend
Increasing Base Line = Upward Medium term trend
Decreasing Base Line = Downward Medium Term Trend
Lagging Span
The Evolution of the current price action in relation to previous price action
If the Lagging span is above the current price = Bullish Bias
If the Lagging span is below the current price = Bearish Bias
Lagging span near the current price = Trading range
Kumo Cloud
Dynamic Support and Resistance based upon price action.
The longer the price stays below/above the Kumo cloud, the STRONGER the trend is.
When the cloud is wide, the expected support or resistance is strong
When the cloud is thin, the expected support or resistance is weak
Never trade inside the KUMO CLOUD.
HOW TO TRADE WITH ICHIMOKU CLOUD
Baseline and conversion Line crossover (Lagging Span as a Filter)
crossover(conversion line, baseline) = Buy
crossunder(conversion line, baseline) = Sell
FILTER
crossover(conversion line, baseline) and lagging span is Bullish (i.e above the price) = Buy
Crossunder(conversion line, baseline) and lagging span is Bearish (i.e below the price) = Sell
2. Baseline - Conversion line crossover (Kumo cloud Filter)
crossover(conversion line, baseline) above the Kumo Cloud = Strong Buy
crossover(conversion line, baseline) below the Kumo cloud = Weak Buy
crossunder(conversion line, baseline) below the Kumo Cloud = Strong Sell
crossunder(conversion line, baseline) above the Kumo Cloud = Weak Sell
3. Kumo Cloud Breakout
When the price enters the Kumo Cloud, and breaks its Upper wall upward = Bullish Signal
When the price enters the Kumo Cloud, and breaks its Lower wall downward = Bearish Signal
4. Kumo Cloud Crossover
When Span A cuts the Span B from below to the upside and prices are positioned above the Kumo Cloud = Strong Buy Signal
When Span A cuts the Span B from upside to the bottom and the prices are positioned below the Kumo Cloud = Strong Sell
When Span A cuts Span B from bottom to the upside and prices are positioned below the Kumo Cloud = Weak Buy Signal
When Span A cuts Span B from the upside to the bottom and the prices are positioned above the Kumo Cloud = Weak Sell Signal.
NOTE:- Some of the signals collide with each other, but they collide for the same call, so shouldn't really be a problem overall. Let me know if you have any suggestions to nullify the trading Range. Though I do plan on adding my Renko code to it for filtering out Trading Range.

2 VWAP with selective timeframe and Display liked Ichimoku CloudSET:CKP
This is my first indicator of VWAP that I fork from the original script by public script "VWAP Periodic".
You can see that original script by type "VWAP Periodic" from "New" in "Pine Indicator".
The reason that I want to share my script is only one thing. That I need to discuss, Is this indicator can identify the trend and can use it to adapt to the "Buy-On-Dip" strategy?
Double VWAP can show you 2 lines of VWAP form different periods as my default is "Week" and "Month" timeframe.
Not at all, it fulfils with the background of the simple colour which can be defined Trend just liked "Ichimoku Cound" (Yes indeed, green is uptrend and red is downtrend).
I hope this indicator will help :)
Wishing you good health and get wealth too. :) :) :)
---------------------------------------------------------------------------------------------
สวัสดีครับมิตรสหายทุกท่าน อินดิเคเตอร์ที่ผมจะมานำเสนอมิตรสหายนี้ เป็นอินดี้ที่จะแสดงเส้น VWAP ได้ทั้งหมด 2 เส้น โดยท่านสามารถระบุ Timeframe ของ VWAP ที่ท่านต้องการได้เลยครับ
ก่อนอื่นผมของออกตัวก่อนครับ ว่าอินดิเคเตอร์นี้ผมโฟร์คมาจาก Original Public Script จากใน Pinescript แห่ง Trading View นี่ละครับ จากอินดิเคเตอร์ที่มีชื่อว่า "VWAP Periodic" ซึ่งท่านสามารถ กดดู Original Script ได้จากการกดที่
1) ไพน์อินดิเคเตอร์
2) กดเลือกคำว่า "ใหม่"
3) หาอินดิเคเตอร์ที่ชื่อว่า "VWAP Periodic"
้เท่านี้ท่านก็จะได้สคลิปต้นแบบที่ผมนำมาปรับใช้ได้ทันทีครับ
แต่กระนั้นแล้ว ผมจะเปิดโชว์สคริปของผมที่นำมาโฟร์คแล้วให้ทุกท่านได้รับชมกันด้านล่างในส่วนของโค้ดนะครับ
จุดประสงค์ของอินดิเคเตอร์นี้คือได้ฟังแนวคิดของ VWAP จากกัลยาณมิตรเทรดเดอร์ด้วยกันแล้วรู้สึกคลิ๊ก กับอินดิเคเตอร์นี้มากครับ
จะมีอะไรดีไปกว่าการได้รู้ต้นทุนราคาของแต่ละช่วงเวลา ทั้งไทม์เฟรมที่ใหญ่อย่างระดับ "เดือน (เส้นสีเขียว)" และ ระดับ "สัปดาห์ (เส้นสีแดง)" ได้พร้อมกันและดูแท่งเทียนเพื่อ "จับจังหวะซื้อ"(ในไทม์เฟรม ระดับ วัน) ที่ราคาต่ำกว่าค่า VWAP อีกเล่าอรชุน
จุดประสงค์หลักของอินดิเคเตอร์นี้ คือมีไว้เพื่อระบุเทรนด์โดยอาศัยการดูระยะห่างของเส้น VWAP ทั้ง 2 เส้นนี้ และระบุ "จุดกลับตัว" เมื่อก้อนเมฆสีเขียวและแดงเริ่มหายไป เสมือนกับอินดิเคเตอร์ "เมฆหมอกแห่งอิชิโมคุ"
นอกจากนี้เมื่อราคาหุ้นปรับตัวเป็นเทรนด์ขาขึ้นแล้ว เรายังสามารถซื้อเฉลี่ยขาขึ้น หรือใช้กลยุทธ์ Buy-on-Dip ได้อีกด้วยครับ โดยเฉลี่ยซื้อเมื่อราคาตกย่อมาอยู่ที่เส้นสีเขียว แบบนี้เป็นต้นครับ
ผมหวังว่าอินดิเคเตอร์นี้จะเป็นประโยชน์ให้แก่มิตรสหาย และกัลยาณมิตรเทรดเดอร์ทุกท่านนะครับ
ผมขออวยพรให้ทุกท่านมีความสุข ออกจากสนามแข่งหนูนี้ ได้รับอิสระภาพทางการเงิน และ "มีสุขภาพที่แข็งแรง" Work life balance ทุกท่านครับ
ขอบคุณครับ :) :) :)

InariN simpleJapanese legendary day trader's indicator "InariN" .
"N jijii " introduced this original indicator at his ebook and I made it simple for my own use .
This is not original type but I picked up essential elements to practice his idea .
I guess he is real forex day trader and "InariN" is similar to "Ichimoku" .
I have used this at EUR/USD 5 minutes chart for several months and I get basis for judgement .
This is not a magical tool but you can make good reference point to use this .
I think " I " means first swing , " nari " is " become " and " = " , and " N " is third swing .
For example , look at chart , AB is first swing ,BC is second and CD is third .
In many cases ,AB = CD and it called measured move .
"InariN" provide reference point to decide always-in ,entry point , entry timing and exit point.
1.
"InariN" is a trendfollowing tool , you can judge bull or bear by a few lines .
25 ema represent short time frame , 49 (about 4 hour bar at 5 minutes chart ) is middle time frame and 217 (about 18 hour at 5 minutes chart )is long time frame (preset periods is "N jijii" style . please use favorite time frame ).
For example , when current price is above 25ema ,49ema and 217 High-low band"s middle line , market is strong bull .
So you can do multi time frame analyze .
Hint ; you also have to check daily chart's trend .
2.
Every line provided by "InariN" tends to become bull-bear battle point , so you can easily check where is support and resistance line .
Hint ; Especially 25ema is important to pullback entry in trend and 217 high-low line is important to do fade trade in range and reversal .
You have to wait entry until touch and stick lines and follow winner (to avoid failed breakout check shrinking bar) .
3.
You can also use lines to except exit point because high-low band is symmetry .
Hint ; I recommend use custom fibonacci retracement tool to measure Risk-Reward Ratio and exit point .
I customized fibo tool to be symmetry .
Entry point ,exit point and loss cut point became symmetry and you can add other symmetry points more .
For example , look at chart , blue lines is fibo tool and you can measure exit point .
Have fun!!

ICHIMOKU MTF PROICHIMOKU KINKO HYO MTF PRO by Rohan
In the late 1930s, Goichi Hosoda, a Japanese journalist, known as Ichimoku Sanjin (“what a man in the mountain sees” in translation) created Ichimoku Kinko Hyo.
If we are to translate Ichimoku Kinko Hyo, we will get “a glance at an equilibrium chart”
It has 5 Components:
1. Kijun Sen (brown line): (Highest High + Lowest Low) / 2 over the past 26 periods.
2. Tenkan Sen (blue line): Tenkan-Sen (Conversion Line) = (Highest High + Lowest Low) / 2 over the past 9 periods.
3. Chikou Span (purple line): Present trading days closing price plotted 26 periods behind.
4. Senkou SpanA (green line): (Tenkan-Sen + Kijun-Sen) / 2, plotted 26 periods in the future.
5. Senkou SpanB (red line): (Highest High + Lowest Low) / 2 over the past 52 periods, but plotted 26 periods in the future
Why The Ichimoku Matters?
Ichimoku is an ideal visual representation of key data, based on the historical data of moving averages.
Ichimoku can be used in all time frames for any tradeable asset. Ichimoku can be used in both rising and falling markets
Trading Methods by the ICHIMOKU MTF PRO Indicator:
1. TK Crossover Candle Indicator
2. TK Crossover Lines
3. Chikou Line Display
4. Multiple Timeframes Ichimoku Support/Resistance Lines
5. Kijun Flat Line Display
How traders can ask you for access to your script:
Interested traders to send you a private message on TV to gain access
Terms and Conditions:
1. The Author/User is not responsible for anything or trades taken etc
2. Indicator is for educational purpose only

Ichimoku +FutureKijunIt's a simple code that will show you the future Kijun and Tenkan, assuming that no new High or Low will be submitted.
Ichimoku ++ public v0.9Description:
The intention of this script is to build/provide a kind of work station / work bench for analysing markets and especially Bitcoin . Another goal is to get maximum market information while maintaining a good chart overview. A chart overloaded with indicators is useless because it obscures the view of the chart as the most important indicator. The chart should be clear and market structure should be easy to see. In addition, some indicator signals can be activated to better assess the quality of signals from the past. The chart environment or the chart context is important for the quality of a signal.
The intention of this script is not to teach someone how to trade or how to use these Indicators but to provide a tool to analyse markets better and to help to draw conclusions of market behaviour in a higher quality.
A general advise:
Use the included indicators and signals in a confluent way to get stoploss, buy and sell entry points. SR clusters can be identified for use in conjunction with fractals as entry and exit pints. My other scripts can also help. Prefer 4 hours, daily and a longer time frame. There is no "Holy Grail" :).
If someone is new to trading you should learn about the indicators first. Definitely learn about Ichimoku Cloud Indicator.
Integrated indicators are:
Ichimoku Cloud and signals
Parabolic SAR and signal
ATR stop
Bollinger Bands
EMA / SMA and background color as signal
Williams Fractals and signal
Puell Multiple signal
