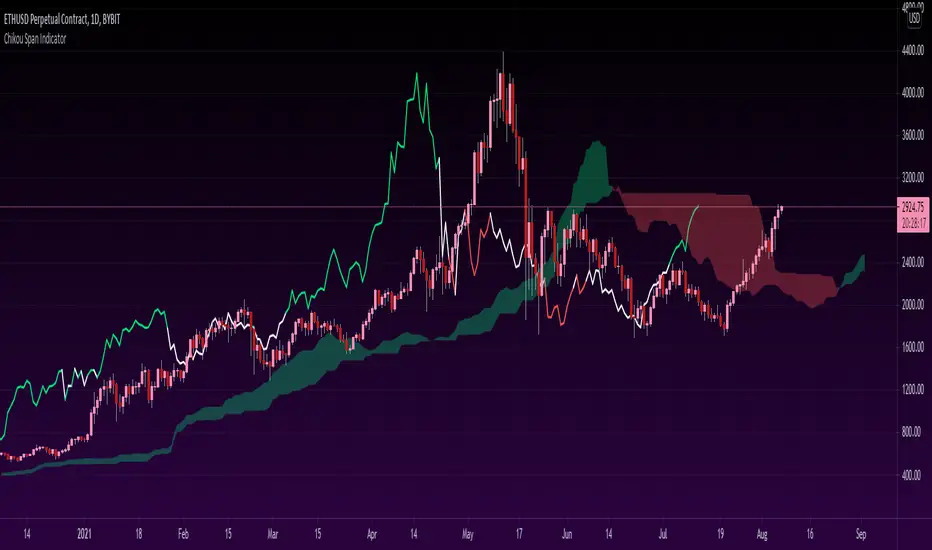
Chikou Span 'Open Space' ColorsThe Ichimoku Clouds strategy has been one of my favorite scripts to work with since I came across it a few months ago, so I thought I'd share one of the automated features I created for the strategy.
For the purpose of this script, I'll only explain the Chikou Span aspect of it since there are plenty of other explanations about Ichimoku Clouds.
The Chikou Span is one of the most useful aspects of the Ichimoku Clouds strategy despite it not being used in most people's strategies. It is calculated by simply taking the current closing value and plotting it backwards 26 bars. The Chikou Span is used to identify large trend moves and trend reversals by what is referred to as 'open space'. This occurs when the Chikou Span is not intersecting any candlestick within 10 bars (if you were to draw a horizontal line from the tip of the Chikou Span, it would not touch any part of a candle within 10 bars).
The purpose of this script is to better identify the Chikou Span reaching 'open space' by coloring the Chikou Span's line:
- Green when it is in upwards open space (bullish trend), and
- Red when it is in downwards open space (bearish trend).
I've also included my personal color scheme for the Ichimoku Clouds strategy as well as inputs to turn on/off every aspect of the strategy.
** Disclaimer: THIS IS NOT TRADING ADVICE. The Chikou Span should not be used on its own to make any trades. When trading with the Ichimoku Cloud strategy, one should utilize all 5 lines of the strategy to make realistic trades. If you'd like to learn more, I'd recommend reading "Trading with Ichimoku Clouds - The Essential Guide to Ichimoku Kinko Hyo Technical Analysis" **
一目均衡表
Ichimoku + RSI Crypto trending strategyThis is a crypto trending strategy designed for big timeframes such as 3-4h+.
Its components are:
RSI
ICHIMOKU full pack
Heikin Ashi candles for logic calculation inside
Rules for entry.
For long : we have a long cross condition on ichimoku and price is above the ichimoku lines, and at the same time RSI value is > 50.
For long : we have a short cross condition on ichimoku and price is below the ichimoku lines, and at the same time RSI value is < 50.
Rules for exit
We exit whenever we receive an opposite signal of the initial entry.
SInce this strategy is using no risk management inside, I recommend to be careful with it .
If you have any questions, let me know !

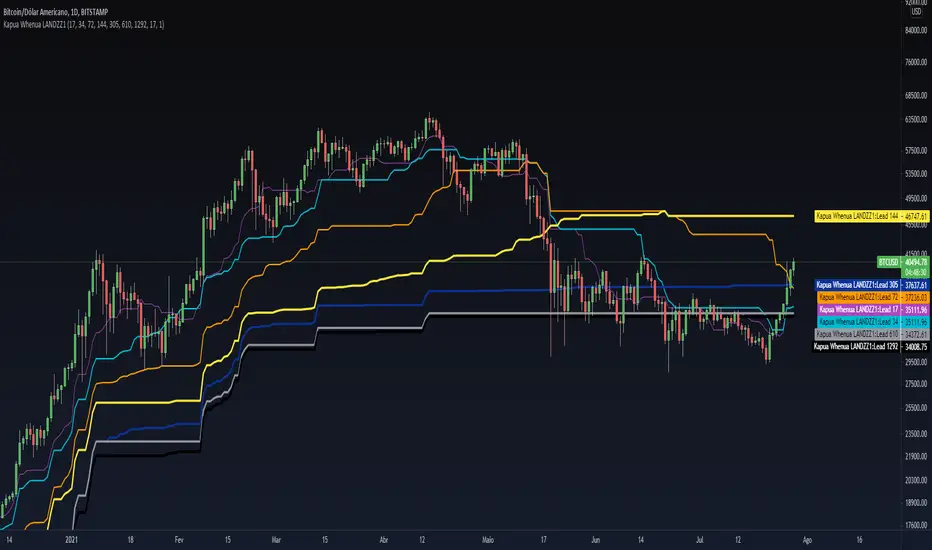
Kapua Whenua LANDZZ1Kapua Whenua means Earth's Clouds in Maori language, this indicator was created to show impulses and trends of the asset's price movement both up and down.
The Indicator was made based on key numbers of the golden ratio:
Conversion Line: Kw 17 (Purple Color)
Kw 34 - Short Period Fractal (Light Blue Color)
Kw 72 - Short/Medium Period Fractal (Orange)
Kw 144 - Medium Period Fractal (Yellow Color)
Kw 305 - Medium/Long Period Fractal (Dark Blue Color)
Kw 610 - Long Period Fractal (Grey)
Kw 1292 - Long Period Fractal+ (Black Color)
The baseline or also called the conversion line is identified by the Color Purple of value 17.
How to read the indicator:
Every time the conversion line (Purple Color 17 periods) crosses a Kw value (Kapua Whenua) it will always look for the next KW line above or below the value as support or resistance.
For example:
If we are in a bull market, and the price crosses below the KW17 conversion line it will go towards KW 34 as support, if the price breaks KW 34 it will go towards the next line below KW 34 as support.
Every time the conversion line or the price crosses a higher value of Kapua Whenua (KW) this trend will be stronger, it means, if the conversion line (KW 17) crosses above KW 305 it will indicate more strength than if it had crossed above the KW 72 or 144 for example. So to get better results trading with the trend, always observe if the conversion line and the price are below or above some Medium/Long Period KW.
Note also that, in an uptrend, it could be that all KW are below each other. In a downtrend, it could be that all KW are on top of each other. This indicates that the farther the price is from the fractals the stronger the trend is, also, when there is a narrowing of the fractals means that the price will start to go sideways. If the price is between 2 or more Fractals, it will indicate consolidation.
A really good trend is considered when the price or the Short/Medium Period Fractals are all above or below at KW 610, which is a long period fractal, meaning a strong uptrend or downtrend.
A larger KW can be at the same point as a smaller KW, however, the stronger color will be shown above the weaker one.
***Larger chart timeframes are better to see longer KW fractals that are above or below the price, if your chart timeframe doesn't show a bigger support or resistance fractal, change the chart time to another longer period**
Tip - Get used to looking at line colors as your indicators, just like moving averages. You can also take or place any fractal at any time in the configuration menu.
ICHIMOKU Trading betaIchimoku Kinko Hyo is a trend-following trading system with 5 indicators. All the five indicators have a different purpose and successful Ichimoku trading required in-depth analysis of all indicators. The script interpreted each indicator and develop a score to indicate the overall strength.
I have taken the idea from the book “Trading with Ichimoku Clouds by MANESH PATEL”. The scoring system is mine to get an idea about how all the indicators are performing together.
If most of the indicators are confirming then the score will be high.
I am very new to Pinescript, so waiting for your comments and review.
You can view all comments by turning the comments on.

Equilibriums -- Based on Ichimoku Kinko HyoIntro:
Hello dear traders. Lately I have been studying Ichimoku for trading. Personaly I find myself in a long lasting quest of creating an automated trading strategy that works.
Let me tell you it aint easy. On this route I made countless of indicators some of which are worthless, others that have some potential. I did not publish these indicators as I do not want to bother people with sub par indicators that waste your time. My belief is strong and some day I will probably succeed in creating a working strategy.
About the indicator:
While researching Ichimoku Kinko Hyo (thanks chaostrader69 for providing such invaluable knowledge) I came across the numbers that define ichimoku. The Tenkan-sen and Kijun-sen lines and even the cloud are based on these numbers and create market equilibrium. The market always wants to return to this equilibrium. As a pine scripter and curious individual I made this indicator to expand the Tenkan and Kijun lines to more of these ichimoku number periods.
Ofcourse this creates a mess of an indicator especialy when combined with the real ichimoku which is already too much info to grasp and apply correctly for most traders. I can not recommend any strategy with this indicator and that is why I want to deliver this simple script to the public. Opinions and trading theorys regarding these lines are very welcome.
As you can see by the chart on the publication of this script the lines where nice and open and not crossing eachother in a clear uptrend. While when it was trading sideways the lines did not show direction at all and where close to eachother and crossing. Thx for taking the time to read this and possibly giving feedback. Feedback on the colors/line thickness is also welcome as I want my indicators to be beautiful!

Ichimoku Cloud Strategy Long Only [Bitduke]Slightly modificated and optimized for Pine Script 4.0, Ichimoku Cloud Strategy which, suddenly, good suitable for the several crypto assets.
Details:
Enter position when conversion line crosses base line up, and close it when the opposite happens.
Additional condition for open / close the trade is lagging span, it should be higher than cloud to open position and below - to close it.
Backtesting:
Backtested on SOLUSDT ( FTX, Binance )
+150% for 2021 year, 8% dd
+191% for all time, 32% dd
Disadvantages:
- Small number of trades
- Need to vary parameters for different coins (not very robust)
Should be tested carefully for other coins / stock market. Different parameters could be needed or even algo modifications.
Strategy doesn't repaint.

Ichimoku [xdecow]The Ichimoku Kinko Hyo (Ichimoku Cloud) is a popular indicator / system.
In this version you will have a panel that shows the main signs of this system.
Each signal can have its status as bullish (weak, neutral or strong), consolidation and bearish (weak, neutral or strong).
Signals
Kijun-Sen Cross
Occurs when the price closes above/below the Kijun-sen.
Weak Bullish: Occurs below the Kumo.
Weak Bearish: Occurs above the Kumo.
Bullish/Bearish Neutral: Occurs inside the Kumo.
Strong Bullish: Occurs above the Kumo.
Strong Bearish: Occurs below the Kumo.
TK Cross
Occurs when the Tenkan-sen crosses the Kijun-sen.
Weak Bullish: Occurs when the crossing is below the Kumo.
Weak Bearish: Occurs when the crossing is above the Kumo.
Bullish/Bearish Neutral: Occurs when the crossing is inside the Kumo.
Strong Bullish: Occurs when the crossing is above the Kumo.
Strong Bearish: Occurs when the crossing is below the Kumo.
Chikou Span Cross
Occurs when the Chikou Span crosses the price.
Weak Bullish: Occurs when current price is below the Kumo.
Weak Bearish: Occurs when current price is above the Kumo.
Bullish/Bearish Neutral: Occurs when current price is inside the Kumo.
Strong Bullish: Occurs when current price is above the Kumo.
Strong Bearish: Occurs when current price is below the Kumo.
Kumo Breakout
Occurs when the price closes above/below the Kumo.
Kumo Twist
Occurs when the Senkou Span A crosses the Senkou Span B ahead.
Weak Bullish: Occurs when current price is below the Kumo.
Weak Bearish: Occurs when current price is above the Kumo.
Bullish/Bearish Neutral: Occurs when current price is inside the Kumo.
Strong Bullish: Occurs when current price is above the Kumo.
Strong Bearish: Occurs when current price is below the Kumo.
In addition, Senkou Span B turns golden when it is flat and the cloud is lighter when it is thin (default is half the average of the last 610).

Ichimoku all signalsIchimoku Cloud All Signals!
This indicator shows all Ichimoku Cloud signals for (entering/exiting/confirming/or even staying) in a position.
you can choose a signal related to your strategy and use it.
you can choose which signals to be shown on the chart by changing the settings.
here are some examples of signals that you can get from this indicator:
Crossover/under conversion line & base line
Crossover/under lead line1 & lead line2
Crossover/under conversion line & lead line1
Crossover/under base line & lead line1
Crossover/under conversion line & lead line2
Crossover/under base line & lead line2
Crossover/under close & base line
Cloud Breakouts in both directions!
and 74 signals more !!!!

Ichimoku cross and kumo switch Indicator [Mehdihz]This script has both cross and switch indicators.
** For switch indicator without shift, use 1 for Displacement

Ichimoku breakoutIf you use Ichimoku Cloud strategies, this indicator is very useful for you!
This code indicates the candles that break the ichimoku cloud in both directions!
conversion line, base line and lagging span are disable by default, you can enable it from settings window.
green triangles under the candles with green backgrounds show break out the red clouds.
red triangles at the top of the candles with red backgrounds show break out the red clouds.
you can set alerts to be notified when an Ichimoku Cloud is broken.

Ichimoku EMA RSI - Crypto only long StrategyHey there!
Here I show you an Ichimoku Cloud Strategy.
I discovered the strategy on a YouTube channel and tried to transfer it as a strategy into a script.
He said in his video that you would make more profit with this strategy than holding the coin.
Tested with the crypto pair ETH/USDT in the four hour chart.
Period: beginning of 2017 until today.
The strategy should also work with foreign exchange. But then the settings have to be adjusted.
There is the possibility to activate two EMA's and a Stochastic RSI .
-----------------------------------------------------------------------------------
How does the strategy work?
ENTRY
The green Ichimoku lead line must above the red Ichimoku lead line - only the two lead lines are activated.
A green candle must closed above the green lead line.
EXIT
A red candle must close below the green Ichimoku lead line.
OPTIONAL ENTRY
EMA
Once you activate the EMA , long positions will only be taken once the EMA1 is above the EMA2.
Thereby I could observe a significant increase of the profit as well as a decrease of the maximum drawdown.
RSI
As soon as you activate the Stochastic RSI , long positions are only taken when the K line is above the D line.
In the future, I may add an oversold - undersold parameter.
The results of the strategy are without commissions and levers.
If you have any questions or feedback, please let me know in the comments.
If you need more information about the strategy and want to know exactly how to apply it, check out my profile.
I wish you good luck with the strategy!

[Kai]Ichimoku 一目均衡表LOG Computable Ichimoku clouds Ichimoku Kinko Hyo
Expected to be used on LOG scale
Please note that the value is calculated slightly smaller because it is calculated in LOG.
The usage seems to be the same as the normal Ichimoku clouds Ichimoku Kinko Hyo
* By default, LOG MODE is setting so if you need normal display, set it to FALSE.
LOG計算可能な]Ichimok clouds 一目均衡表です
LOGスケールでの使用を想定しています
LOG計算しているので値は若干小さめに算出されるので注意が必要です
使用方法は通常のIchimok clouds 一目均衡表と同じで良いと思われます
※デフォルトではLOG MODE設定になっていますので、通常の表示が必要な場合は設定でFALSEにしてください

Ichimoku Buy & Sell SignalsIchimoku cloud with color coded circles to signal the cross of Tenkan and Kijun.
Technicals Rating Strategy v420Ichimoku, HMA, RSI, Stoch, CCI, MACD, Technicals Rating Strategy is a trading Bot that looks at these chosen indicators and assigns a value to each, then calculates the result of adding each indicators result value to a overall rating, which is then compared to a user set level. Here seen on Bitcoin, it has the broker fee included in the testing result. If you choose to use it on Forex etc, perhaps remove the broker fee which is unrealistic for FX trading.
It has a Win/Loss ratio of only 40% wins, but it catches the big moves and thats the main thing, so if ELON MUSK had of used this strategy instead of BUY and HOLD, he could of made 700% instead of 7% (as is, may, 2021)
Mainly intended for use as Automated TRADE BOT.
(imagine if Elon Musk did use this bot with his 1.3 billion $ worth of BTC, the drawdown would be like, half a billion or something haha (p.s.- use smaller lotsize % to get smaller drawdown, but then smaller profit....) )
For use with any pair and timeframe. In fact there is a timeframe setting to set the strategy to look at alternative timeframe from chart, but as default will just be set to charts timeframe.

BTC_ISHIMOKUInvestment trading strategy on the daily timeframe of the BTC-USD pair based on the Ichimoku cloud indicator

Kyushu Legs - Advanced Ichimoku Kinko Hyo TechniqueWhat is Kyushu Legs?
Kyushu Legs created by the open price of 9 previous weekly candle and current weekly close price.
P/s: This is the advanced Ichimoku Kinko Hyo technique by Master Goichi Hosoda
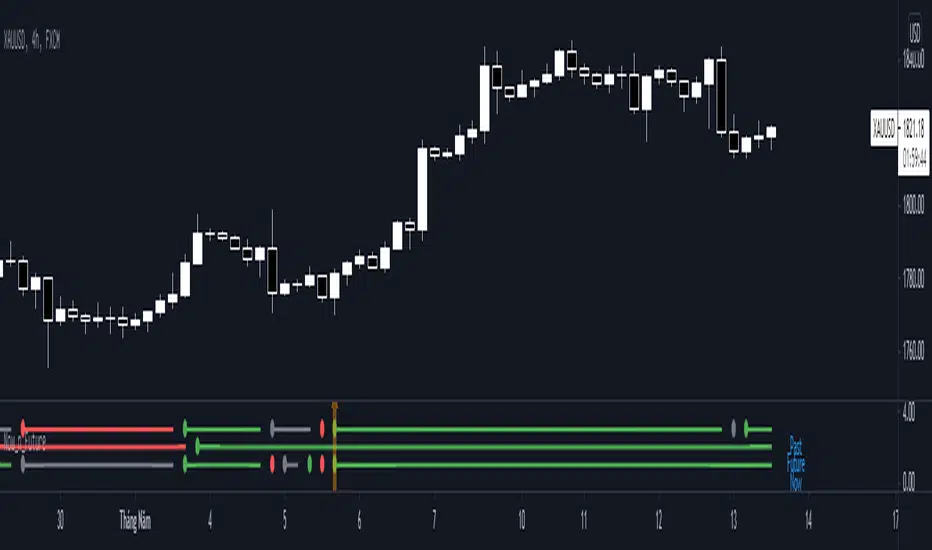
Now_n_FutureNow_n_Future base on Kumo cloud of Ichimoku Kinki Hyo system with detail below:
1. The Now Line
- When price moving above Kumo, color of now line is green.
- When price moving below Kumo, color of now line is red.
- When price moving inside Kumo, color of now line is gray.
- When price go into Kumo, now line appear gray dot.
- When price cross over Kumo, now line appear green dot.
- When price cross under Kumo, now line appear red dot.
2. The Future Line
- When Senkou Span A moving above Senkou Span B, color of future line is green.
- When Senkou Span A moving below Senkou Span B, color of future line is red.
- When Senkou Span A cross over Senkou Span B, future line appear green dot.
- When Senkou Span A cross under Senkou Span B, future line appear red dot.
3. Trading
- When color of both now line and future line is green, consider open Long position or close Short position.
- When color of both now line and future line is red, consider open Short position or close Long position.
Ichimoku Crypto Cloud 11-30-61A minor adjustment to the original Ichimoku Cloud, changing periods to reflect the 24/7 open market of cryptocurrency.
TENKAN: 11 - a week and a half
KIJUN: 30 - one month
SENKOU: 61 - two months
For a simpler visualization, I made the cloud limit lines and the Chikou line invisible by default.

Hosoda Cycles (24x7 mkt) {fmz}This script allows you to see on the chart which are the bars, including future ones, which correspond to the cycles of Goichi Hosoda, the inventor of Ichimoku Kinko Hyo.
This script is only suitable for 24x7 markets, it is not suitable for markets with closing times and weekends, or gap markets where trading is not active. In fact, the calculation of calendar times is used, not suitable for markets with closing times.
Use the settings to indicate what the start time of bar 1. The indicator will produce many vertical bars, even in addition to the end time of the graph.

Overlay Indicators (EMAs, SMAs, Ichimoku & Bollinger Bands)This is a combination of popular overlay indicators that are used for dynamic support and resistance, trade targets and trend strength.
Included are:
-> 6 Exponential Moving Averages
-> 6 Simple Moving Averages
-> Ichimoku Cloud
-> Bollinger Bands
-> There is also a weekend background marker ideal for cryptocurrency trading
Using all these indicators in conjunction with each other provide great confluence and confidence in trades and price targets.
An explanation of each indicator is listed below.
What Is an Exponential Moving Average (EMA)?
"An exponential moving average (EMA) is a type of moving average (MA) that places a greater weight and significance on the most recent data points. The exponential moving average is also referred to as the exponentially weighted moving average. An exponentially weighted moving average reacts more significantly to recent price changes than a simple moving average (SMA), which applies an equal weight to all observations in the period.
What Does the Exponential Moving Average Tell You?
The 12- and 26-day exponential moving averages (EMAs) are often the most quoted and analyzed short-term averages. The 12- and 26-day are used to create indicators like the moving average convergence divergence (MACD) and the percentage price oscillator (PPO). In general, the 50- and 200-day EMAs are used as indicators for long-term trends. When a stock price crosses its 200-day moving average, it is a technical signal that a reversal has occurred.
Traders who employ technical analysis find moving averages very useful and insightful when applied correctly. However, they also realize that these signals can create havoc when used improperly or misinterpreted. All the moving averages commonly used in technical analysis are, by their very nature, lagging indicators."
Source: www.investopedia.com
Popular EMA lookback periods include fibonacci numbers and round numbers such as the 100 or 200. The default values of the EMAs in this indicator are the most widely used, specifically for cryptocurrency but they also work very well with traditional.
EMAs are normally used in conjunction with Simple Moving Averages.
" What Is Simple Moving Average (SMA)?
A simple moving average (SMA) calculates the average of a selected range of prices, usually closing prices, by the number of periods in that range.
Simple Moving Average vs. Exponential Moving Average
The major difference between an exponential moving average (EMA) and a simple moving average is the sensitivity each one shows to changes in the data used in its calculation. More specifically, the EMA gives a higher weighting to recent prices, while the SMA assigns an equal weighting to all values."
Source: www.investopedia.com
In this indicator, I've included 6 popular moving averages that are commonly used. Most traders will find specific settings for their own personal trading style.
Along with the EMA and SMA, another indicator that is good for finding confluence between these two is the Ichimoku Cloud.
" What is the Ichimoku Cloud?
The Ichimoku Cloud is a collection of technical indicators that show support and resistance levels, as well as momentum and trend direction. It does this by taking multiple averages and plotting them on the chart. It also uses these figures to compute a "cloud" which attempts to forecast where the price may find support or resistance in the future.
The Ichimoku cloud was developed by Goichi Hosoda, a Japanese journalist, and published in the late 1960s.1 It provides more data points than the standard candlestick chart. While it seems complicated at first glance, those familiar with how to read the charts often find it easy to understand with well-defined trading signals."
More info can be seen here: www.investopedia.com
I have changed the default settings on the Ichimoku to suit cryptocurrency trading (as cryptocurrency is usually fast and thus require slightly longer lookbacks) to 20 60 120 30.
Along with the Ichimoku, I like to use Bollinger Bands to not only find confluence for support and resistance but for price discovery targets and trend strength.
" What Is a Bollinger Band®?
A Bollinger Band® is a technical analysis tool defined by a set of trendlines plotted two standard deviations (positively and negatively) away from a simple moving average (SMA) of a security's price, but which can be adjusted to user preferences.
Bollinger Bands® were developed and copyrighted by famous technical trader John Bollinger, designed to discover opportunities that give investors a higher probability of properly identifying when an asset is oversold or overbought."
This article goes into great detail of the complexities of using the Bollinger band and how to use it.
=======
This indicator combines all these powerful indicators into one so that it is easier to input different settings, turn specific tools on or off and can be easily customised.

Ichimoku EMA WaveThis script combines a customizable Ichimoku Cloud/ EMA combination to provide a quick trend visualisation.
For example, long entries can be found when the green EMA wave rises above the Ichimoku cloud.
Combine it with some oscillators (like MACD) for good results.
Also, experimenting with a different "wavelength" (default 50) and/or EMA length (default10) for different securities is a good idea.
Script is free to use and to modify at ones liking.
Lower Time Frame ScalperThis indicator is meant to identify lower timeframe momentum shifts in Forex pairs by using simple moving averages and the Kijun Sen indicator around key psychological levels.
Alert functionality for buy and sell conditions have also been built in to allow the trader time away from charts.

3SMA + Ichimoku 2leadlineThis indicator simultaneously displays two lines, which are the leading spans of the Ichimoku Kinko Hyo, and three simple moving averages.
To make it easier to distinguish between the simple moving average line and the line of the Ichimoku Kinko Hyo, the simple moving average line is set to level 2 thickness by default.
Also, the color of Reading Span 1 in the Ichimoku Kinko Hyo has been changed from green to lime to improve color visibility.
I (author of this indicator) use this indicator especially as a simple perspective on the cryptocurrency BTC / USD(USDT).
If this indicator is a problem, moderators don't know about tradingview beginners.
" Visibility " should be a high-priority item not only for indicators but also for graph requirements.
Visibility is one of the most important factors for investors who have to make instant decisions in one minute and one second.
The purpose of this indicator is to display two leading spans that are easily noticed in the Ichimoku cloud and three simple moving averages whose set values can be changed.
This is because chart analysis often uses a combination of a simple moving average of three periods and two lead spans of the Ichimoku cloud.
Also, in chart analysis, green is often displayed with the same thickness on both the moving average line and the Ichimoku cloud.
Therefore, if the moving average line and the Ichimoku cloud often use the same green color, the visibility will drop. Therefore, the green color of Ichimoku cloud was changed to lime color by default.
Tradingview beginners often refer only to the two lines of the leading span of Ichimoku Cloud. Therefore, we decided not to draw lines that are difficult to use.
Many Tradingview beginners don't know that you can change the thickness of the indicator .
Therefore, this indicator shows by DEFAULT the three commonly used simple moving averages that are thickened by one step at the same time.
Also, since the same green color is often used for the Ichimoku cloud and the moving average line, the green color of the preceding span of the Ichimoku cloud is changed to lime color by default.
The originality of this indicator is that it enhances " visibility " so that novice tradingview users will not be confused on the chart screen.
The lines other than the preceding span of the Ichimoku cloud are not displayed, and the moving average line is level 2 thick so that the user can easily see it.
This indicator not only combines a simple moving average and Ichimoku cloud, but also improves "visibility" by not incorporating lines that are difficult to see from the beginning and making it only the minimum display, making it easy for beginners to understand. The purpose is to do.
If any of the other TradingView indicators already meet the following, acknowledge that this indicator is not original.
・Display 3 simple moving averages at the same time
・For visibility, the thickness of the simple moving average line is set to level 2 from the beginning.
・A setting that does not dare to draw lines other than the lead span of Ichimoku cloud.
・Make the moving average line and the Ichimoku cloud line different colors and thicknesses from the beginning.
