FVG 9:31–10:00 AM ETFVG 9:31–10:00 AM ET - Script Description
What This Script Does
This indicator finds **Fair Value Gaps (FVGs)** that form during the first 29 minutes of the U.S. stock market (9:31 AM to 10:00 AM Eastern Time). A Fair Value Gap is a price imbalance where there's a gap between candles that often becomes an important support or resistance level.
Key Features:
- **Time Window**: Only looks for FVGs between 9:31-10:00 AM ET (most important opening period)
- **One Per Day**: Finds only the first FVG that forms in this time window each day
- **Visual Display**: Draws a purple box around the gap with a clear "FVG" label
- **Price Tracking**: Monitors when price comes back to test the gap level
- **Alert System**: Sends notifications when price returns to the FVG zone
How FVGs Are Detected:
- **Bullish FVG**: When there's a gap up (low of middle candle is above high of 3rd candle back)
- **Bearish FVG**: When there's a gap down (high of middle candle is below low of 3rd candle back)
The 9:31-10:00 AM window is chosen because this is when institutions and algorithms create their biggest price moves right after market open, making these gaps very reliable.
Customization Options
User Settings
Extend FVG Box (Bars)
- **What it does**: Makes the purple box longer to the right
- **Default**: 0 (box ends right after the gap forms)
- **Options**: Any number from 0 to 100+
- **When to use**:
- Keep at 0 for clean historical view
- Set to 10-20 to track the gap during the current session
- Set higher for longer reference
Code Settings (Can Be Changed)
Time Window
- **Start**: 9:31 AM Eastern Time
- **End**: 10:00 AM Eastern Time
- **Can modify**: Change the hour/minute numbers in the code
Visual Style
- **Color**: Purple with see-through background
- **Label**: Shows "FVG" text in white
- **Can modify**: Change colors and transparency in the code
How to Use:
Setup
Chart Settings
1. Use 1-minute, 5-minute, or 15-minute charts (works best on these timeframes)
2. Apply to liquid markets like ES, NQ, major stocks, or forex pairs
3. Set the "Extend FVG Box" to your preference (start with 0 or 10)
What You'll See
- A purple box appears when an FVG forms during 9:31-10:00 AM
- Box shows the exact price levels of the gap
- "FVG" label appears on the box
- Only one FVG per day will be marked
Trading Strategies
Basic FVG Trading
1. **Wait for Formation**: Let the purple box appear during 9:31-10:00 AM
2. **Watch Price Movement**: See if price moves away from the gap
3. **Enter on Retest**: When price comes back to the purple box area, consider entering
4. **Trade Direction**:
- Bullish FVG = look for long opportunities when price retests
- Bearish FVG = look for short opportunities when price retests
Entry Methods
- **Bounce Play**: Enter when price touches the FVG box and bounces away
- **Break Play**: Enter if price strongly breaks through the FVG box
- **Rejection Play**: Enter opposite direction if price gets rejected at the FVG
Risk Management
Stop Losses
- Place stops just outside the FVG box (a few ticks beyond the gap)
- If trading a bounce, stop goes on opposite side of the gap
- If trading a break, stop goes back inside the gap
Position Sizing
- Start small until you understand how FVGs work in your market
- Bigger gaps = smaller position size (more risk)
- Smaller gaps = can use larger position size
Profit Targets
- Take profits at obvious levels like round numbers, previous highs/lows
- Consider taking half profits at 1:1 risk/reward ratio
- Let some position run if the move is strong
Best Practices
When It Works Best
- High-volume stocks and futures (ES, NQ work great)
- Normal market days without major news during the 9:31-10:00 window
- When there's clear institutional activity in the opening period
When to Be Careful
- Low-volume stocks or markets
- Major economic news releases during the time window
- Market holidays when volume is low
- Very choppy or sideways days
Alert Usage
- The script will alert you when price comes back to test the FVG
- Don't trade the alert blindly - always check the current market situation
- Use the alert as a heads-up to start watching the setup more closely
Tips for Success
- The earlier the FVG forms in the 9:31-10:00 window, often the more significant it is
- FVGs that form with high volume are usually more reliable
- Always consider the overall market direction - don't fight the main trend
- Practice on paper first to understand how FVGs behave in your chosen market
🔗 Works Best With:
✅ Liquidity Levels — Smart Swing Lows: Spot key structural lows that can fuel stop hunts and reversals.
✅ ICT Turtle Soup — Liquidity Reversal: Add a classic reversal pattern to your toolkit to catch fakeouts cleanly.
✅ ICT SMC Liquidity Grabs and OBs- Liquidity Grabs, Order Block Zones, and Fibonacci OTE Levels, allowing traders to identify institutional entry models with clean, rule-based visual signals.
This script is most valuable for day traders who want to catch institutional moves right after market open, but it can also help swing traders identify important intraday levels.
✅ ICT Macro Zones (Grey Box Version)- It tracks real-time highs and lows for each Silver Bullet session.
✅ Weekly Opening Gap (cryptonnnite)
Ictfairvaluegap

First FVG Custom Time RangeFirst FVG — Opening Range Fair Value Gap Detector
Smart Money Opening Imbalance Strategy Tool
This script automatically detects and highlights the first Fair Value Gap (FVG) that forms between 9:30 and 10:00 AM Eastern Time (New York session open) — a critical period often referred to as the Opening Range. It’s designed for Smart Money traders looking to isolate early-morning inefficiencies that may influence market behavior throughout the trading day.
🔍 What This Script Does:
Automatically Detects the First FVG in the Opening Range
Scans price action between 9:30 and 10:00 AM ET and identifies the first valid bullish or bearish FVG that forms.
Only one FVG is shown per day — ensuring a clean, focused view.
Draws a Visual Zone
Once detected, the FVG zone is extended forward on the chart (customizable duration).
A labeled zone helps users track how price reacts to it throughout the session.
Optional Retest Alerts
Alerts you when price re-enters the zone — a potential reaction point used by SMC traders.
Customization Options
Set your preferred session time window
Adjust zone duration (in bars)
Customize label font size, colors, and visibility
Enable/disable alert on retest
📈 Why the First FVG Matters:
Time-Sensitive Setup: The first FVG typically forms no earlier than 9:31 AM ET and represents a potential “time distortion” or imbalance zone created by aggressive market participants during the open.
Behavioral Study: Many traders journal how price behaves around this zone each day — whether it acts as support, resistance, or gets traded through later in the session.
Predictive Value: Observing how this zone is respected or broken can provide anticipatory insight into intraday price action, rather than reactive analysis.
Great for New Traders: This opening FVG is often recommended as a starting reference point for building trade models and understanding how institutional imbalances unfold.
🚀 What Makes It Unique:
This tool doesn’t spam your chart with every FVG. It laser-focuses on a single, time-bound zone backed by institutional logic — the first presented imbalance of the day during the opening range.
Use it to:
Monitor price behavior around early inefficiencies
Plan journal entries and pattern recognition
Align intraday setups with a high-probability SMC model
Whether you’re scalping, journaling market structure, or refining entries based on liquidity behavior — this script helps you make the first 30 minutes count.

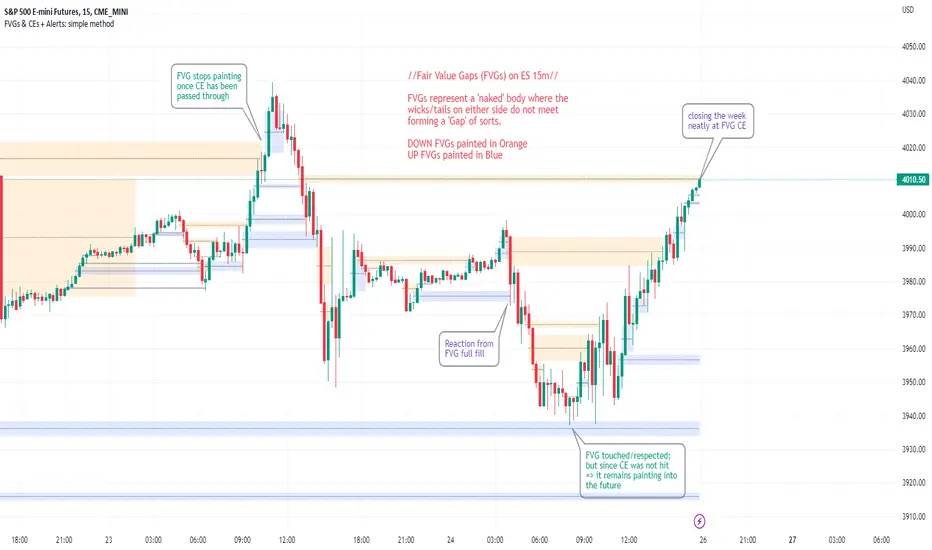
FVGs & CEs + Alerts: simple & efficient methodFair Value Gap indicator: Paints FVGs and their midlines (CEs). Stops painting when CE is hit, or when fully filled; user choice of threshold. This threshold is also used in the Alert conditions.
~~Plotted here on ES1! (CME), on the 15m timeframe~~
-A FVG represents a 'naked' body where the wicks/tails on either side do not meet. This can be seen as a type of 'gap', which price will have a tendency to want to re-fill (in part or in full).
-The midline (CE, or 'Consequent encroachment') of FVGs also tend to show price sensitivity.
-This indicator paints all FVGs until priced into, and should give an idea of which are more meaningful and which are best ignored (based on context: location, Time of day, market structure, etc).
-This is a simpler and more efficient method of painting Fair value gaps which auto-stop painting when price reaches them.
//Aims of Publishing:
-Education of ICT concepts of Fair Value Gaps and their midlines (CEs): To easily see via forward testing or backtesting, the sensitivity that price shows to these areas & levels.
-Demonstration of a much more efficient way of plotting FVGs which terminate at price, thanks to a modification of @Bjorgums's clever looping method referenced below.
//Settings:
-Toggle on/off upward and downward FVGs independently(blue and orange by default).
-Toggle on/off midline (CE).
-Standard color/line formatting options.
-Choose Threshold: CE of FVG or Full Fill of FVG: This will determine both the 'stop-painting' trigger and the 'Alert' trigger.
-Choose number of days lookback to control how many historical FVGs paint on chart.
//On alerts:
-Simple choice of 2 alerts:
~~One for price crossing into/above the nearest untouched 'premium' FVG above ( orange ). Trigger is user choice of CE or full fill.
~~Another for price crossing into/below the nearest untouched 'discount' FVG below (blue). Trigger is user choice of CE or full fill.
-Alerts set via the three dots in indicator status line.
//Cautionary notes:
-Do not use the alerts blindly to find trades. Wait until you have identified a good FVG above/below which you think price may show sensitivity to
-Usage on very low timeframes can cause unexpected results with alerts: due to new FVGs forming in realtime the Alert will always trigger at the most recent FVG above/ below having its threshold hit.
-Big thank you to @Bjorgum for his fantastic extendAndRemove method. Modified here for use with boxes and to integrate Alerts.
-Also Credit to ICT (inner circle trader) for the concepts used here: Fair value gaps and their Consequent Encroachment (CE).
ICT MTF FVG [MK]FVGs (Fair Value Gaps) are significant levels that may act as support or resistance to price. The script finds FVGs as per ICT trading system, then plots the full FVG to the right side of the chart. FVG boxes do not change size when they are semi-mitigated as its important to know where the original FVG midpoint lies. Plotting to the right side of price allows for a cleaner chart. The script is MTF and can display FVG boxes for the following timeframes. Chart, 5,10,15,30,1hr,4hr,8hr,12hr,D,W,M.
Below shows 1hr FVGs marked out. NOTE: this is not what the script does, this is for explanation only.
Below shows what the script will do. 1hr FVGs shown on 15min chart
