Candle Aura Glow [mqsxn]Illuminate your charts with a dynamic visual overlay that highlights the true energy behind each candle. Candle Aura Glow wraps candles in soft glowing rings, with intensity driven by Range/ATR, Volume, or Momentum. The stronger the move, the brighter and larger the aura — instantly drawing your eye to candles that actually matter.
This tool is purely visual yet highly intuitive, designed to make volatility, strength, and sentiment obvious at a glance. Whether you’re spotting institutional-sized moves, filtering noise, or simply enhancing your chart readability, Candle Aura Glow brings price action to life.
Features
- Multiple Engines: Choose glow intensity based on Range/ATR, Volume, or Momentum (ROC).
- Aura Customization: Adjust number of rings, transparency fade, horizontal/vertical padding, and color schemes.
- Directional Colors: Separate glow tones for bullish vs bearish candles.
- Performance Controls: Option to render only the most recent candles for heavy charts.
- Non-Repainting: Auras are drawn only on confirmed bars, keeping the visualization reliable.
Inputs
- Intensity Engine – Select what drives aura strength (Range/ATR, Volume, Momentum).
- ATR Length / Volume SMA / Momentum Length – Customize smoothing windows per engine.
- Glow Levels (rings) – Number of glow layers drawn per candle.
- Horizontal Pad / Vertical Pad – Control aura spread sideways and vertically (ATR-scaled).
- Min Intensity – Filter out weak candles to focus only on significant moves.
- Inner Alpha / Outer Alpha – Control fade from center outward.
- Bull/Bear Aura Colors – Customize glow color by direction.
- Use full wick – Base aura on entire wick or just the candle body.
- Only render last N bars – Improve speed by limiting glow history.
Intensity
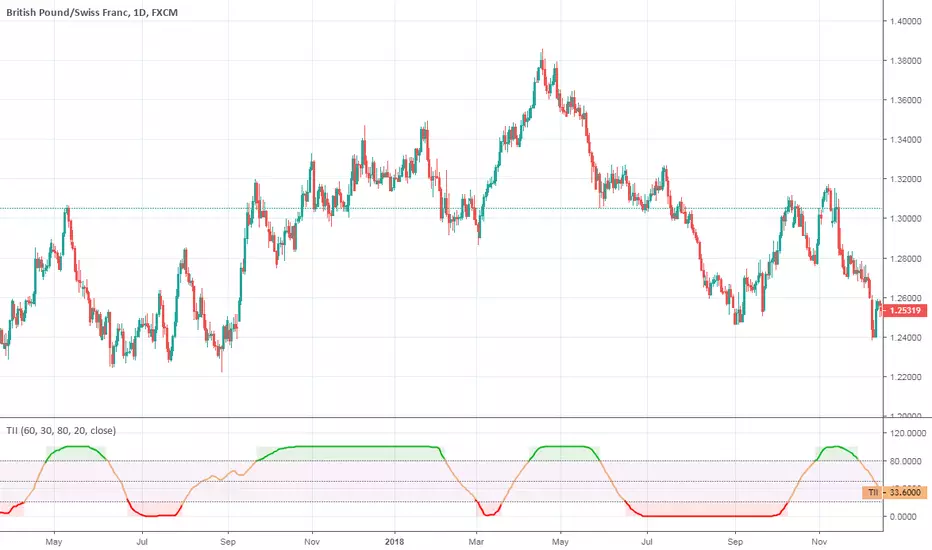
Trend Intensity IndexTrend Intensity Index indicator script. This indicator was originally developed by M. H. Pee (06/2002 issue of Stocks and Commodities Magazine)
Donchian Channel Trend Intensity [DW]This is an experimental study designed to analyze trend intensity using two Donchian Channels.
The DCTI curve is calculated by comparing the differences between Donchian highs and lows over a major an minor period, and expressing them as a positive and negative percentage.
The curve is then smoothed with an exponential moving average to provide a signal line.
Custom bar colors included with two coloring methods to choose from.
Trend Intensity Index [DW]This study is a simple variation of M. H. Pee's Trend Intensity Index that includes two signal lines rather than one for additional trend confirmation.